
Abstract
Objective: To evaluate the impact of late 3rd trimester fetal growth cessation on anatomical birth characteristic predictions used in classifying SGA neonates.
Methods: A prospective longitudinal study was performed in 119 pregnancies with normal neonatal growth outcomes. Seven biometric parameters were measured at 3–4 weeks intervals using 3D ultrasonography. Rossavik size models were determined to predict birth characteristics at different ages. Percent Differences (% Diff) were calculated from predicted and measured birth characteristics. Growth Cessation Ages (GCA) were identified when no systematic change in % Diff values occurred after specified prediction ages. Systematic and random prediction errors were compared using different assumptions about the GCA. Predicted and measured size parameters were used to determine six new Growth Potential Realization Index (GPRI) reference ranges. Five were used to sub-classify 34 SGA neonates (weight < 10th percentile) based on the number of abnormal GPRI values.
Results: Growth cessation ages were 38 weeks for HC, AC, mid-thigh circumference, estimated weight and mid-arm circumference. Crown-heel length GCA was 38.5 weeks. At GCA, birth characteristics had prediction errors that varied from 0.08 ± 3.4% to 15.7 ± 9.1% and zero % Diff slopes after 38 weeks. Assuming growth to delivery gave increased systematic and random prediction errors as well as positive % Diff slopes after 38 weeks, MA. Seventeen of the SGA neonates had 0 or 1 abnormal GPRI values [Subgroup 1] and 17 others had 2 or more abnormal values [Subgroup 2]. In Subgroup 1, 4/85 (4.7%) of GPRI's were abnormal while in Subgroup 2, 43/85 (50.6%) were abnormal. Use of only one type of GPRI for SGA subclassification resulted in substantial false negative and some false positive rates when compared to subclassification based on all five GPRI values.
Conclusions: Growth cessation occurred at approximately 38 weeks for all six birth characteristics studied. SGA neonates can be separated into normal and growth restricted subgroups based on the frequency of abnormal GPRI values (GPRI Profile Classification).
Introduction
The prenatal prediction of perinatal complications is a clinically important goal of current obstetrical research [Citation1–3]. Because of an increased incidence of these complications in small-for-gestational-age neonates (SGA) [Citation4–16], estimated fetal weight (EFW) is commonly used to predict associated morbidity and mortality in clinical practice [Citation17–19]. SGA newborns have been shown to have different growth or physiological outcomes when evaluated with Individualized Growth Assessment (IGA) or there is evidence of placental insufficiency [Citation9,Citation20,Citation21], the perinatal complication rates being higher in specific SGA subgroups [Citation14,Citation22,Citation23]. A more detailed study of SGA subgroup characteristics could identify parameters that improve antenatal prediction of these complications [Citation24–34].
Deter and Harrist [Citation35] have proposed a neonatal growth profile as an alternative to the traditional birth weight classification system. This profile consists of five anatomical parameters: head circumference (HC), abdominal circumference (AC), mid-thigh circumference (ThC), crown-heel length (CHL), and weight (WT), measured within 24–48 hours of delivery. The measurements are not compared to population standards but, rather to individually predicted values for each specific parameter, obtained using Rossavik size models. Such models are derived from 2nd trimester growth velocities, [empirical indicators of known and unknown growth controllers], determined during a time when aberrant growth is usually absent [Citation36]. For each anatomical parameter, a Growth Potential Realization Index (GPRI) value is calculated using the following equation: GPRI = ([actual measurement ÷ predicted measurement]) × 100. Sets of GPRI values have revealed several abnormal growth patterns in both IUGR and macrosomic neonates [Citation37]. Because GPRI's correct for differences in growth potential as well as age at delivery, they represent a significant improvement over conventional methods for evaluating neonatal growth status.
The potential utility of GPRI profiles depends on the accuracy of the predicted anatomical birth characteristics used to evaluate neonatal growth status. A major factor in determining this accuracy is the choice of time point at which the predictions are made. The obvious choice would be the age at birth. However, as shown previously [Citation38], fetal growth appears to stop or is greatly diminished at 38–39 weeks, menstrual age (MA) (Growth Cessation Age (GCA)). This observation is consistent with evidence of discontinuous normal fetal growth during the 3rd trimester [Citation39] and documented pulsatile and saltatory growth patterns in normal children [Citation40,Citation41].
Our investigation further examines the growth cessation phenomenon in a sample that is 2- to 6-fold larger than those used previously. Six anatomical parameters (EWT, FDL, HC, AC, ThC and ArmC) were studied. Appropriate GCAs were established for each parameter and used in predicting birth measurements (WT, CHL, HC, AC, ThC and ArmC). Predicted and measured birth characteristics provided the data for calculating new GPRI reference ranges. GPRI reference ranges for WT, CHL, HC, AC and ThC were used in a preliminary study to determine if classifying GPRI values as normal or abnormal could separate truly growth-restricted SGA neonates from those with no or minimal evidence of intrauterine malnutrition.
Methods
The sample and methods used in this investigation have been described in detail previously [Citation35,Citation42]. A brief description is provided below. A prospective longitudinal study was carried out using a protocol approved by the Human Investigation Committee at William Beaumont Hospital (Royal Oak, MI) and the Institutional Review Board at the National Institute of Child Health and Human Development (Bethesda, MD).
Study sample
A sample of 119 pregnancies, from a longitudinal study of fetal growth and neonatal growth outcome, was obtained at William Beaumont Hospital, Royal Oak, MI. Pregnancies were selected based on normal neonatal growth outcomes that were identified using a specific form of the five members (HC, AC, ThC, CHL and WT) modified Neonatal Growth Assessment Score [m3NGAS51] and a sample-specific, 95% reference range (177–218% ). Comprehensive evaluations of fetal growth using Individualized Growth Assessment (IGA) indicated that these fetuses had normal prenatal growth [Citation42]. Delivery was at 39 ± 1.4 weeks, MA. A detailed description of the sample is given in Reference [Citation42].
Ultrasound studies
Fetal ages were determined primarily from 1st trimester CRL measurements or LMP data, the latter, confirmed by 2nd trimester ultrasound studies, as described previously [Citation42]. Serial ultrasound examinations were carried out beginning at 18 weeks, MA (first scan: 18.6 ± 0.7 S.D. weeks) and ending at approximately 37 weeks, MA ((last scan: 37.4 ± 1.5 SD weeks). The number of scans per fetus was 6.8 ± 0.8 SD. The last-scan-to-delivery interval was 1.7 ± 1.2 SD weeks. Three-dimensional ultrasonography with hybrid mechanical and curved array abdominal transducers (Voluson systems: 730, 730 Expert, and E8; GE Healthcare, Milwaukee, WI) was used to acquire volume data sets at each examination. With these data sets, biparietal diameter (BPD), HC, AC, ThC, femur diaphysis length (FDL), upper arm circumference (ArmC) and fractional thigh volume (TVol) measurements were obtained as previously described [Citation42]. In some cases measurements were not available, resulting in samples that varied from 112 to 118. These measurements were used to specify 2nd trimester Rossavik size models [Citation42]. Using these size models, predicted values for HC, AC, ThC, ArmC, CHL and WT at birth were obtained as described in the “Data analysis” section.
Neonatal evaluation
Within 48 hours after delivery, six anatomical measurements (WT, CHL, HC, AC, ThC and ArmC) were obtained from each neonate as previously described [Citation38,Citation43–45]. These measurements were used to evaluate neonatal growth status [Citation37,Citation38,Citation43,Citation45].
Data analysis
Second trimester model specification
Rossavik size models [P = c (t) k + st] can be specified in the 2nd trimester if the time variable t is properly defined and coefficient (c, k, s) estimates are obtained. To correct for MA and differences in the timing of embryological development, the t variable was defined as MA minus Start Point (SP), the latter being closely related to the age at which the anatomical parameter appears in embryogenesis [Citation36]. Start Points for each anatomical parameter in individual fetuses were obtained from measurements obtained before 28.2 weeks, MA, using linear regression analysis [Citation46]. Estimates of coefficients k [representing anatomical characteristics] for different parameters were obtained by regression analysis and subsequently fixed at their mean values to significantly reduce the variabilities of Coefficients c* and s*. [Citation42]. Individual Coefficients c* values (related to growth potential) were estimated from the 2nd trimester growth curves (slope) using functions relating c* to slope [Citation42]. Similarly, individual Coefficient s* (unknown control system) estimates were obtained using the Coefficient c* estimates and functions relating s* to c* [Citation42].
Prediction of birth characteristics
After specifying 2nd trimester Rossavik fetal size models, birth characteristics (BPD, HC, AC, ThC, FDL, ArmC and TVol) were predicted at different time points. As previous studies in American fetuses indicated that growth cessation occurs at 38 weeks [GCA] [Citation38], birth characteristics were predicted at the actual birth age for those fetuses delivering at 38 weeks, MA, or before and at 38 weeks for those delivering after 38 weeks, MA. For CHL, predictions at several ages had to be made in order to find the correct GCA. In all such studies, predicted values for FDL, obtained using appropriate Rossavik size models, were converted to predicted CHL values using a function for singletons [Citation43]. Predicted WT values, based on predicted values of BPD, AC and TVol, were obtained using the weight estimation function described by Lee and co-workers [Citation47]:
Systematic and random prediction errors
Predicted birth measurements at the GCA were compared to actual birth measurements and the Percent Differences [% Diff] calculated using the following equation [Citation38]:
Linear regression analysis was used to determine if there was a relationship between Percent Differences and birth age. The slopes of the linear functions were compared to zero using the t-test. A significant negative slope indicated further growth after the assumed GCA. A significant positive slope indicated growth cessation before the assumed GCA. A slope not significantly different from zero indicated that the correct GCA had been chosen.
Means and SD's of the % Diff (based on predicted values at the appropriate GCA's) were calculated for each anatomical parameter. Means were compared to zero using a one-sample t-test. Means that deviated significantly from zero were taken as indicative of systematic prediction errors and used to specify correction factors for these systematic errors (Appendix) [Citation38]. Random prediction errors were defined as the range containing 95% of the % Diff values.
Effect of choice of GCA on % Diff
% Diff between predicted and measured values were calculated for each size parameter in a subset of fetuses delivering after 38 weeks, MA. Predicted measurements were obtained assuming GCA's of 38 weeks (HC, AC, ThC, WT and ArmC) or 38.5 weeks (CHL). A second set of predicted measurements were obtained at the actual birth ages for HC, AC, ThC, CHL, WT and ArmC. Linear equations were fit to the % Diff as a function of birth age. The slopes of these linear functions were evaluated as described above. Systematic prediction errors in the two groups with the different GCA assumptions were compared by paired t-test. Random prediction errors in these groups were compared using the Pitman test for correlated variances.
Growth Potential Realization Index
Using measured and predicted birth characteristics, GPRI values for six anatomical parameters (WT, CHL, HC, AC, ThC and ArmC) were calculated with one of two equations [Citation38,Citation43,Citation45]:
or
Correction factors were determined as described in the Appendix. Means and standard deviations for different GPRI's were calculated and mean values were compared to 100 (value of the GPRI when the predicted and actual measurements are equal) using the one-sample t-test. Ranges containing 95% of the GPRI values were determined for all six anatomical parameters.
Definition of SGA subgroups using GPRI profiles
In a preliminary study, a sample of 34 neonates considered to be SGA (below the 10th percentile) by the birth weight standards of Oken et al. [Citation48] were selected from those in our previous studies of IUGR [Citation49,Citation50]. Data on GPRI values for WT, CHL, HC, AC and ThC, calculated as described above, were available for each neonate. A composite statistic called the modified Neonatal Growth Assessment Score (m3NGAS51), was calculated using the five GPRI values [Citation37]. Individual GPRI values were compared to the new reference ranges described above. Individual m3NGAS51 values were compared to 177% , the lower limit of the 95% reference range determined in a previous investigation [Citation42]. Percent body fat values (determined by air displacement plethysmography) were assessed by comparisons to age-specific 2 SD reference ranges (unpublished) derived from previously published data [Citation50]. Evaluation of GPRI values was carried out by calculating pathological GPRIAP values [−pGPRI], defined as follows:
A positive difference indicates that the GPRIAP value was not below the reference range so no negative pGPRIAP values were found. Such differences were assigned a value of zero.
Individual neonates were sorted into two SGA subgroups (Subgroup 1 and Subgroup 2) based on the number of −pGPRI values. Those with 0 or 1 were placed in Subgroup 1 while those with 2 or more were placed in Subgroup 2. The frequency of −pGPRI values for different types of GPRI's, as well as abnormal m3NGAS51, in the two SGA subgroups, were compared using the Chi-square test. Mean values were compared using the two-sample t-test. The ability of different types of GPRI's and the m3NGAS51 to identify these two SGA subgroups was evaluated by determining the false positive and false negative rates (membership in Subgroup 2 being positive). A p value < 0.05 was considered to indicate a statistically significant difference in all statistical tests.
Results
Prediction of birth characteristics
Most previous investigations using Individualized Growth Assessment have reported a GCA around 38 weeks, MA [Citation38,Citation43–45,Citation51–54]. Therefore, we also assumed a GCA of 38 weeks for our preliminary studies. All linear function slopes relating % Diff to Birth Age (BA) were not different from zero, except for CHL; () confirming that 38 weeks was an appropriate GCA for these parameters. For CHL, the slope of the linear function was negative and significantly different from zero, indicating that the GCA had not been reached. However, use of a GCA value of 38.5 weeks resulted in a slope that was not significantly different from zero. Corresponding predictions at these GCA's indicated that the systematic prediction errors were not different from zero for the two skeletal parameters (HC, CHL) but systematic over- or under-estimations for the four soft tissue parameters (AC (+10.3%), ThC (+11.7%), ArmC (+15.0%) and WT (−4.3%)) were observed. Based on these results, correction factors for the six parameters studied were: HC: 1.000; AC: 0.897; ThC: 0.883; CHL: 1.000; WT: 1.043: ArmC: 0.850. Random prediction errors were relatively low for the two skeletal parameters (4.0%, 3.4%) but doubled for soft tissue parameters (ThC: 8.6% ; ArmC: 9.1% , WT: 8.4% ), with the exception of AC (5.7% ).
Table 1. Optimal size cessation ages for fetal size parameters.
Choice of GCA
Use of two different GCA's (i.e. 38 weeks, MA. versus actual birth age) was further examined in pregnancies delivering after 38 weeks (, ). For all anatomical parameters studied, % Diff values calculated with predicted values at 38 weeks (except for CHL: 38.5 weeks), showed no relationship with MA at delivery (i.e. slopes were not significantly different from zero). Systematic and random prediction errors for these parameters were similar to those obtained for the complete sample (). Use of predicted values at birth age resulted in % Diff values that had significantly positive relationships with MA at delivery (i.e. the slopes for six anatomical parameters were significantly different from zero). The systematic prediction errors were significantly greater than those found using predictions at 38 weeks (CHL: 38.5 weeks) (paired t-test, p < 0.05). Random prediction errors were also larger but, only those for HC, ThC and WT were statistically significant (Pitman test for correlated variances, p < 0.05).
Figure 1. (a) Percent difference (%) versus birth age (weeks) assuming a growth cessation age or growth-to-delivery for head circumference (HC), abdominal circumference (AC) and mid-thigh circumference (ThC). (b) Percent difference (%) versus birth age (weeks) assuming growth cessation age or growth-to-delivery for crown-heel length (CHL), weight (WT) and mid-arm circumference (ArmC). Growth cessation at 38 weeks, MA, was assumed for all parameters except CHL (38.5 weeks). Percent differences = [(predicted – measured)/measured] × 100. The number of observations and comparison of the linear slope to zero are given at the bottom of each subfigure.
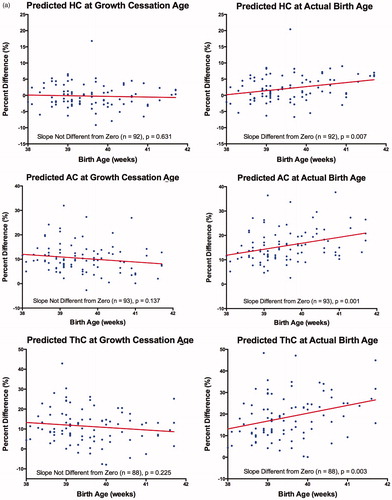
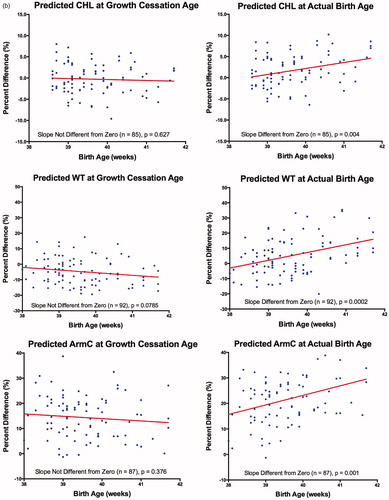
Table 2. Effect of using two different growth cessation age (GCA) assumptions for percent differences.
GPRI reference ranges
summarizes new GPRI reference ranges (based on available samples) using sample-specific size model specification procedures and correction factors. Mean values were close to the ideal value of 100 for all anatomical parameters although small, but statistically significant, differences were observed for AC, ThC and ArmC. The 95% ranges were smallest for the two skeletal parameters (HC, CHL), intermediate for AC, and largest for the other three soft tissue parameters (ThC, ArmC, WT).
Table 3. Growth Potential Realization Index (GPRI) reference ranges.
Characteristics of two SGA subgroups separated by the number of GPRI values
As indicated in , there were 17 (50% ) neonates in each SGA subgroup. In Subgroup 1, there were only 4/85 (4.7% ) −pGPRI values, with 4 neonates having a single value and 13 having none. Of the four −pGPRI values, 2/4 (50% ) were within 2 percentage points of their lower limits. These values could be normal values excluded by the 95% reference ranges used to evaluate the GPRI values. Only 3/17 [17.6% ] m3NGAS51 values were abnormal and two (66.7% ) were only four percentage points below the lower reference range boundary (possible excluded normal values). Subgroup 2 had 43/85 (50.6% ) −pGPRI values, ranging from 35.3% (GPRIHC, GPRIAC) to 76.5% (GPRIThC) for individual anatomical parameters (). Only 7/44 (16.0 % ) could be excluded normal values. There were two, three, four and five –pGPRI values in eleven, three, two and one neonates, respectively. For the m3NGAS51, 15/17 (88.2% ) values were abnormal.
Table 4. Evaluations of growth outcomes in SGA neonates.
All SGA subgroup differences for −pGPRI frequencies in specific GPRI types were statistically significant, with the frequencies of Subgroup 2 being larger (). The difference in the frequencies of abnormal m3NGAS51 values in the two subgroups was also significant. All differences in mean GPRI values were significant, with the means of Subgroup 2 being smaller. False positive rates varied from 0% to 18.2% while the false negative rates varied from 18.0% to 40.0% (). All GPRI types had substantial false negative rates and two (GPRIWT, GPRIAC) had high false positive rates.
Table 5. Characterization of SGA subgroups derived from GPRI profiles.
Table 6. Individual GPRI classification compared to GPRI profile classification.
Discussion
Principal findings of this study
Growth cessation
Our results are consistent with a temporary period of fetal growth stasis starting in normal pregnancies at 38 or 38.5 weeks, MA, ( and , ). Making the assumption that fetal growth continued to delivery resulted in % Diff values that increased with birth age and significant increases in systematic prediction errors ().
Prediction of anatomical birth characteristics
Systematic prediction errors for birth characteristic predictions at their GCA's were present for soft tissue parameters (AC, ThC, WT) but not for skeletal parameters (HC, CHL), as noted previously [Citation38,Citation43,Citation45,Citation55]. Birth weight predictions derived from BPD, AC, Tvol had only a small systematic error (−4.3% ) and a relatively low random error (2 SD range: 16.5% ). These results, based on predictions made approximately 12 weeks before GCA, are very similar to those in a previous cross-sectional study that predicted birth weights within 4 days of delivery [Citation47].
Growth potential realization indices
Mean GPRI values for all anatomical parameters were very close to the ideal value of 100% and their ranges were approximately symmetrical (). For WT, a substantial increase in GPRI range was seen in our larger sample, suggesting that the smaller samples studied previously were not representative.
Separation of SGA subgroups using GPRI profile classification
Application of new GPRI standards in a preliminary study of 34 SGA newborns clearly demonstrated two different sub-types of SGA neonates (). SGA Subgroup 1 had minimal evidence of abnormal growth in the GPRI profiles and only 3/17 m3NGAS51 values were abnormally low. All members of SGA Subgroup 2 had multiple abnormal GPRI values and most of the m3NGAS51 values were abnormally low. Our results suggest that true growth-restricted SGA neonates can be identified if multiple size parameters and corrections for fetal age, growth cessation and differences in growth potential are used.
Previous studies
Growth cessation
Fetal growth stasis or “growth cessation” prior to delivery was originally described for the prediction of birth weight [Citation56] but was subsequently extended to HC, AC, ThC and CHL [Citation38,Citation43,Citation45]. GCA is identified when the % Diff / birth age curve has a zero slope (). Continued growth after a selected GCA gives a negative slope while a positive slope is found if the selected GCA is after growth cessation has occurred since Rossavik model predictions continue to rise during pregnancy.
Past studies have indicated that the GCA's for HC, AC, ThC, CHL and WT are 38 weeks, MA, in normally growing American fetuses [Citation38,Citation43,Citation45,Citation54]. Values of about 39 weeks, MA, for HC, CHL and WT have been reported in a Dutch population by Kurniawan et al. [Citation51–53]. This period of limited growth may be required to permit energy diversion to support other changes [e.g. terminal cell differentiation] [Citation57] that are required for postnatal life [Citation56]. If growth cessation does not occur, macrosomia can result even in normally growing fetuses [Citation58]. The difference in long-term academic performance [Citation59], neurodevelopment, and behavior/emotional status in neonates delivering before and after 39 weeks [Citation60] could be related to this phenomenon. Delivery before the GCA of HC, around 38 weeks, could interrupt normal brain growth and development while delivery afterwards may not.
Prediction of anatomical birth characteristics
Few publications have presented systematic and random prediction errors obtained with Individualized Growth Assessment in American singleton pregnancies. Only one set of data is available for CHL [Citation43], two for HC and AC [Citation38,Citation55], and three studies for ThC [Citation38,Citation54,Citation55]. In fifty Dutch fetuses/neonates [Citation51], the HC systematic prediction errors were similar [mean: −0.2% versus 0.0% (current study)] but random prediction errors were lower [2 SD: ± 3.3% versus ± 8.0% (current study)]. For CHL [Citation52], systematic and random prediction errors were 0.9% versus 0.1% (current study) and ± 6.6% versus ± 6.8% (current study), respectively. Similar systematic [(mean: 2.3% versus −4.3% (current study)] and random [2SD: 18.6% , versus 16.8% (current study)] prediction errors were found for WT [Citation53].
For WT only, there have been six other published investigations, two using the scan-to-delivery interval as an independent variable in the weight estimation function [Citation61,Citation62] and four using methods that assume constant growth along cross-sectional size percentile lines in the 3rd trimester [Citation63–66]. The scan-to-delivery interval studies, predicting only from around 35 weeks, gave similar systematic but larger random prediction errors. Use of the constant percentile line growth method [from 33 to 37 weeks to delivery] resulted in systematic prediction errors ranging from −0.1% to 8.5% and random prediction errors ranging from 16% to 30% . A more detailed presentation of systematic and random prediction errors are given in Supplementary File #1.
Growth potential realization indices
Despite the many differences between the current study and those done previously [Citation38,Citation43,Citation45,Citation55], the GPRI means and ranges were quite similar for HC, ThC and CHL. The current GPRIAC range is larger and more symmetrical than that reported by Hata et al. [Citation55] but similar to that of Deter et al. [Citation38]. Sample size seemed to be factor in determining GPRIWT ranges as they were similar but wider for large samples (50,117) (although different weight estimation procedures were used) [Citation42,Citation53] compared to those for smaller (20) samples [Citation38,Citation55]. This difference may be due to sampling error
SGA subgroups
IGA methods have been used to identify SGA subgroups in two previous investigations [Citation14,Citation23]. Both studies used an early form of the NGAS that was calculated from unweighted GPRIWT, GPRIHC and GPRIAC values. Two groups of SGA neonates were identified in these studies, one with all normal NGAS values and one with all abnormally low NGAS values. This is consistent with the current study except that Subgroup 1 had 3/17 abnormal m3NGAS51 values while Subgroup 2 had 2/17 normal values. In both previous investigations, increased incidences of perinatal complications were seen in the groups with abnormal NGAS values. These results suggest that an association of perinatal complications with our Subgroup 2 is likely.
Strengths and limitations
The strengths of this investigation are its use of pregnancies with comprehensively documented normal neonatal growth outcomes, a relatively large sample size for longitudinal studies and the use of neonatal growth outcome parameters that correct for most confounding variables in the evaluation of: (1) growth cessation, (2) prediction of anatomical birth characteristics and (3) establishment of GPRI standards. Its chief limitations are the small number of SGA neonates available for study and insufficient data on perinatal complications.
Conclusions
Fetal growth cessation near term should be taken into account\when predicting birth characteristics based on a personalized approach that considers birth age, individual growth potential, and an analysis of multiple anatomical size parameters. Our results, obtained with a sample 2 to 6 fold larger than those used previously, provide robust GPRI standards for the evaluation of neonatal size parameters on an individualized basis. Application of these criteria in a preliminary study of SGA neonates suggests that both normal and growth-restricted SGA neonates can be effectively separated using GPRI profile classifications. Evaluation of multiple GPRI parameters may allow one to effectively classify the severity of pathological growth outcomes and identify better prenatal predictors of perinatal complications. Clearly separating neonates with true growth problems from those who are just small for age may permit postnatal care based on different categories of SGA infants. Future research should be directed to an improved understanding of the relationship of these GPRI profile classifications to clinical and developmental outcomes. New software (iGAP, Individualized Growth Assessment Program) is now available to assist these who wish to further explore neonatal growth outcomes based on individualized fetal growth assessment (http://igap.research.bcm.edu).
Supplementary material available online
Supplementary_File__S1_.pdf
Download PDF (82.5 KB)Acknowledgements
The Authors wish to acknowledge the technical assistance of Melissa Powell, RDMS and Beverley McNie, BS, CCRP.
Declaration of interest
This research was supported (in part) by the Perinatology Research Branch, Division of Intramural Research, Eunice Kennedy Shriver National Institute of Child Health and Human Development, NIH, DHHS.
References
- Iraola A, Gonzalez I, Eixarch E, et al. Prediction of adverse perinatal outcome at term in small-for-gestational age fetuses: comparison of growth velocity vs. customized assessment. J Perinat Med 2008;36:531–5
- De Jong CL, Francis A, Van Geijn HP, Gardosi J. Customized fetal weight limits for antenatal detection of fetal growth restriction. Ultrasound Obstet Gynecol 2000;15:36–40
- McCowan LM, Roberts CT, Dekker GA, et al. Risk factors for small-for-gestational-age infants by customised birthweight centiles: data from an international prospective cohort study. BJOG 2010;117:1599–607
- Soothill PW, Nicolaides KH, Campbell S. Prenatal asphyxia, hyperlacticaemia, hypoglycaemia, and erythroblastosis in growth retarded fetuses. Br Med J (Clin Res Ed) 1987;294:1051–3
- de Jong CL, Francis A, van Geijn HP, Gardosi J. Fetal growth rate and adverse perinatal events. Ultrasound Obstet Gynecol 1999;13:86–9
- McIntire DD, Bloom SL, Casey BM, Leveno KJ. Birth weight in relation to morbidity and mortality among newborn infants. N Engl J Med 1999;340:1234–8
- Clausson B, Gardosi J, Francis A, Cnattingius S. Perinatal outcome in SGA births defined by customised versus population-based birthweight standards. BJOG 2001;108:830–4
- Figueras F, Eixarch E, Gratacos E, Gardosi J. Predictiveness of antenatal umbilical artery Doppler for adverse pregnancy outcome in small-for-gestational-age babies according to customised birthweight centiles: population-based study. BJOG 2008;115:590–4
- Miller J, Turan S, Baschat AA. Fetal growth restriction. Semin Perinatol 2008;32:274–80
- Figueras F, Gardosi J. Intrauterine growth restriction: new concepts in antenatal surveillance, diagnosis, and management. Am J Obstet Gynecol 2011;204:288–300
- Boers KE, van der Post JA, Mol BW, et al. Labour and neonatal outcome in small for gestational age babies delivered beyond 36+0 weeks: a retrospective cohort study. J Pregnancy 2011;2011:293516
- Fratelli N, Valcamonico A, Prefumo F, et al. Effects of antenatal recognition and follow-up on perinatal outcomes in small-for-gestational age infants delivered after 36 weeks. Acta Obstet Gynecol Scand 2013;92:223–9
- Parra-Saavedra M, Crovetto F, Triunfo S, et al. Added value of umbilical vein flow as a predictor of perinatal outcome in term small-for-gestational-age fetuses. Ultrasound Obstet Gynecol 2013;42:189–95
- von Beckerath AK, Kollmann M, Rotky-Fast C, et al. Perinatal complications and long-term neurodevelopmental outcome of infants with intrauterine growth restriction. Am J Obstet Gynecol 2013;208:130 e1–6
- Savchev S, Figueras F, Cruz-Martinez R, et al. Estimated weight centile as a predictor of perinatal outcome in small-for-gestational-age pregnancies with normal fetal and maternal Doppler indices. Ultrasound Obstet Gynecol 2012;39:299–303
- Verlijsdonk JW, Winkens B, Boers K, et al. Suspected versus non-suspected small-for-gestational age fetuses at term: perinatal outcomes. J Matern Fetal Neonatal Med 2012;25:938–43
- Figueras F, Figueras J, Meler E, et al. Customised birthweight standards accurately predict perinatal morbidity. Arch Dis Child Fetal Neonatal Ed 2007;92:F277–80
- Gardosi J. Customised assessment of fetal growth potential: implications for perinatal care. Arch Dis Child Fetal Neonatal Ed 2012;97:F314–17
- Barker ED, McAuliffe FM, Alderdice F, et al. The role of growth trajectories in classifying fetal growth restriction. Obstet Gynecol 2013;122:248–54
- Baschat AA, Cosmi E, Bilardo CM, et al. Predictors of neonatal outcome in early-onset placental dysfunction. Obstet Gynecol 2007;109:253–61
- Neerhof MG, Thaete LG. The fetal response to chronic placental insufficiency. Semin Perinatol 2008;32:201–5
- Simon NV, Deter RL, Kofinas AD, et al. Small-for-menstrual-age infants: different subgroups detected using individualized fetal growth assessment. J Clin Ultrasound 1994;22:3–10
- Hata T, Kuno A, Akiyama M, et al. Detection of small-for-gestational-age infants with poor perinatal outcomes using individualized growth assessment. Gynecol Obstet Invest 1999;47:162–5
- Campbell S, Thoms A. Ultrasound measurement of the fetal head to abdomen circumference ratio in the assessment of growth retardation. Br J Obstet Gynaecol 1977;84:165–74
- Wladimiroff JW, Bloemsma CA, Wallenburg HC. Ultrasonic assessment of fetal growth. Acta Obstet Gynecol Scand 1977;56:37–42
- Chaiworapongsa T, Espinoza J, Gotsch F, et al. The maternal plasma soluble vascular endothelial growth factor receptor-1 concentration is elevated in SGA and the magnitude of the increase relates to Doppler abnormalities in the maternal and fetal circulation. J Matern Fetal Neonatal Med 2008;21:25–40
- Dicke JM, Huettner P, Yan S, et al. Umbilical artery Doppler indices in small for gestational age fetuses: correlation with adverse outcomes and placental abnormalities. J Ultrasound Med 2009;28:1603–10
- Illa M, Coloma JL, Eixarch E, et al. Growth deficit in term small-for-gestational fetuses with normal umbilical artery Doppler is associated with adverse outcome. J Perinat Med 2009;37:48–52
- Oros D, Figueras F, Cruz-Martinez R, et al. Middle versus anterior cerebral artery Doppler for the prediction of perinatal outcome and neonatal neurobehavior in term small-for-gestational-age fetuses with normal umbilical artery Doppler. Ultrasound Obstet Gynecol 2010;35:456–61
- Oros D, Figueras F, Cruz-Martinez R, et al. Longitudinal changes in uterine, umbilical and fetal cerebral Doppler indices in late-onset small-for-gestational age fetuses. Ultrasound Obstet Gynecol 2011;37:191–5
- Mayer C, Joseph KS. Fetal growth: a review of terms, concepts and issues relevant to obstetrics. Ultrasound Obstet Gynecol 2013;41:136–45
- Di Lorenzo G, Monasta L, Ceccarello M, et al. Third trimester abdominal circumference, estimated fetal weight and uterine artery doppler for the identification of newborns small and large for gestational age. Eur J Obstet Gynecol Reprod Biol 2013;166:133–8
- Unterscheider J, Daly S, Geary MP, et al. Predictable progressive Doppler deterioration in IUGR: does it really exist? Am J Obstet Gynecol 2013;209:539 e1–7
- Unterscheider J, Daly S, Geary MP, et al. Optimizing the definition of intrauterine growth restriction: the multicenter prospective PORTO Study. Am J Obstet Gynecol 2013;208:290 e1–6
- Deter RL, Harrist RB. Assessment of normal fetal growth. In: Chervenak FA, Isaacson GC, Campbell S, eds. Ultrasound in obstetrics and gynecology. Boston (MA): Litle, Brown and Company; 1993:361–86
- Deter RL. Individualized growth assessment: evaluation of growth using each fetus as its own control. Semin Perinatol 2004;28:23–32
- Deter RL, Spence LR. Identification of macrosomic, normal and intrauterine growth retarded neonates using the modified Neonatal Growth Assessment Score. Fetal Diagn Ther 2004;19:58–67
- Deter RL, Hill RM, Tennyson LM. Predicting the birth characteristics of normal fetuses 14 weeks before delivery. J Clin Ultrasound 1989;17:89–93
- Bernstein IM, Blake K, Wall B, Badger GJ. Evidence that normal fetal growth can be noncontinuous. Obstet Gynecol Surv 1996;51:213–14
- Lampl M, Johnson ML. A case study of daily growth during adolescence: a single spurt or changes in the dynamics of saltatory growth? Ann Hum Biol 1993;20:595–603
- Lampl M, Thompson AL. Growth chart curves do not describe individual growth biology. Am J Hum Biol 2007;19:643–53
- Deter RL, Lee W, Sangi-Haghpeykar H, et al. Individualized fetal growth assessment: critical evaluation of key concepts in the specification of third trimester size trajectories. J Matern Fetal Neonatal Med 2014;27:537–42
- Milner LL, Deter RL, Hill RM, et al. Prediction of neonatal crown-heel length in normal singletons, twins, and triplets using individualized growth assessment. J Clin Ultrasound 1994;22:253–6
- Lee W, Deter RL, McNie B, et al. The fetal arm: individualized growth assessment in normal pregnancies. J Ultrasound Med 2005;24:817–28
- Lee W, Deter RL, Sameera S, et al. Individualized growth assessment of fetal thigh circumference using three-dimensional ultrasonography. Ultrasound Obstet Gynecol 2008;31:520–8
- Deter RL, Rossavik IK, Harrist RB, Hadlock FP. Mathematic modeling of fetal growth: development of individual growth curve standards. Obstet Gynecol 1986;68:156–61
- Lee W, Balasubramaniam M, Deter RL, et al. New fetal weight estimation models using fractional limb volume. Ultrasound Obstet Gynecol 2009;34:556–65
- Oken E, Kleinman KP, Rich-Edwards J, Gillman MW. A nearly continuous measure of birth weight for gestational age using a United States national reference. BMC Pediatr 2003;3:6–15
- Deter RL, Nazar R, Milner LL. Modified neonatal growth assessment score: a multivariate approach to the detection of intrauterine growth retardation in the neonate. Ultrasound Obstet Gynecol 1995;6:400–10
- Lee W, Riggs T, Koo W, et al. The relationship of newborn adiposity to fetal growth outcome based on birth weight or the modified neonatal growth assessment score. J Matern Fetal Neonatal Med 2012;25:1933–40
- Kurniawan YS, Deter RL, Visser GH, et al. Prediction of the neonatal crown-heel length from femur diaphysis length measurements. J Clin Ultrasound 1994;22:245–52
- Kurniawan YS, Deter RL, Visser GH. Predicting head circumference at birth: a study in a Dutch population using the Rossavik growth model. Ultrasound Obstet Gynecol 1995;5:123–8
- Kurniawan YS, Deter RL, Visser GH, Torringa JL. Prediction of birth weight using the Rossavik growth model: a study in a Dutch population. J Clin Ultrasound 1997;25:235–42
- Lee W, Deter RL, McNie B, et al. Individualized growth assessment of fetal soft tissue using fractional thigh volume. Ultrasound Obstet Gynecol 2004;24:766–74
- Hata T, Deter RL, Hill RM. Individual growth curve standards in triplets: prediction of third-trimester growth and birth characteristics. Obstet Gynecol 1991;78:379–84
- Rossavik IK, Deter RL, Wasserstrum N. Mathematical modeling of fetal growth: V. Fetal weight changes at term. J Clin Ultrasound 1988;16:9–15
- Fowden AL, Forhead AJ. Endocrine regulation of feto-placental growth. Horm Res 2009;72:257–65
- Simon NV, Deter RL, Grow DR, Kofinas AD. Detection of macrosomia by the individual fetal growth curve assessment method. Obstet Gynecol 1991;77:793–7
- Noble KG, Fifer WP, Rauh VA, et al. Academic achievement varies with gestational age among children born at term. Pediatrics 2012;130:e257–64
- Dong Y, Chen SJ, Yu JL. A systematic review and meta-analysis of long-term development of early term infants. Neonatology 2012;102:212–21
- Spinnato JA, Allen RD, Mendenhall HW. Birth weight prediction from remote ultrasound examination. Obstet Gynecol 1988;71:893–8
- Spinnato JA, Allen RD, Mendenhall HW. Birth weight prediction from remote ultrasonographic examination. Am J Obstet Gynecol 1989;161:742–7
- Santonja-Lucas JJ, Armero C, Martinez-Gonzalez L. Long-term prediction of birth weight. J Ultrasound Med 1993;12:431–6
- Hedriana HL, Moore TR. A comparison of single versus multiple growth ultrasonographic examinations in predicting birth weight. Am J Obstet Gynecol 1994;170:1600–4; discussion 1604–6
- Mongelli M, Gardosi J. Gestation-adjusted projection of estimated fetal weight. Acta Obstet Gynecol Scand 1996;75:28–31
- Pressman EK, Bienstock JL, Blakemore KJ, et al. Prediction of birth weight by ultrasound in the third trimester. Obstet Gynecol 2000;95:502–6
Appendix
Correction factors for calculating GPRI values
The use of correction factors in studies of fetal growth is based on a concept that predicted values for any given parameter may have a systematic error relative to the actual neonatal measurement. This example uses AC to explain how one calculates correction factors for this purpose.
Select a group of neonates with normal growth outcomes.
The definition of “normal growth outcomes” varies depending on the anatomical parameter Since AC can be considered a soft tissue parameter, fetuses with normal GPRI values for estimated weight and ThC (two other two soft tissue parameters) would be appropriate for the evaluation of AC. GPRI is defined as the actual birth parameter measurement divided by the predicted birth parameter measurement × 100.
Use 2nd trimester Rossavik size models for AC and an assumption about GCA to predict AC at birth.
Past studies of AC growth using Individualized Growth Assessment indicate that growth appears to stop for AC at 38 weeks, MA. Therefore, 38 weeks, MA, is the selected birth age (SBA) and predicted AC (PAC) values are obtained at that age.
Calculate differences (Diff) between actual measurements at birth (BAC) and PAC's as decimal fractions of the birth measurement.
The mean and standard deviation of the set of Diff values are calculated for these infants with normal growth outcomes. The distribution of Diff values are compared to a Normal Distribution and the variability of the Diff's evaluated by the coefficient of variation.
Use the t-test to compare the mean Diff value against zero.
If the t value is significantly different from zero, a correction factor (CF) can be determined by subtracting the mean Diff from 1.00
Finally, multiply PAC values by the CF in calculating a GPRI value for AC.