Abstract
Objective: This article provides a detailed description and evaluation of the next Nucleus® cochlear implant fitting suite. A new fitting methodology is presented that, at its simplest level, requires a single volume adjustment, and at its advanced level, provides access to 22-channel fitting. It is implemented on multiple platforms, including a mobile platform (Remote Assistant Fitting) and an accessible PC application (Nucleus Fitting Software). Additional tools for home care and surgical care are also described. Design: Two trials were conducted, comparing the fitting methodology with the existing Custom Sound™ methodology, as fitted by the recipient and by an experienced cochlear implant audiologist. Study sample:Thirty-seven subjects participated in the trials. Results: No statistically significant differences were observed between the group mean scores, whether fitted by the recipient or by an experienced audiologist. The lower bounds of the 95% confidence intervals of the differences represented clinically insignificant differences. No statistically significant differences were found in the subjective program preferences of the subjects. Conclusions: Equivalent speech perception outcomes were demonstrated when compared to current best practice. As such, the new technology has the potential to expand the capacity of audiological care without compromising efficacy.
| Abbreviations | ||
| ANOVA | = | Analysis of variance statistical test |
| BKB | = | Bench-Kowal-Bamford sentences |
| C-level | = | Comfort level (behavioural) |
| CNC | = | Consonant nucleus (vowel) consonant words |
| CUNY | = | City University of New York sentences |
| ECAP | = | Electrically evoked compound action potential |
| NFS | = | Nucleus® Fitting Software |
| NRT™ | = | Neural Response Telemetry |
| RAF | = | Remote Assistant Fitting |
| SRT | = | Speech reception threshold |
| T-level | = | Threshold level (behavioural) |
Despite the success of the multichannel cochlear implant in the treatment of sensorineural hearing loss, less than 10% of potential candidates have received an implant (see, for example, NIDCD, Citation2004). Whilst the growth in demand will add many more implant recipients to the care of audiologists, the profession itself is expected to grow far slower (Freeman, Citation2009), and significant changes in cochlear implant fitting and management have been anticipated (Shapiro & Bradham, Citation2012). The purpose of the technology described in this article is to address this capacity challenge for cochlear implant management; that is, to increase access to standard care whilst maintaining hearing outcomes.
A critical aspect of cochlear implant management—and often the most time-intensive aspect—is the fitting (or programming) of the device. Principally, the minimum and maximum electric current limits must be set for each output channel (respectively, the T- and C-levels of the 22 channels of Nucleus® devices, collectively the key components of a ‘program’ or ‘MAP’). Electric output requirements can differ markedly across individuals, making fitting all the more important. Should the current limits be set too high, sound can be uncomfortable, distorted, and can ultimately lead to the recipient's refusal to use the implant. Should the current limits be set too low, the recipient may fail to achieve any sound perception from the device. Unlike standard audiograms of acoustic hearing, T- and C-levels are far less uniform across cochlear implant recipients. T- and C-levels can depend on factors such as electrode array placement, neural survival differences, and subjective loudness preferences (Tykocinski et al, Citation2001; Khan et al, Citation2005; McKay et al, Citation2005). Indeed, the variability in levels across individuals is most often larger than the dynamic range within individuals. Accordingly, since no default program exists that is immediately usable, audibility is the paramount concern of cochlear implant management.
Many fitting methods have been developed since the introduction of the cochlear implant, each method seeking efficacy and efficiency in the optimization of sound quality (e.g. Zwolan & Griffin, Citation2005; Firszt & Reeder, Citation2005; Wolfe & Schafer, Citation2010; Shapiro & Bradham, Citation2012). No single method has dominated clinical practice, and clinician preferences are spread amongst various behavioural methods, objective methods (based on electrophysiological measures), and combinations thereof. The assimilation of behavioural and objective methods is evident in a description of fitting by Firszt & Reeder (Citation2005): ʽThe decision about the final setting for comfort levels is made based on the child's responses, the clinicians’ experience with typical levels, and any objective measures results that may be available from the day of surgery. … The initial goal is for sound to be audible but not too loud, rather than expecting the child to have an ideal sound quality right away.” (Firszt & Reeder, Citation2005, pp. 180–181).
In acknowledgment of these clinical practices, the fitting applications presented in this article do not mandate a single fitting approach. The suite of tools presents multiple approaches that can be combined as needed. Since each of these approaches differs in complexity, the suite allows expert clinicians, hearing aid audiologists, recipients, and caregivers to all take part in the fitting process.
At its simplest level, the fitting methodology described here uses simple volume, bass, and treble adjustments, operations familiar to users of audio players. At its advanced level, the technology integrates with Custom Sound™, the current 22-channel fitting platform for Nucleus devices. Three developments have led to this fitting design: (1) the evolution of ‘streamlined’ fitting methods; (2) the development of automatic ECAP threshold measurements; and (3) the development of handheld digital assistants with substantial processing and communications capability.
Existing streamlined fitting methods have allowed fewer behavioural measures to be required per program, freeing clinicians and recipients from the time-intensive process of measuring 22 T- and C-levels. Unmeasured levels either take interpolated values (Plant et al, Citation2005) or follow the contour of an ECAP threshold profile (Brown et al, Citation2000; Ramos Macias et al, Citation2004; Smoorenburg et al, Citation2002). Complementing streamlined methods in Custom Sound is AutoNRT™, which measures ECAP thresholds with no subjective input (Botros et al, Citation2007, van Dijk et al, Citation2007). And most recently, the Nucleus CR110 Remote Assistant has allowed bidirectional communications between a sound processor and a handheld device, providing the opportunity to take fitting to a mobile platform. Mobile health is a rapidly emerging trend in patient care, with the potential to bring concurrent health benefits and economic benefits (for a review, see Boulos et al, Citation2011).
This article describes a fitting methodology that is implemented on multiple platforms. By implementing AutoNRT on the Nucleus Remote Assistant, both the fitting and surgical monitoring procedures associated with cochlear implant management can be performed on a mobile platform. This technology, Remote Assistant Fitting, allows Nucleus 5 recipients to make adjustments to their fittings, and allows clinicians to practise in diverse environments. The same fitting methodology is also implemented for Nucleus Freedom™ and Nucleus 5 systems in a PC application entitled Nucleus Fitting Software. This application gives greater functionality to clinicians than Remote Assistant Fitting, but presents a more accessible interface than Custom Sound. Additional tools for home use and surgical use are also described that support the fitting suite. The suite of applications integrates clinicians, recipients, caregivers, and surgeons into the fitting procedure.
Design and methods of the fitting suite
A tiered fitting methodology
Different clinics and hospitals around the world have different levels of audiological capability and capacity. Some have very experienced audiologists who have little familiarity with cochlear implants. Others may have extensive experience with cochlear implants but have a desire to allocate time more efficiently to recipients in most need of care. A tiered fitting methodology allows clinicians to prioritize tasks depending on their resources and the needs of each recipient, beginning with the steps that are most important in achieving an audible program.
Whilst the cochlear implant fitting procedure is often described as a number of discrete tasks, the current Nucleus software (Custom Sound) presents the possibilities as a single entity, with all 22 channels visible beside a long list of available operations. The clinician is free to perform tasks in any order. As articulated by Firszt & Reeder (Citation2005)—and applied by many—audibility is of primary concern in fitting, particularly during the initial few weeks after device activation (‘switch-on’). Fine-tuning tasks, such as loudness balancing across frequencies, are often postponed until the recipient becomes more familiar with electric hearing. ‘Accurate’ measurements at device activation can be very different compared to measurements taken a week later (Hughes et al, Citation2001; Henkin et al, Citation2003). The tiered fitting methodology draws focus to the relative importance of each individual task.
The discrete tasks of the fitting methodology introduced here are, in order: (1) AutoNRT and program initialization; (2) Master Volume; (3) Bass & Treble; (4) Thresholds; and (5) Comfort. The first two tasks provide the all-important requirement of audibility, thus comprising a first tier. The remaining tasks are fine-tuning tasks for optimizing sound quality. With this approach, a program can be created by a single volume adjustment and, over time, progressively evolve through finer, frequency-specific adjustments.
1. AutoNRT and program initialization (, )
Figure 1. The fitting methodology and its control on program T- and C-levels (triangle and square markers, respectively). A. AutoNRT ECAP thresholds (circle markers) are measured (here at 22 electrodes intraoperatively). B. A program is instantly initialized, with an average dynamic range of 40CL, Master Volume set to 120 (inaudible or very soft), and Bass & Treble set to 0. C. Master Volume is gradually raised in the presence of live audio until comfortable. D. Bass & Treble are adjusted if desired. E. Three thresholds are measured if desired, bending the T-level profile. F. A Comfort check is performed if desired, adjusting selected bands of levels. Blocks A–D comprise the Remote Assistant Fitting methodology, and blocks A–F the Nucleus Fitting Software methodology. The deviation in levels at low frequencies is atypically large, chosen here to demonstrate the effect of profile scaling: the C-level profile is flatter than the T-level profile, and both profiles flatten when Master Volume is raised.
Five automatic ECAP thresholds are measured postoperatively, or 22 intraoperatively. T- and C-level profiles—i.e. the shapes of the equal loudness contours of minimum audibility and maximum acceptable loudness—are then approximated by the ECAP threshold contour (cf. Botros & Psarros, Citation2010), measured automatically via AutoNRT. This requires no subjective interaction, initializing a program with the shape (or ‘hearing profile’) of the T- and C-levels automatically set. The absolute level of the C-level profile is set such that the average C-level is 120CLFootnote1, and the average T-level is set at 80CL. At these levels, the program is inaudible for the vast majority of recipients. The average dynamic range per-channel is thus set to 40CL, which is the average dynamic range found in the populationFootnote2. This program is ready for volume adjustment on first use.
The T- and C-level profiles do not follow the ECAP threshold profile exactly. Rather, they are calculated according to the profile scaling method (Botros & Psarros, Citation2010). In this method, C-level profiles are set to be flatter than T-level profiles, since equal loudness contours have been found to be flatter at higher levels of current.
If ECAP thresholds cannot be obtained—whether due to the absence of ECAPs in approximately 5% of recipients (Cafarelli Dees et al, Citation2005; van Dijk et al, Citation2007), or if the user wishes to avoid performing AutoNRT—the ECAP threshold profile shape is replaced with the profile shape of a population mean programFootnote2. The population mean profile agrees with similar profiles observed by other investigators, including Pedley et al (Citation2007), Spivak et al (2010), and Wesarg et al (Citation2010).
2. Master Volume (, )
Master Volume is a new user control that can shift both the T- and C-level profiles simultaneously. If a number of thresholds (T-levels) have been explicitly measured by the clinician elsewhere, Master Volume only shifts the C-level profile, thus respecting the behavioural thresholds. The value of the Master Volume is set to the average C-level.
Adjustments are made in steps of 2CL. Furthermore, the Master Volume can only be adjusted when the audio input of the sound processor is active (i.e. the processor's microphone is ‘live’), and increases can only be made when the processor coil is correctly positioned. Each adjustment is accompanied by a three-channel wide stimulus at C-level, centred on channel 11. Hence, since the program is initialized at low levels, and each small increment must be presented to the recipient, safety is upheld by ensuring the recipient listens to each adjustment before the level can be raised further. When performing pediatric fitting, the stimulus on each adjustment allows the clinician to synchronize the increments with their observations of the child's behaviour.
The user interface provides guidance on the expected Master Volume level, and this is particularly relevant for pediatric fitting. On a given channel, the ECAP threshold typically lies above T-level and near C-level (Brown et al, Citation2000; Hughes et al, Citation2000, Citation2001; Gordon et al, Citation2002; Cafarelli Dees et al, Citation2005). Thus, in addition to providing an estimate of the equal loudness contour, ECAP thresholds indicate electric levels that are audible. The fitting methodology specifies an expected Master Volume level of 16CL on either side of the mean of the individual's ECAP thresholds, and where a population mean program is used, 22CL on either side of 180CLFootnote2. These ranges are made visible to the user.
3. Bass & Treble (, )
The Bass & Treble controls apply a tilt with an emphasis at either the low frequency or high frequency levels, respectively. Once Master Volume has been set, Bass & Treble represents the first fine-tuning task in the tiered methodology. Bass & Treble adjustments begin to optimize sound quality, addressing descriptions such as ‘sound is too boomy’.
As with Master Volume, Bass & Treble tilts both the T- and C-level profiles simultaneously, or tilts the C-level profile only if any thresholds (T-levels) have been explicitly measured. The Bass & Treble controls are similar to those suggested by Smoorenburg (Citation2007). Bass & Treble controls are initially set to zero, and can only be tilted in steps of 2CL at the extremities of the electrode array. Bass & Treble can take on positive and negative values, and are limited to ± 30CL at the extremities. Each adjustment is accompanied by a three-channel wide stimulus at C-level, centred on channel 20 for Bass and channel 3 for Treble. Sequential increases cannot occur until this stimulus is delivered.
The precise calculations of the AutoNRT, Master Volume, and Bass & Treble processes are described in greater detail by Botros (Citation2010).
4. Thresholds (, )
Whilst a default dynamic range of 40CL is considered appropriate here for most recipients, threshold measurements can improve sound quality for those recipients who find the perception of soft sounds problematic. Threshold measurements are not mandatory, because the Master Volume and Bass & Treble controls can adjust T- and C-levels simultaneously, preserving the average per-channel dynamic range of 40CL. When thresholds are measured on specific electrodes (using a single electrode stimulus), the T-level profile is smoothly shapedFootnote3 to pass through the measurements.
5. Comfort (, ).
The Comfort task allows a quick sweep of C-levels, identifying regions of the profile contour that are too soft or too loud. The channels of the system are divided into eight frequency bands. Initiating the Comfort task results in three-channel wide stimuli at C-level across the bands. The sweep can be stopped at any stage to adjust the levels of a band within a range of ± 30CL. As for Master Volume and Bass & Treble, Comfort adjustments can affect both the T- and C-level profiles simultaneously, or adjust the C-level profile only if any thresholds (T-levels) have been explicitly measured. The Comfort task is intended to be a simple check for rare anomalies that cause significant sound distortion or discomfort.
Master Volume, Bass, Treble, and Comfort adjustments observe profile scaling calculations. As such, when profiles are raised they are progressively flattened and frequency-selective adjustments (such as a Bass adjustment, or a particular Comfort band adjustment) affect T-levels greater than C-levels (by a factor of 1.25).
A multiplatform design
Given these five main tasks of the fitting methodology, the suite of tools spreads the fitting process across three platforms, with each platform presenting more fitting tasks to the clinician than the previous. In order, the platforms are:
1. Remote Assistant Fitting (RAF; )
Figure 2. Remote Assistant Fitting on the Nucleus CR110 Remote Assistant. Left: AutoNRT in progress on the second of five electrodes. Middle: Master Volume adjustment. Right: Treble adjustment.
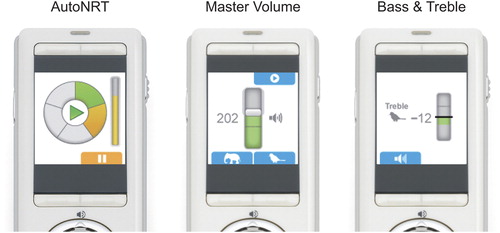
Fitting is performed on the Nucleus CR110 Remote Assistant, and includes the AutoNRT, Master Volume, and Bass & Treble tasks (, ). These tasks can be performed by a clinician, adult recipient, or caregiver, because they are either automated or analogous to audio player use. As a mobile fitting platform, RAF allows fitting to take place wirelessly in the recipient's everyday listening environment (as discussed later, this can be particularly relevant for pediatric fitting).
2. Nucleus Fitting Software (NFS; )
Figure 3. The Thresholds screen (left) and Comfort screen (right) of Nucleus Fitting Software. The two-screen design allows cochlear implant-specific detail to be avoided (for example, the Thresholds screen has an audiometer-like interface).
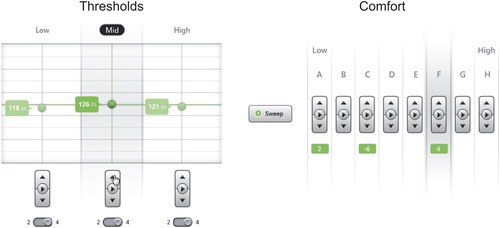
This PC application supports the exact same methodology as RAF, but presents it with recipient management functionality (e.g. personal information and past programs) and a more detailed user interface. NFS also includes the additional Thresholds (on three channels, , ) and Comfort tasks (on eight bands, , ). NFS is designed to be visually and descriptively familiar to both hearing-aid audiologists and cochlear implant practitioners.
3. Custom Sound
Full customization remains available via Custom Sound, allowing the small percentage of difficult-to-fit recipients access to fine-grained audiological care.
Any RAF or NFS program can be viewed and modified in Custom Sound. Programs created using RAF or NFS use the existing default sound processing parameters of Custom Sound (such as a 900 Hz per-channel stimulation rate). In turn however, almost all Custom Sound programs can be adjusted with RAF and NFSFootnote4 using the sound processing parameters that were set in Custom Sound, even if not default. Most importantly, Master Volume and Bass & Treble adjustments can be made on these programs, both in RAF (enabled at the discretion of the clinician) and in NFS.
The intention of the multiplatform tiering is to enable accessible fitting. Fitting sessions, including switch-on, can happen on both mobile and desktop platforms, whether inside or outside a clinic. After switch-on, recipients and caregivers can make simple adjustments without repeated visits to a clinic. As listening experience grows, further fine-tuning can be made in NFS or in Custom Sound as needed.
Tools for home and surgical care
Completing the fitting suite are two tools: one for home use and one for surgical use. Firstly, myCochlear is a desktop application that allows recipients and caregivers to run regular Ling sound tests at home, and by connecting the Nucleus CR110 Remote Assistant to a PC, caregivers can also monitor the hours of usage of an implant system. This data can then be shared with a clinic online. Hence, clinicians can monitor usage and system alerts remotely, distributing routine checks away from the clinic. Secondly, the Nucleus CR120 Intraoperative Remote Assistant performs handheld, cable-free intraoperative AutoNRT on all 22 electrodes, and also offers a continuous electrode impedance mode. When AutoNRT is performed during surgery using the recipient's own sound processor, the ECAP threshold profile is ready for use at switch-on. Fitting, in this scenario, is reduced to a single Master Volume adjustment after surgery.
At the time of writing, regulatory approval was being sought for the suite of products from a number of regulatory bodies worldwide.
Fitting methodology trial results in summary
Two trials of the Remote Assistant Fitting and Nucleus Fitting Software methodologies have been completed: a clinician fit trial and a recipient fit trial. Preliminary reports of these trials have been presented by Maruthurkkara et al (Citation2010, Citation2011). The results from the trials to date are collated and summarized below.
The subjects in both trials were all adult, postlingually deaf Nucleus CI24RE implantees, and all were experienced users of their implants (a range of between one and five years). Both trials were performed under the approval of ethics committees, and each subject signed a prior informed consent form.
Clinician fit trial
Materials and Methods
The clinician fit trial compared the speech performance outcomes of three methodologies: those of RAF, NFS, and Custom Sound. Thirteen subjects participated in the clinical evaluation.
Each subject received three new programs to evaluate: (1) a program created using the RAF methodology (AutoNRT on five electrodes, Master Volume, and Bass & Treble); (2) a program created using the NFS methodology (additional Thresholds and Comfort measurements); and (3) a program created using the full 22 T- and C-levels available in Custom Sound. For all three programs, sound processing parameters such as stimulation rate were manually set to match each subject's everyday program, but for the Custom Sound program, the T- and C-levels were set without observing the levels of each subject's everyday program (hence unbiased). All three programs were fitted by an experienced cochlear implant audiologist. The order of the three fittings, and the allocation of the three programs to sound processor positions, were balanced across subjects and randomly allocated to subjects (for example, of the six permutations of fitting ordering, five permutations were randomly allocated two subjects and one permutation was randomly allocated three subjects). Both the subjects and the investigators were blind to the program positions on each sound processor.
Subjects evaluated the three programs for a two week trial period, alternating between programs daily. Speech perception testing was subsequently performed, including: (1) CNC words at 60 dB SPL in quiet (100 words per program); (2) CNC words at 50 dB SPL in quiet (100 words); and (3) BKB sentences at 65 dB SPL in speech babble noise (32 sentences). The CNC lists were based on the original tests developed by Peterson & Lehiste (Citation1962). For the sentence tests, the signal-to-noise (SNR) ratio was adapted until an SNR corresponding to a score of 50% words correct was determined (Dawson et al, Citation2011). This SNR is the speech reception threshold (SRT) for each subject. Programs were tested in random order, balanced across subjects.
At the end of the two week trial period, subjects were also asked to provide a preference for any of the three programs, if such a preference was held. The subjects indicated their preference by program position on the sound processor, blind to the fitting method of each program.
Finally, the RAF C-level profiles and the NFS T- and C-level profiles were compared to the Custom Sound T- and C-level profiles (which are measured channel by channel). The chosen measure of a profile's goodness of fit was the root mean square (RMS) difference, calculated across the channels of each profile as a percentage (%DR) of the Custom Sound dynamic range at each channel (following Plant et al, Citation2005; Botros & Psarros, Citation2010). The means of each profile are first offset to be zero for the comparisons. Since the RAF T-level profiles are a fixed offset from the C-level profiles, the RAF T-levels are not directly compared.
Results
The group mean results are shown in . One-way repeated-measures ANOVA tests showed no significant differences between the three programs in any of the test conditions (60 dB CNC words: p = 0.18; 50 dB CNC words: p = 0.89; BKB sentences: p = 0.34). For each of the test conditions, the confidence intervals of the mean speech perception differences between programs are shown in .
Figure 4. Group mean speech perception test results for Remote Assistant Fitting, Nucleus Fitting Software, and Custom Sound fitting methods, all three fitted by an experienced cochlear implant audiologist. No significant differences were found in any of the test conditions. For the sentence tests (right), a lower speech reception threshold indicates better speech perception in noise. Error bars represent the standard errors of the means.
Table 1. Group mean differences in speech perception test results between the Remote Assistant Fitting (RAF) and Custom Sound (CS) fitting methods, and between the Nucleus Fitting Software (NFS) and Custom Sound (CS) fitting methods, all fitted by an experienced cochlear implant audiologist. The means of the differences and the 95% confidence intervals (CI) of the means of the differences are given. For the sentence tests, a lower speech reception threshold indicates better speech perception in noise.
Within-subject speech perception word scores were analysed using χ2 tests (and their associated post hoc analyses of residuals). The calculations of this approach agree with the binomial models of Thornton & Raffin (Citation1978) and Carney & Schlauch (Citation2007). To compare SRTs, an estimate of the SRT standard deviation was made from the data, following the method of Plomp & Mimpen (Citation1979). Across the subjects and test conditions (39 combinations in total), the RAF programs were significantly better (p < 0.05) in two of the 39 individual tests and significantly poorer in one (a range of + 15% to − 22%, as compared to the mean score of the other two programs); the NFS programs were significantly poorer in one individual test (− 15%) and the Custom Sound programs were significantly better in one individual test and significantly poorer in two (+ 16%, − 19% and + 5.3 dB respectively).
Consistent with the speech perception testing, no statistically significant difference was found in the subjective program preferences of the subjects in a χ2 test. Across the 13 subjects, the median RMS difference of the RAF C-level profiles was 13%DR. The median RMS differences of both the NFS T-level profiles and the NFS C-level profiles were 12%DR. In the study of Plant et al (Citation2005), the median RMS difference of a streamlined fitting method using interpolation between three T-levels and three C-levels was found to be between 10–20%DR. The RAF and NFS results are consistent with this range.
Recipient fit trial
Materials and Methods
The recipient fit trial compared the speech perception outcomes of two methodologies: (1) a program created using the RAF methodology, fitted by the subject; and (2) a program created using the full 22 T- and C-levels available in Custom Sound, fitted by an experienced cochlear implant audiologist. For both programs, sound processing parameters such as stimulation rate were manually set to match each subject's everyday program, but for the Custom Sound program, the T- and C-levels were set without observing the levels of each subject's everyday program (hence unbiased). Before creating programs using the RAF methodology, subjects principally watched a five minute demonstration video of the method and received no clinician intervention during the fitting. As for the clinician fitted trial, the recipient fit trial was double blind and program orderings were balanced and randomized.
Twenty-four subjects participated in the recipient fit trial. Depending on the time availability of each subject, 12 subjects participated in a shorter protocol consisting of fitting and acute speech perception testing in the one session (Group A), and 12 subjects participated in a longer protocol that involved two weeks of take home experience and subsequent speech perception testing (Group B). Group A completed CNC word tests at 60 dB SPL in quiet (100 words per program). Group B completed the same CNC word tests as for the clinician fit trial (60 dB and 50 dB SPL in quiet) and also completed CUNY sentence tests at 65 dB SPL in speech babble noise (60 sentences). For each subject, the noise level was manually set to avoid scores that were too high or too low. Once selected, each subject's noise level was held constant across the two programs, allowing comparisons of the speech perception scores.
The RMS differences between the RAF C-level profiles and the Custom Sound C-level profiles were calculated for all 24 subjects. The 12 subjects of Group B also indicated a preference for either of the two programs, if such a preference was held.
Results
The group mean results are shown in . Paired t-tests showed no significant differences between the two programs in any of the test conditions (Group A 60 dB CNC words: p = 0.14; Group B 60 dB CNC words: p = 0.52; Group B 50 dB CNC words: p = 0.75; Group B CUNY sentences: p = 0.62). For each of the test conditions, the confidence intervals of the mean speech perception differences between programs are shown in . Across the subjects and test conditions (48 combinations in total), the RAF programs were significantly better (p < 0.05 in χ2 tests) in five of the 48 individual tests (a range of 14–22%) and the Custom Sound programs were significantly better in three individual tests (a range of 17–23%).
Figure 5. Group mean speech perception test results for the Remote Assistant Fitting method, as fitted by a recipient, and the Custom Sound method, as fitted by an experienced cochlear implant audiologist. Group A testing occurred in the same session as the fitting procedure. No significant differences were found in any of the test conditions. Error bars represent the standard errors of the means. Note that sentence tests were also scored by the percentage of words correct.
Table 2. Group mean differences (percentage of words correct) in speech perception test results between the Remote Assistant Fitting (RAF) method, as fitted by a recipient, and the Custom Sound (CS) fitting method, as fitted by an experienced cochlear implant audiologist. The means of the differences and the 95% confidence intervals (CI) of the means of the differences are given.
Of the 12 Group B subjects, no statistically significant difference was found in the subjective program preferences of the subjects in a χ2 test. Across the 24 subjects, the median RMS difference of the RAF C-level profiles was 19% DR.
Discussion
The results of both the clinician fit trial and the recipient fit trial demonstrated equivalent speech perception scores using the new fitting methodology. This was observed in the 95% confidence intervals of the speech perception differences between methodologies ( and ). The lower bounds of the mean word score differences for the CNC word and CUNY sentence test conditions ranged between − 1.0% to − 6.4%. Leung et al (Citation2005), for example, considered a − 4.6% word score difference to be clinically insignificant (without indicating a difference that would be deemed significant). Despite the lack of standards on word score differences that are important clinically, our group mean results give high confidence that the new fitting methodology does not provide diminished speech performance outcomes. In a few individual speech perception tests, Custom Sound programs delivered significantly better results in some instances and significantly poorer results in other instances. This would be expected of any given clinical trial for which the outcomes of each of the methodologies were more or less equivalent.
Furthermore, no statistically significant differences were observed in the subjective program preferences of the subjects. The RMS differences in program levels of the RAF and NFS programs, as compared to the Custom Sound programs, were consistent with Plant et al's (2005) three-channel interpolated programs (median RMS differences between 10–20% DR). This is to be expected given the RAF and NFS fitting methodologies: they effectively use three behavioural measures (Master Volume, Bass & Treble) and, in the case of NFS, three T-levels. Plant et al (Citation2005) found no significant differences between three-channel interpolated programs and 22-channel Custom Sound programs in group speech perception scores, thus recommending the three-channel interpolated programs for clinical use.
It should not be surprising that group equivalence can be achieved with an ECAP-based methodology (though the full methodology here mixes ECAP and behavioural measures). Evaluations of speech perception have been performed previously using ECAP-based programs, across numerous languages (Seyle et al, Citation2002; Smoorenburg et al, Citation2002; Sun et al, Citation2004; Willeboer & Smoorenburg, Citation2006; Pedley et al, Citation2007). Across the studies, either group equivalence or small differences have been observed in each test scenario. Each study concluded that ECAP-based programs could be successfully used, particularly in pediatric fitting. The ECAP-based fitting method used in RAF and NFS differs from previous methods in three ways: (1) it combines key elements of the three Custom Sound ECAP-based methods into a single method; (2) it uses the profile scaling technique (Botros & Psarros, Citation2010); and (3) it automatically combines behavioural measures with ECAP measures, allowing programs to evolve as extra measures are made.
RAF and NFS combine elements of the ‘objective offset’ method, ‘progressive MAPs’ method, and ‘shift and tilt’ methods of Custom Sound (Brown et al, Citation2000; Ramos Macias et al, Citation2004; Smoorenburg et al, Citation2002, respectively). By using an ECAP threshold profile and setting the Master Volume based on a C-level stimulus at each adjustment (in addition to live sound), the objective offset method is largely replicated. By using a fixed dynamic range when thresholds have not been measured, and by allowing a Master Volume control that can adjust profiles by at least 30CL, an alternative is provided to the four-program progressive MAPs method. And finally, by adjusting Master Volume and Bass & Treble controls whilst live, the shift and tilt method is replicated.
The fitting suite implements the ECAP-based profile scaling improvements of Botros & Psarros (Citation2010). In their 42 subject study, the technique was compared to the existing objective offset method of Custom Sound. Significant improvements in program levels (as compared to behavioural levels) and subjective preferences were found. Adding to the results of Botros & Psarros (Citation2010), the results of the present article, with profile scaling included, demonstrated equivalent speech performance outcomes using the ECAP-based fitting methodology.
The additional two tasks included in NFS, Thresholds and Comfort, allow behavioural measures to be quickly overlaid upon the ECAP-based program. Essentially, the technology evolves the program, whether ECAP-based or otherwise, towards the new behavioural measures as they are taken. An audiologist even has the option to bypass the ECAP-based method and go directly to the Thresholds and Comfort tasks in NFS, fitting the recipient in a conventional streamlined fitting paradigm (Plant et al, Citation2005). Giving the flexibility to fit in a number of ways without compromising efficacy is the foremost design principle of the suite.
Another key motivation of the suite is to enable mobile cochlear implant management. By giving recipients and caregivers (at the discretion of the clinician) a greater level of program control via the mobile platform (specifically, the Master Volume and Bass & Treble controls), fewer minor adjustments are anticipated of the clinician in general. Additional studies are needed to quantify the efficiency gains of the mobile platform. Furthermore, both the (mobile) clinician and the recipient can test programs immediately in the recipient's normal listening environment, potentially avoiding a number of unnecessary follow-up clinic visits. The next generation of fitting distils the most salient aspects of the fitting procedure, such that it can be presented on a handheld device. This multiplatform trend is ever-present in digital technology today. Applications are routinely made available for desktop, tablet, and smartphone platforms, each with a progressively less complex interface, yet each operating on the same data. The suite of applications presented in this article follow the same architecture.
As an illustration of the purpose of a mobile platform, it is worth considering the specific example of a pediatric switch-on. Many clinics make two clinicians available for switch-on: one in close proximity to the child, engaging the child in an activity, and another to operate the PC fitting application. The key objective of the switch-on is to achieve audibility: essentially the Master Volume task. Using RAF, the clinician simply presses the up button on Master Volume repeatedly. Each press gives a stimulus at C-level, allowing the one clinician to observe behavioural changes without looking at a screen, worrying about cables or being confined to any one room.
In addition to its multiplatform design, the suite broadens access to the fitting procedure by using terminology that is neither cochlear implant nor hearing-aid specific. In the particular case of RAF, the terminology is analogous to that of an audio player (Master Volume, Bass & Treble). Thus, it is anticipated that RAF is readily usable by both recipients who are new to cochlear implantation and experienced recipients. Whilst the experienced subjects of the recipient fit trial had to accustom themselves to RAF's generic terminology, all subjects were able to do so with minimal training (a five minute video). Recipients who do not prefer self-fitting—whether experienced or not—have multiple avenues within the suite to access audiological care (including clinician use of RAF).
Ultimately, the technology described in this article opens cochlear implant management to a wider community of contributors. With surgeons, caregivers and recipients able to regularly contribute data to the clinician, clinicians can have the visibility and the capacity to focus on recipients who need the most care, and to improve access to a high standard of audiological care more generally.
Conclusions
The fitting methodology trials of the suite demonstrated equivalent speech perception outcomes when compared to current best practice. As such, the new technology has the potential to expand the capacity of audiological care without compromising efficacy, and may facilitate greater recipient self-care using a mobile fitting platform. By combining several behavioural and objective methods, the design of the fitting suite offers the flexibility to fit quickly or to fit in detail, beginning with the steps that are most important in achieving an audible program. Accordingly, the next generation of Nucleus fitting applications open cochlear implant management to a wider number of clinicians, recipients, caregivers and surgeons.
Acknowledgements
The authors thank Jane Cockburn and Barry Alderton for their insights and suggestions on the manuscript. The authors thank the clinicians who assisted with the fitting sessions and data collection, especially: Komal Arora, Jillian Crosson, Justin Pirano, Esti Nel, Catherine Morgan, and Marian Jones. They also thank their subjects who were, as always, exceptionally generous with their time.
Declaration of interest: The authors are contractors or employees of Cochlear Limited, the manufacturer of the technology described in the article.
Notes
Notes
1. Levels are specified on a current level (CL) scale. For the Nucleus CI24RE and Nucleus 5 implant, I (μA) = 17.5 × 100CL/255. Each current level step (1CL) is a 0.16 dB change in current.
2. Based on data from 659 recipients at two large cochlear implant Australian clinics.
3. Cubic interpolation is used, rather than linear interpolation. The validity of interpolation depends upon the similarity in T- and C-levels at neighbouring electrodes, which is reasonable with broad current spread. Hence, only monopolar stimulation modes are supported by the methodology.
4. Specifically, programs that use monopolar stimulation modes, default channel-to-electrode mappings, a single pulse width across all channels and at least 12 active electrodes.
References
- Botros A.M. 2010. Designs for future development. The Application of Machine Intelligence to Cochlear Implant Fitting and the Analysis of the Auditory Nerve Response (PhD thesis). Sydney: The University of New South Wales, at http://handle.unsw.edu.au/1959.4/44707, pp. 135–150.
- Botros A. & Psarros C. 2010. Neural response telemetry reconsidered: I. The relevance of ECAP threshold profiles and scaled profiles to cochlear implant fitting. Ear Hear, 31, 367–379.
- Botros A., van Dijk B. & Killian M. 2007. AutoNRT™: An automated system that measures ECAP thresholds with the Nucleus® Freedom™ cochlear implant via machine intelligence. Artif Intell Med, 40, 15–28.
- Boulos M.N.K., Wheeler S., Tavares C. & Jones R. 2011. How smartphones are changing the face of mobile and participatory healthcare: An overview, with example from eCAALYX. Biomed Eng Online, 10, 24.
- Brown C.J., Hughes M.L., Luk B., Abbas P.J., Wolaver A. et al. 2000. The relationship between EAP and EABR thresholds and levels used to program the Nucleus 24 speech processor: Data from adults. Ear Hear, 21, 151–163.
- Cafarelli Dees D., Dillier N., Lai W.K., Von Wallenberg E., van Dijk B. et al. 2005. Normative findings of electrically evoked compound action potential measurements using the neural response telemetry of the Nucleus CI24M cochlear implant system. Audiol Neurootol, 10, 105–116.
- Carney E. & Schlauch R.S. 2007. Critical difference table for word recognition testing derived using computer simulation. J Speech Lang Hear Res, 50, 1203–1209.
- Dawson P.W., Mauger S.J. & Hersbach A.A. 2011. Clinical evaluation of signal-to-noise ratio-based noise reduction in Nucleus® cochlear implant recipients. Ear Hear, 32, 382–390.
- Firszt J.B. & Reeder R.M. 2005. How we do it: Tuning up a young child. Cochlear Implants Int, 6, 178–182.
- Freeman B.A. 2009. The coming crisis in audiology. Audiol Today, 21, 46–52.
- Gordon K.A., Ebinger K.A., Gilden J.E. & Shapiro W.H. 2002. Neural response telemetry in 12- to 24-month-old children. Ann Otol Rhinol Laryngol, 111, 42–48.
- Henkin Y., Kaplan-Neeman R., Muchnik C., Kronenberg J. & Hildesheimer M. 2003. Changes over time in electrical stimulation levels and electrode impedance values in children using the Nucleus 24M cochlear implant. Int J Pediatr Otorhinolaryngol, 67, 873–880.
- Hughes M.L., Brown C.J., Abbas P.J., Wolaver A.A. & Gervais J.P. 2000. Comparison of EAP thresholds to MAP levels in the Nucleus CI24M cochlear implant: Data from children. Ear Hear, 21, 164–174.
- Hughes M.L., Vander Werff K.R., Brown C.J., Abbas P.J., Kelsay D.M.R. et al. 2001. A longitudinal study of electrical impedance, the electrically evoked compound action potential, and behavioral measures in Nucleus 24 cochlear implant users. Ear Hear, 22, 471–486.
- Khan A.M., Whiten D.M., Nadol J.B. & Eddington D.K. 2005. Histopathology of human cochlear implants: Correlation of psychophysical and anatomical measures. Hear Res, 205, 83–93.
- Leung J., Wang N.-Y., Yeagle J.D., Chinnici J., Bowditch S. et al. 2005. Predictive models for cochlear implantation in elderly candidates. Arch Otolaryngol Head Neck Surg, 131, 1049–1054.
- Maruthurkkara S., Arora K., Jones M., Nel E., Morgan C. et al. 2010. AutoNRT and the possibility of fitting cochlear implants like an audio player. In: J.B. Firszt & R.A. Chole (eds.). Abstracts of the 6th International Symposium on Objective Measures in Auditory Implants>.
- Maruthurkkara S., Crosson J. & Piraino J. 2011. Evaluation of efficient cochlear implant fitting paradigms. In: S-H. Lee (ed.). Abstracts of the 8th Asia Pacific Symposium on Cochlear Implant and Related Sciences, p. 215.
- McKay C.M., Fewster L. & Dawson P. 2005. A different approach to using neural response telemetry for automated cochlear implant processor programming. Ear Hear, 26, 38S–44S.
- National Institute on Deafness and Other Communication Disorders (NIDCD), 2004. Healthy Hearing 2010 Progress Review. Washington, DC, USA.
- Pedley K., Psarros C., Gardner-Berry K., Parker A., Purdy S.C. et al. 2007. Evaluation of NRT and behavioral measures for MAPping elderly cochlear implant users. Int J Audiol, 46, 254–262.
- Peterson G.E. & Lehiste I. 1962. Revised CNC lists for auditory tests. J Speech Hear Disord, 27, 62–70.
- Plant K., Law M.-A., Whitford L., Knight M., Tari S. et al. 2005. Evaluation of streamlined programming procedures for the Nucleus cochlear implant with the Contour electrode array. Ear Hear, 26, 651–668.
- Plomp R. & Mimpen A.M. 1979. Improving the reliability of testing the speech reception thresholds for sentences. Audiol, 18, 43–52.
- Ramos Macias A., Maggs J., Hanvey K., John M., Castillo C. et al. 2004. Use of intraoperative neural response telemetry in the initial fitting of very young children: Preliminary findings. Int Congr Series, 1273, 187–190.
- Seyle K. & Brown C.J. 2002. Speech perception using maps based on neural response telemetry measures. Ear Hear, 23(1 Suppl.), 72S–79S.
- Shapiro W.H. & Bradham T.S. 2012. Cochlear implant programming. Otolaryngol Clin North Am, 45, 111–127.
- Smoorenburg G.F. 2007. T- and C-level profiles across the electrode array: Fitting the speech processor by profile parameter adjustment. Cochlear Implant Ear Marks, Utrecht: at http://www.audiologics.com, pp. 35–54.
- Smoorenburg G.F., Willeboer C. & van Dijk J.E. 2002. Speech perception in Nucleus CI24M cochlear implant users with processor settings based on electrically evoked compound action potential thresholds. Audiol Neurootol, 7, 335–347.
- Spivak L., Auerbach C., Vambutas A., Geshkovich S., Wexler L. et al. 2011. Electrical compound action potentials recorded with automated neural response telemetry: Threshold changes as a function of time and electrode position. Ear Hear, 32, 104–113.
- Sun Y.S., Wu C.M. & Liu T.C. 2004. Mandarin speech perception in Nucleus CI24 implantees using MAPs based on neural response telemetry. ORL J Otorhinolaryngol Relat Spec, 66, 255–261.
- Thornton A.R. & Raffin M.J.M. 1978. Speech-discrimination scores modelled as a binomial variable. J Speech Hear Res, 21, 497–506.
- Tykocinski M., Saunders E., Cohen L.T., Treaba C., Briggs R.S. et al. 2001. The Contour electrode array: Safety study and initial patient trials of a new perimodiolar design. Otol Neurotol, 22, 33–41.
- van Dijk B., Botros A.M., Battmer R.-D., Begall K., Dillier N. et al. 2007. Clinical results of AutoNRT™, a completely automatic ECAP recording system for cochlear implants. Ear Hear, 28, 558–570.
- Wesarg T., Battmer R.-D., Garrido L.C., Dillier N., Garcia-Ibáñez L. et al. 2010. Effect of changing pulse rate on profile parameters of perceptual thresholds and loudness comfort levels and relation to ECAP thresholds in recipients of the Nucleus CI24RE device. Int J Audiol, 49, 775–787.
- Willeboer C. & Smoorenburg G.F. 2006. Comparing cochlear implant users’ speech performance with processor fittings based on conventionally determined T and C levels or on compound action potential thresholds and live-voice speech in a prospective balanced crossover study. Ear Hear, 27, 789–798.
- Wolfe J. & Schafer E.C. 2010. Programming Cochlear Implants. San Diego: Plural Publishing.
- Zwolan T.A. & Griffin B.L. 2005. How we do it: Tips for programming the speech processor of an 18-month-old. Cochlear Implants Int, 6, 169–177.