ABSTRACT
ICD-9-CM diagnosis codes are increasingly used to estimate the burden of disease, as well as to evaluate the quality of care and outcomes of various conditions. Acute exacerbations of COPD (AE-COPD) are common and associated with substantial health and financial burden in the U.S. Whether published algorithms that employ different combinations of ICD-9-CM codes to identify patients hospitalized for AE-COPD yield similar or different estimates of disease burden is unclear. In this study, the Nationwide Inpatient Sample from years 2000–2006 was used to identify and compare the number of hospitalizations, healthcare utilization, and outcomes for patients hospitalized for AE-COPD in the U.S. AE-COPD was identified using five different published ICD-9-CM algorithms. Estimates of the annual number of hospitalizations for AE-COPD in the U.S. varied more than 2-fold (e.g., 421,000 to 870,000 in 2006). Outcomes and healthcare utilization of patients hospitalized for AE-COPD varied substantially, depending on the algorithm used (e.g., in-hospital mortality 2.0% to 5.1%, total hospital days 2.0 to 5.1 million in 2006). Observed trends in the number of hospitalizations over the 7-year period varied depending on which algorithm was used. In conclusion, the estimated health burden and trends in hospitalizations for AE-COPD in the United States differ, depending on which ICD-9-CM algorithm is used. To improve our understanding of the burden of AE-COPD and to ensure that quality of care initiatives are not misdirected, a validated approach to identifying patients hospitalized for AE-COPD is needed.
ABBREVIATIONS
AE-COPD: Acute exacerbation of chronic obstructive pulmonary disease; AHRQ: Agency for Healthcare Research and Quality; CI: Confidence interval; CMS: Centers for Medicaid and Medicare Services; COPD: Chronic Obstructive Pulmonary Disease; HEDIS: Health Effectiveness Data and Information Set; ICD-9-CM: International Classification of Diseases, Ninth Revision, Clinical Modification; IHD: Ischemic Heard Disease; NHLBI: National Heart, Lung, and Blood Institute; NIS: Nationwide Inpatient Sample; PVD: Pulmonary Vascular Disease; RF: Respiratory Failure;
INTRODUCTION
Health services research and epidemiologic studies frequently rely on administrative data to identify sufficiently large and representative populations. Administrative data include diagnoses at healthcare encounters in the form of International Classification of Diseases, Ninth Revision, Clinical Modification (ICD-9-CM) codes. Although originally developed for epidemiologic purposes (e.g., to estimate and track changes in disease burden), ICD-9-CM codes have become critical for billing and for health services research (Citation1). ICD-9-CM codes also provide the basis for interventions to improve healthcare delivery, a topic of substantial interest in current efforts to reform U.S. healthcare (Citation2). For example, ICD-9-CM codes have been used to identify patients eligible for quality improvement initiatives, including the Centers for Medicaid and Medicare (CMS) Reporting Hospital Quality Data for Annual Payment Update program (Citation3).
The validity of ICD-9-CM codes for identifying patients with specific medical conditions, however, appears to vary depending on both the condition examined and the ICD-9-CM algorithm used (Citation4–6). Chronic obstructive pulmonary disease (COPD) is a leading cause of morbidity, mortality, and healthcare expenditures and affects an estimated 24 million people in the United States alone (Citation7, 8). It is currently the fourth-leading cause of death in the United States and is predicted to become the third leading cause of death by 2020 (Citation9). Hospitalizations for acute exacerbations of COPD (AE-COPD) are common, associated with substantial morbidity and mortality, and costly; therefore, there is considerable interest in understanding and improving the care and outcomes of these patients (Citation10–12).
Despite the enormous health and financial burden of hospitalizations for AE-COPD, there is no consensus regarding which ICD-9-CM code or group of codes is most appropriate to identify such hospitalizations. Some algorithms are based on a single ICD-9-CM code for COPD exacerbation (Citation12), whereas others (Citation7, 8, Citation10, Citation13–15) employ multiple codes for COPD (regardless of whether such codes are specific to an exacerbation) and/or include codes for respiratory failure combined with codes for COPD (Citation11, Citation16–18); the various algorithms also include different age cut-offs to identify patients with COPD.
The effects of these different approaches on national estimates of healthcare utilization and outcomes attributed to hospitalizations for AE-COPD (e.g., number of hospitalizations, hospital days, use of mechanical ventilation, mortality) are unclear. A better understanding about the variability in these estimates arising from the use of different algorithms is critical in planning and interpreting health services research and epidemiologic studies about AE-COPD, as well as quality improvement initiatives in this population.
We therefore conducted a study to compare estimates of the number and outcomes of hospitalizations for AE-COPD when different published algorithms are applied to a nationally representative sample of all hospitalizations in the United States. We also examined how our understanding regarding trends in the health and financial burden of hospitalizations for AE-COPD would vary depending on which algorithm was employed. We hypothesized that algorithms based on different ICD-9-CM codes would identify not only different numbers of hospitalizations for AE-COPD but also patients with differing characteristics and outcomes.
MATERIALS AND METHODS
Data source
We used the Agency for Healthcare Research and Quality (AHRQ)–sponsored Nationwide Inpatient Sample (NIS) because it is the largest all-payer source of data on hospitalized patients in the United States. The NIS contains data on all admissions from a 20% stratified probability sample of all acute care non-governmental hospitals, providing the opportunity to identify, track, and analyze national trends in hospitalizations (Citation12, Citation19, Citation20). For the years 2000 to 2006, approximately 1,000 hospitals located in 28 to 38 states contributed a total of nearly 8 million records per year to this database. This study was exempt from institutional review board approval.
Study design
The number of hospitalizations for AE-COPD was estimated based on 5 previously published (Citation7, Citation10, Citation12, Citation14, Citation17) ICD-9-CM algorithms (, ). Our analysis was limited to these 5 algorithms for simplicity, as they represent the spectrum of potential ICD-9-CM algorithms used to identify AE-COPD. For ease of interpretation we refer to the algorithms by number and an author or organization who has published using the specified algorithm. The first algorithm, (algorithm 1 [Patil] (12)) selects hospitalizations with primary diagnosis of COPD (defined as a single ICD-9-CM code for COPD exacerbation: 491.21 obstructive chronic bronchitis with acute exacerbation) and represents one extreme approach (use of a ICD-9-CM code for acute exacerbation).
Table 1. ICD-9-CM codes used in algorithms to identify AE-COPD
Table 2. Different ICD-9-CM algorithms used to identify hospitalizations for AE-COPD
Algorithm 2, perhaps the most commonly used, is recommended by the National Committee for Quality Assurance Health Effectiveness Data and Information Set (HEDIS) to measure the quality of care in patients hospitalized for AE-COPD (Citation14). It selects hospitalizations with a primary diagnosis of COPD (defined as one of several ICD-9-CM codes, even those that are not specific for an exacerbation). Algorithm 3, used by Holguin et al. (Citation10), has been employed by health services researchers to identify patients hospitalized for AE-COPD and includes the codes recommended by HEDIS to identify patients with a primary diagnosis of COPD, as well as a primary diagnosis of ICD-9-CM code 490 (bronchitis, not specified as acute or chronic). Algorithm 4 is used by the National Heart, Lung, and Blood Institute (NHLBI) for official estimates of disease burden, morbidity and mortality for patients with COPD (Citation7).
The NHLBI algorithm includes all the codes in algorithm 3 plus codes for bronchiectasis and allergic alveolitis to establish a primary diagnosis of COPD. Algorithm 5, used by Lee et al. (Citation17), is representative of algorithms that include hospitalizations with a primary diagnosis of COPD (even codes that are not specific for an exacerbation) or a secondary diagnosis of COPD when combined with a primary diagnosis of respiratory failure (ICD-9-CM codes 518.81, 518.82 and 518.84). Algorithms 1, 2, and 5 use a lower age limit of 40 years; however, algorithm 3 uses a lower age limit of 25 years and algorithm 4 has no lower age limit.
Among patients hospitalized for AE-COPD, characteristics examined were age, sex, and comorbidity. We did not examine race because race data were unavailable in 24 to 29% of records in the NIS data sets from 2000 to 2006. Variables for age and sex were missing in less than 1% of all hospitalizations for AE-COPD. We calculated a weighted Charlson Comorbidity Index, a validated measure for use with administrative data that correlates with in-hospital morbidity and mortality (Citation21, 22). Additionally, we examined the prevalence of specific comorbid conditions that were associated with an increased risk of in-hospital mortality (Citation10) in a previous study of hospitalized patients with COPD (hypertension, heart failure, pneumonia, ischemic heart disease, diabetes, pulmonary vascular disease, and thoracic malignancies); the Clinical Classifications Software (CCS) developed by AHRQ was used for the identification of comorbid conditions (Citation23).
Table 3. Hospitalizations, patient characteristics, and outcomes in 2006
Outcomes and measures of healthcare utilization included median length of stay (number of days from hospital admission to discharge) and total hospital days (sum of hospital days for all patients for that calendar year), median and total hospital charges (sum of hospital charges for all patients for that calendar year), the percentage of patients who received mechanical ventilation during hospitalization (ICD-9-CM procedure codes 96.04 insertion of endotracheal tube, 93.90 continuous positive airway pressure, or 96.7x continuous mechanical ventilation) (Citation12, Citation20), and the percentage of patients who died prior to discharge (in-hospital mortality). National estimates of these outcomes and measures were developed for years 2000 to 2006 using each algorithm.
Analysis
Hospital discharge weights included in the NIS were used to develop national estimates for the number of hospitalizations for AE-COPD as well as patient characteristics and outcomes (Citation24). Hospital charges for years 2000 to 2005 were converted to 2006 U.S. dollars using the Consumer Price Index for medical care (Citation25). Trends in the estimated number of hospitalizations for AE-COPD, total hospital days, and total hospital charges across all years were evaluated for each algorithm using weighted least squares regression using the inverse variance of the estimate as the analytic weight (Citation26). Trends in mechanical ventilation use, in-hospital mortality, and comorbidity were evaluated with logistic regression using year as the independent variable. Formal statistical tests comparing these parameters across algorithms were not performed as there is partial overlap in the hospitalization identified by the various algorithms (i.e., more than one algorithm may identify the same hospitalization).
Because algorithm 5 [Lee] is comprised of both patients identified by primary ICD-9-CM codes for COPD as well as patients identified by primary ICD-9-CM codes for respiratory failure (when combined with a secondary diagnosis of COPD), we also reported the prevalence of selected co-morbid conditions in each of these 2 subsets of patients in algorithm 5 to explain possible differences between this algorithm and algorithms 1-4 (which all relied on a primary diagnosis of COPD). All reported p-values are two sided, and p-values of <0.05 were considered statistically significant. Analyses were performed using STATA software package, release 10.0 (Stata Corp Inc., College Station, Texas).
RESULTS
Hospitalizations for AE-COPD
For the years 2000 to 2006, there were a total of 36.4 to 39.5 million hospitalizations per year (Citation19). The estimated number of hospitalizations for AE-COPD in 2006 varied more than 2-fold (421,000 [algorithm 1; 1.1% of hospitalizations] to 870,000 [algorithm 5; 2.2% of hospitalizations]; ). Algorithms 2-4 produced very similar estimates of the number of hospitalizations for COPD in 2006. In 2006, the addition of the code 490 (bronchitis, not specified as acute or chronic) added approximately 23,000 additional hospitalizations in both algorithms 3 [Holguin] and 4 [NHLBI] compared to algorithm 2 [HEDIS]. Codes for allergic alveolitis and bronchiectasis in algorithm 4 [NHLBI] added another 12,000 hospitalizations compared to algorithm 2 [HEDIS]. Including patients with primary diagnosis of respiratory failure with a secondary diagnosis of COPD added 201,000 hospitalizations to algorithm 5 compared to algorithm 2; including patients with a code for chronic obstructive asthma (493.22) added 118,000 hospitalizations to algorithm 5 compared to algorithm 2.
Figure 1. Prevalence of selected comorbidities* across ICD-9-CM algorithms for AE-COPD.
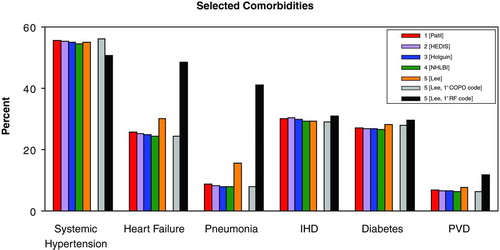
Figure 2. Trends in the number of hospitalizations, total hospital days, and total charges for AE-COPD, 2000-2006
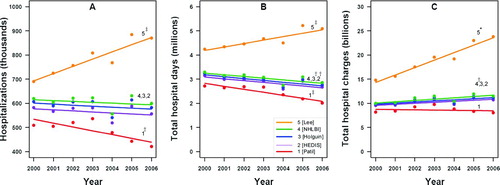
The annual number of hospitalizations for AE-COPD appeared to decrease from 2000 to 2006 when using algorithm 1, to remain unchanged when using algorithms 2, 3 or 4, and to increase when using algorithm 5 ().
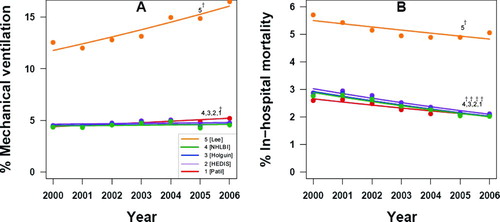
Figure 3. Trends in mechanical ventilation use and in-hospital mortality for AE-COPD, 2000-2006
Patient characteristics
Age varied little between algorithms 1-5 in 2006 despite differences in age inclusion criteria (); very few hospitalizations included subjects <40 years in the various algorithms (maximum 2.2% in algorithm 4). Slightly more than half of all hospitalizations for COPD occurred in women, regardless of algorithm. The Charlson comorbidity index was similar across algorithms, with the majority of patients identified having at least 1 additional clinically significant comorbid condition.
The prevalence of co-morbid conditions was remarkably consistent across the algorithms, except algorithm 5, which had a higher prevalence than others (). The patients with a primary diagnosis of respiratory failure (and secondary diagnosis of COPD) in algorithm 5 [Lee] largely accounted for differences between algorithm 5 and other algorithms.
Hospital days
Median length of stay for all algorithms was 4 days. In contrast, total hospital days for COPD in 2006 varied by more than 2-fold, depending on which algorithm was used (least using algorithm 1 [Patil], 2.0 million days; most using algorithm 5 [Lee], 5.1 million days). Trends in total hospital days for AE-COPD varied in both direction and magnitude from 2000 to 2006. There was a significant increase in the total number of hospital days when algorithm 5 [Lee] was applied as compared to a significant decrease in the total number of hospital days when algorithms 1-3 were applied (). No significant trend in the total number of hospital days for AE-COPD was evident using algorithm 4 [NHLBI].
Hospital charges
Hospital charges differed both between algorithms and across time. Median hospital charges in 2006 varied by as much as $2,700 (). The total yearly hospital charges were nearly three-fold higher when algorithm 5 [Lee] was compared to algorithm 1 ([Patil], $23.8 billion vs. $8.0 billion). The patients with a primary diagnosis of respiratory failure in algorithm 5 [Lee] had higher hospital charges than patients identified by a primary diagnosis of COPD (median charge per hospitalization: $31,900 vs. 12,800, respectively).
Mechanical ventilation
The use of mechanical ventilation varied by more than three-fold in 2006 (4.6% using algorithm 4 [NHLBI] vs. 16.5% using algorithm 5 [Lee], ). The percentage of patients admitted for AE-COPD who received mechanical ventilation did not change significantly from 2000 to 2006 using algorithms 2 [HEDIS], 3 [Holguin], or 4 [NHLBI]. However, mechanical ventilation use increased significantly when algorithms 1 [Patil] and 5 [Lee] were applied (). The patients with a primary diagnosis of respiratory failure in algorithm 5 [Lee] had higher rates of mechanical ventilation than patients identified by a primary diagnosis of COPD (55.7% vs. 4.7%, respectively).
In-hospital mortality
In 2006, in-hospital mortality varied by more than 2-fold depending on which algorithm was applied (2.0 % using algorithm 3 [Holguin] vs. 5.1% using algorithm 5 [Lee], ). In those identified by algorithm 5, mortality was 8 times greater in the subset of patients with a primary diagnosis of respiratory failure and a secondary diagnosis of COPD (16%) compared to those with a primary diagnosis of COPD (2%), even though the same codes for COPD were employed. In-hospital mortality appeared to decrease for all algorithms across years 2000 to 2006 ().
DISCUSSION
We have demonstrated that estimates of the number of hospitalizations for AE-COPD in the United States vary more than 2-fold, depending on which ICD-9-CM algorithm is used. We have also demonstrated that annual estimates of outcomes and measures of healthcare utilization differ substantially, as do trends in these estimates from 2000 to 2006, depending on which ICD-9-CM algorithm is applied. To our knowledge, our study is the first to quantify these discrepancies across commonly used algorithms and to highlight the need for validation studies to identify the optimal search strategy for hospitalizations due to AE-COPD. Without such information, efforts to measure and improve the quality of COPD care in hospitalized populations may be misdirected.
Although a number of previous studies have used ICD-9-CM codes to identify hospitalizations for AE-COPD, we are not aware of studies that have directly compared the various approaches. We expected to see the number of hospitalizations for AE-COPD increase in algorithms that include a larger number of ICD-9-CM codes (e.g., algorithm 5 vs. algorithm 1). There was, however, more overlap than we had expected in algorithms 2-4 due to the small numbers of additional hospitalizations identified by algorithms 3 or 4 compared to algorithm 2. Importantly, our data indicate that different algorithms lead to very different conclusions about trends in the health and economic burden of AE-COPD (e.g. total number of hospital days, total hospital charges, and in-hospital mortality). These differences are likely to be attributable to differences in the characteristics of patients captured by each algorithm.
Official U.S. estimates of the burden of AE-COPD are based on the NHLBI algorithm (algorithm 4), which consists of a primary diagnosis of chronic bronchitis, emphysema, chronic airflow obstruction, or a number of other clinical conditions (i.e.., bronchiectasis and disorders linked to allergic alveolitis). Inclusion of patients hospitalized with a primary diagnosis of bronchiectasis or allergic alveolitis will lead to a small overestimate of the health burden from COPD, since current clinical definitions of COPD do not include these disorders (Citation27, 28). The NHLBI algorithm (as well as algorithms 1–3) may also substantially underestimate the burden of AE-COPD, since more severe exacerbations that lead to respiratory failure are likely to be missed (i.e., patients with a primary diagnosis of respiratory failure are excluded in these algorithms). These more severe exacerbations are more likely to be captured in algorithm 5 [Lee].
We found that patients with a primary diagnosis of respiratory failure and a secondary diagnosis of COPD (identified by algorithm 5) have a substantially higher prevalence of comorbid conditions linked with respiratory symptoms that can mimic AE-COPD (e.g., heart failure, pneumonia) than patients with a primary diagnosis of COPD (e.g., algorithms 1–4). A higher prevalence of these comorbid conditions raises the possibility that some patients identified by algorithm 5 were in fact admitted for a condition other than AE-COPD (i.e., hospitalized for respiratory failure due to heart failure, rather than AE-COPD).
Alternatively, algorithm 5 may have helped to identify the subset of patients with more severe exacerbations (leading to respiratory failure). Thus, while it is possible that the specificity of algorithm 5 in hospitalized patients for identifying AE-COPD may be lower than algorithms 1-4, the sensitivity of algorithm 5 is likely to be higher than other algorithms. Additional research is needed to confirm this possibility.
Our study has two notable strengths. First, the data were derived from the largest nationally representative sample of hospital admissions; therefore our findings are likely to be broadly applicable to patients in the United States. Second, we directly examined the effects of applying five previously used algorithms that ranged from simple to complex for hospitalizations due to AE-COPD.
This study, however, also has some important limitations. First, the assignment of ICD-9-CM discharge diagnoses for hospitalized patients is done specifically for reimbursement purposes. The assignment of these codes may be influenced by both the clinical evidence in the medical record and by the relative rate of reimbursement anticipated for each diagnosis (Citation29, 30). Because our analyses were restricted to the data available in the NIS, we were unable to assess the validity of the individual ICD-9-CM coding algorithms. As we were unaware of prior validation studies of the algorithms to identify hospitalizations for AE-COPD, we undertook a pilot validation study in two urban teaching hospitals, comparing different algorithms to chart abstracted physician diagnosis (Citation31). We compared the primary physician diagnosis (as recorded in the physician notes) and 3 different ICD-9-CM algorithms for AE-COPD (algorithms 1 [Patil]; 2 [HEDIS]; and 5 [Lee]) in a sample of 200 hospitalizations.
The positive predictive values were 74% (algorithm 1), 62% (algorithm 2), and 60% (algorithm 5), respectively, suggesting that current algorithms for identifying AE-COPD may identify a substantial number of patients admitted for alternative conditions. Based on these data, we estimate that about 109,000 (26% of 421,000 hospitalizations identified by algorithm 1), 212,000 (38% of 557,000 hospitalizations identified by algorithm 2), and 348,000 (40% of 870,000 hospitalizations identified by algorithm 5) hospital admissions were misclassified as AE-COPD in 2006.
These findings suggest that the selection of an algorithm should depend on its intended purpose. If, for example, the intent is to identify patients for quality measurement, an algorithm with the lowest false positive rate would be desirable. In this instance, a more specific algorithm (e.g., one based on code specifically for AE-COPD) may be preferrred (e.g., algorithm 1). By contrast, if the intent is to estimate the overall burden of disease, then a more inclusive approach may be needed (e.g., algorithm 3).
Larger, multi-center validation studies are necessary, however, to develop more generalizable estimates regarding the positive predictive values of these algorithms (Citation1, 2, and Citation5) and others. Second, outcomes assessed in the current study are limited to those occurring in-hospital. The NIS data are limited to in-hospital mortality, and therefore we cannot discount the effect of possible changes in discharge practices over time and their influence on in-hospital outcomes if they varied across patients identified by the different algorithms (e.g., increasing use of home health care or home hospice). Last, our findings are based on data in acute care non-governmental hospitals and may not be generalizable to other healthcare settings.
In summary, the estimated health burden and trends in hospitalizations for AE-COPD in the U.S. differ substantially depending on which ICD-9-CM algorithm is used. To ensure an accurate estimate of the burden of AE-COPD in the United States and to ensure that quality of care initiatives target the appropriate patient population, we recommend studies be conducted to identify algorithms with the most suitable feasible level of sensitivity and specificity.
Declaration of interest
The authors report no conflicts of interest. The authors alone are responsible for the content and writing of the paper.
ACKNOWLEDGMENTS
We would like to thank Dr. Fernando Holguin, Division of Pulmonary, Allergy, and Critical Care Medicine, University of Pittsburgh, for his input on a prior version of this manuscript. This work was supported by the National Institutes of Health [Grant HL07605, B. Stein] and AHRQ [Grant 5U18HS016967-02, J. Krishnan, G. Schumock, T. Lee].
REFERENCES
- National Center for Health Statistics. International Classification of Diseases, Ninth Revision, Clinical Modification (ICD-9-CM), 2009. Retrieved September 22, 2009, from http://www.cdc.gov/nchs/icd.htm.
- Institute of Medicine. Initial national priorities for comparative effectiveness research. Washington, DC: Institute of Medicine, 2009.
- Centers for Medicare and Medicaid Services. Reporting Hospital Quality Data for Annual Payment Update. Retrieved April 2, 2009, from http://www.cms.hhs.gov/HospitalQualityInits.
- Aronsky D, Haug PJ, Lagor C, Dean NC. Accuracy of administrative data for identifying patients with pneumonia. Am J Med Qual Nov–Dec 2005; 20:319–328.
- Fisher ES, Whaley FS, Krushat WM, Malenka DJ, Fleming C, Baron JA, Hsia DC. The accuracy of Medicare's hospital claims data: progress has been made, but problems remain. Am J Public Health Feb 1992; 82:243–248.
- Ginde AA, Tsai CL, Blanc PG, Camargo CA, Jr. Positive predictive value of ICD-9-CM codes to detect acute exacerbation of COPD in the emergency department. Jt Comm J Qual Patient Saf Nov 2008; 34:678–680.
- National Heart Lung and Blood Institute. 2007 NHLBI Morbidity and Mortality Chart Book. Retrieved December 1, 2008, from http://www.nhlbi.nih.gov/resources/docs/cht-book.htm.
- Mannino DM, Homa DM, Akinbami LJ, Ford ES, Redd SC. Chronic obstructive pulmonary disease surveillance—United States, 1971–2000. MMWR Surveill Summ. Aug 2 2002; 51:1–16.
- Jemal A, Ward E, Hao Y, Thun M. Trends in the leading causes of death in the United States, 1970-2002. JAMA Sep 14 2005; 294:1255–1259.
- Holguin F, Folch E, Redd SC, Mannino DM. Comorbidity and mortality in COPD-related hospitalizations in the United States, 1979 to 2001. Chest Oct 2005; 128:2005–2011.
- Lindenauer PK, Pekow P, Gao S, Crawford AS, Gutierrez B, Benjamin EM. Quality of care for patients hospitalized for acute exacerbations of chronic obstructive pulmonary disease. Ann Intern Med Jun 20 2006; 144:894–903.
- Patil SP, Krishnan JA, Lechtzin N, Diette GB. In-hospital mortality following acute exacerbations of chronic obstructive pulmonary disease. Arch Intern Med May 26 2003; 163:1180–1186.
- McGhan R, Radcliff T, Fish R, Sutherland ER, Welsh C, Make B. Predictors of rehospitalization and death after a severe exacerbation of COPD. Chest Dec 2007; 132:1748–1755.
- National Committee on Quality Assurance. HEDIS 2009. Retrieved April 2, 2009, from http://www.ncqa.org/tabid/ 59/Default.aspx.
- Fan VS, Bryson CL, Curtis JR, Fihn SD, Bridevaux PO, McDonell MB, Au DH. Inhaled corticosteroids in chronic obstructive pulmonary disease and risk of death and hospitalization: time-dependent analysis. Am J Respir Crit Care Med Dec 15 2003;168:1488–1494.
- Lee TA, Wilke C, Joo M, Stroupe KT, Krishnan JA, Schumock GT, Pickard AS. Outcomes associated with tiotropium use in patients with chronic obstructive pulmonary disease. Arch Intern Med Aug 10 2009; 169:1403–1410.
- Lee TA, Schumock GT, Bartle B, Pickard AS. Mortality risk in patients receiving drug regimens with theophylline for chronic obstructive pulmonary disease. Pharmacotherapy Sep 2009;29:1039–1053.
- Cannon KT, Sarrazin MV, Rosenthal GE, Curtis AE, Thomas KW, Kaldjian LC. Use of mechanical and noninvasive ventilation in black and white chronic obstructive pulmonary disease patients within the Veterans Administration health care system. Med Care Jan 2009;47:129–133.
- HCUP Nationwide Inpatient Sample (NIS). Healthcare Cost and Utilization Project (HCUP) 2000–2006. Agency for Healthcare Research and Quality, Rockville, MD. Retrieved December 1, 2008, from www.hcup-us.ahrq.gov/nisoverview.jsp.
- Krishnan V, Diette GB, Rand CS, Bilderback AL, Merriman B, Hansel NN, Krishnan JA. Mortality in patients hospitalized for asthma exacerbations in the United States. Am J Respir Crit Care Med Sep 15 2006; 174:633–638.
- Li B, Evans D, Faris P, Dean S, Quan H. Risk adjustment performance of Charlson and Elixhauser comorbidities in ICD-9 and ICD-10 administrative databases. BMC Health Serv Res 2008; 8:12.
- Quan H, Sundararajan V, Halfon P, Fong A, Burnand B, Luthi JC, Saunders LD, Beck CA, Feasby TE, Ghali WA. Coding algorithms for defining comorbidities in ICD-9-CM and ICD-10 administrative data. Med Care Nov 2005; 43:1130–1139.
- Elixhauser, A., Steiner, C., Palmer, L. Clinical Classifications Software (CCS), 2004. February 6, 2004. U.S. Agency for Healthcare Research and Quality. Retrieved June 24, 2009, from http://www.hcup-us.ahrq.gov/reports/2004CCSUserGuideFinal.pdf.
- Houchens R, Elixhauser A. Final Report on Calculating Nationwide Inpatient Sample (NIS) Variances, 2001. HCUP Method Series Report # 2003-02. ONLINE June 2005 (revised June 6, 2005). U.S. Agency for Healthcare Research and Quality. Retrieved December 28, 2008, from http://www.hcup-us.ahrq.gov//reports/CalculatingNISVariances 525200106092005.pdf.
- U.S. Bureau of Labor Statistics Data. Consumer Price Index—All Urban Consumers-Medical Care. US Bureau of Labor Statistics Web site. Retrieved February 19, 2009, from http://www.bls.gov/cpi/ . Accessed February 19, 2009.
- Houchens RL, Elixhauser A. Using the HCUP Nationwide Inpatient Sample to Estimate Trends. (Updated for 1988–2004). HCUP Methods Series Report #2006-05 Online. Retrieved August 18, 2006, from http://www.hcup-us.ahrq.gov/reports/methods.jsp.
- Celli BR, MacNee W. Standards for the diagnosis and treatment of patients with COPD: A summary of the ATS/ERS position paper. Eur Respir J Jun 2004; 23:932–946.
- Rabe KF, Hurd S, Anzueto A, Barnes PJ, Buist SA, Calverley P, Fukuchi Y, Jenkins C, Rodriguez-Roisin R, van Weel C, Zielinski J. Global strategy for the diagnosis, management, and prevention of chronic obstructive pulmonary disease: GOLD executive summary. Am J Respir Crit Care Med 2007; 176:532–535.
- Hsia DC, Krushat WM, Fagan AB, Tebbutt JA, Kusserow RP. Accuracy of diagnostic coding for Medicare patients under the prospective-payment system. N Engl J Med. Feb 11 1988; 318:352–355.
- O'Malley KJ, Cook KF, Price MD, Wildes KR, Hurdle JF, Ashton CM. Measuring diagnoses: ICD code accuracy. Health Serv Res Oct 2005;40(5 Pt 2):1620–1639.
- Stein BD, Bautista A, Schumock GT, Lee TA, Shah LM, Meltzer DO, Krishnan JA. Validity of ICD-9 discharge diagnoses in identifying patients hospitalized for COPD. Am J Respir Crit Care Med 2009;179:A2159.