Abstract
Background: Chronic sputum production is a significant but variable complaint in COPD; its effect on symptom burden has not been comprehensively described. We sought to characterize the daily burden of chronic sputum production in severe COPD and the phenotype of those with chronic sputum symptoms. Methods: We studied 50 outpatients with severe COPD who used an electronic diary to document peak expiratory flow (PEF) and respiratory symptoms daily for up to 2 years. A sputum index was derived based on complaints of sputum quantity, color, and consistency, and patients were divided into groups based on average daily sputum index (Low, Medium, High). The presence and severity of respiratory symptoms were scored by a novel method using daily changes in symptoms and PEF from baseline and were categorized into mild, moderate, and severe. Percent emphysema was measured using quantitative CT. Results: In the 14,500 observation days, severe symptom days were greater in the Medium and High groups (379/6089, 1609/4091, and 2624/4317 observation days in Low, Medium, and High, p < 0.0001). The same trend was found even when sputum complaints were removed from the symptom severity score. Observed/predicted PEF ratio was lower in the High group (0.56 ± 0.24, 0.55 ± 0.19, and 0.42 ± 0.12 in each group, p < 0.05 for High compared to Medium and Low). Percent emphysema inversely correlated with average sputum index and quantity (r = −0.449 and r = −0.584, respectively, p < 0.05). Conclusions: Increased sputum production in severe COPD is frequently encountered daily and is associated with more respiratory symptoms, worse airflow obstruction, and less emphysema.
INTRODUCTION
Chronic mucus overproduction and hypersecretion are essential aspects of chronic obstructive pulmonary disease (COPD) pathophysiology. Increased mucus production and goblet cell hyperplasia have been found in both the small and large airways of COPD patients (Citation1–4), and contribute to airflow obstruction by several mechanisms, including physical occlusion of the lumen, increasing epithelial thickness, and reduced surface tension leading to airway collapse (Citation4–6). Goblet cell hyperplasia is observed in chronic bronchitics as well as in emphysema. In the National Emphysema Treatment Trial, many emphysema patients who received lung reduction surgery demonstrated significant small airway luminal occlusion by mucus, even with an overwhelming predominate clinical and radiographic phenotype of emphysema (Citation7).
The clinical correlate to these pathologic abnormalities is chronic sputum production. The clinical consequences of chronic sputum production include a hastened decline in lung function and an increased risk of COPD hospitalizations (Citation8–11). Furthermore, in severe COPD, chronic sputum production has been associated with mortality, most likely resulting from an increased risk of respiratory infection (Citation8, Citation12, Citation13). Unfortunately, these associations between sputum symptomatology and clinical outcomes have been based on general descriptors of sputum complaints (i.e., the presence or absence of cough and mucus), with little analysis of the multiple qualities of sputum symptoms. In addition, data that examine the severity and daily burden of chronic sputum symptoms are currently lacking.
We analyzed data from 50 COPD patients who recorded daily symptoms prospectively for up to 2 years, to comprehensively characterize the daily burden of sputum symptoms (e.g., nature of daily sputum symptoms and their magnitude) in severe COPD. We hypothesized that, for a given level of airflow obstruction, those with chronic sputum production would have worse respiratory symptoms, decreased peak flow, a greater degree of airway disease, and less emphysema contributing to their airflow obstruction compared to COPD patients without chronic sputum production.
METHODS
Design overview
The Pennsylvania Study of COPD Exacerbations (Pa-SCOPE) was a randomized, multicenter prospective two group parallel study to evaluate the efficacy of daily monitoring of symptoms and peak expiratory flow for the early treatment of symptoms heralding an impending COPD exacerbation. The protocol for the study was approved by the Institutional Review Board, and written consent was obtained from each patient. Enrolled patients were followed longitudinally for up to 2 years. Patients recorded symptoms via electronic diary on a daily basis. For this analysis, patients were divided in a post hoc fashion into groups based on their average sputum symptoms over the observation period. Respiratory symptoms, peak flow, and percent emphysema were measured and compared between groups. This study was supported by a grant from the Pennsylvania Department of Health RFA 02-07-20.
Participants
All COPD patients who were hospitalized for acute exacerbation within one year prior to screening were recruited for enrollment into Pa-SCOPE. Eligible patients were between the age of 40 and 80 years, had a diagnosis of COPD, had evidence of airflow obstruction on spirometry (FEV1≤70% predicted and FEV1/FVC≤70) without significant bronchodilator reversibility (% change in FEV1 <15%), history of smoking >20 pack-years, had a life expectancy >6 months, and had no comorbidities expected to impact survival or study participation. The primary results of this study will be reported elsewhere; the focus of this analysis was on the presence and magnitude of chronic sputum production and their effects on respiratory symptoms. The current analysis was restricted to those with severe COPD (FEV1<50% predicted) who had daily recorded data for 3 months or more to ensure chronicity of complaints of sputum production. Of the 69 patients enrolled, 50 patients met the above criteria. Nine patients were excluded based on FEV1, and 10 patients had less than 3 months of daily recorded data.
Patient assessments
During the initial visit, patients were given the ATS DLD 78A questionnaire, a validated questionnaire of adult respiratory symptoms (Citation14). The following variables were determined at baseline and rated daily for up to 2 years, and transmitted via electronic diary on a daily basis (scales included in parentheses):
Breathlessness (0–10)
Sputum Quantity (none, scant, <1/2 tsp, ≥1/2 tsp, <1 Tsp, ≥1 Tsp, ≥1/4 cup)
Sputum Color (none or white, yellow, green, brown)
Sputum Consistency (none, watery, thin, thick)
Minor Symptoms (the presence or absence of cough, wheeze, sore throat, nasal congestion)
Temperature >100°F (yes or no)
Peak Expiratory Flow
Group assignments
To analyze the effects of chronic sputum production, the three daily sputum variables were assigned points and added together to comprise a daily sputum index in a post hoc fashion (). Three patient groups were created based on average daily sputum index: Low, (sputum index 0–3), Medium (sputum index 3–7), and High (sputum index >7). Threshold values for each group were determined by analyzing the distribution of sputum indices over the observation period and dividing them approximately into thirds. There was a total of 14,500 patient observation days in 50 patients. 39% of the observed patient days had a sputum index of <3, 33% had an index of 3–7, and 28% had an index of >7.
Table 1 Sputum Index
Determination of Symptom Severity
The presence and severity of respiratory symptoms were determined by a novel method using a daily symptom severity score as outlined in (© G.J. Criner, 2004, US copyright # TX7-170-236). Patients were assigned points if breathlessness or sputum increased above baseline (+1 if breathlessness ≥3 points above baseline, +0.5 if sputum quantity increased above baseline, +0.5 if change in sputum color, +0.5 if change in sputum consistency), if PEF decreased below baseline (+1.0 if ≤ 80% below baseline), if temperature was over 100°F (+0.5 if “yes”), and if two or more minor symptoms were present (+0.5 if 2 positive symptoms of cough, wheeze, sore throat, or nasal congestion). Symptoms were considered mild with a score of 1–1.5; moderate if 2–2.5; and severe if 3 or greater.
Table 2 Symptom severity score
Statistical analysis
Data are expressed as mean ± SD unless stated otherwise. Statistics were performed using JMP 8 (SAS, Cary, NC). Baseline demographic data, lung function, blood gas data, 6 minute walk distance, respiratory medications, peak flow as percent predicted, % emphysema, symptom index, and number of days with various mild, moderate, and severe symptoms were compared among the 3 groups using one way ANOVA or Chi-Square Test. Spearman correlation was used to examine the relationship between % emphysema and sputum index and individual sputum variables.
RESULTS
The baseline patient characteristics are summarized in . There were 22 patients in the Low group, 14 in the Medium group, and 14 in the High group. In comparison to the ATS DLD 78A questionnaire, 6/22 (27%) patients in the Low group described a history of chronic phlegm production, and 7/14 (50%) and 11/14 (79%) patients in the Medium and High groups, respectively, described chronic phlegm production. FEV1 was 28±8% predicted in the entire cohort, and the three groups were similar in terms of lung function, demographics, smoking history, 6 minute walk distance, gas exchange, and body mass index. There were 17/22 patients (77%), 12/14 patients (86%), and 12/14 patients (86%) in the low, medium, and high groups that had greater than 6 months of daily data.
Table 3 Patient characteristics
Table 4 Results
Of these patients, one in the Low group and one in the High group changed group assignments based on average sputum index after 6 months (i.e. the significant majority of patients had similar sputum symptoms for the duration of the observation period). The majority of the patients (71–91%) reported using long acting beta agonists and long acting anticholinergics. Inhaled corticosteroid use was seen in 39–50% of the individuals, and oral corticosteroids were used by 43–74% of the patients within the year prior to enrollment. Oxygen was used by 43–75% of the patients. Overall, use of respiratory medications and oxygen were similar among the three groups.
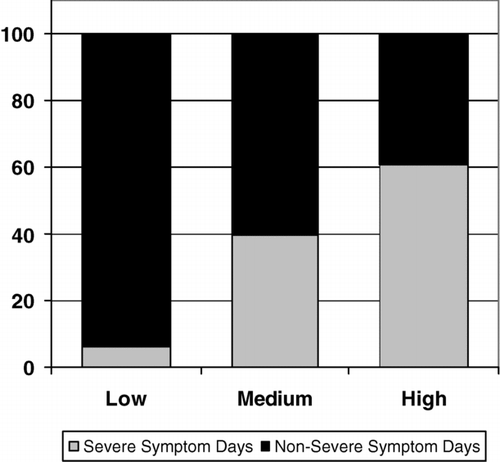
Data on symptoms, emphysema, and peak flow are summarized in . As sputum complaints increased, there were an increasing number of total observation days that patients had severe symptoms (379/6089 in Low, 1609/4091 in Medium, and 2624/4317 in High, p < 0.0001) and an increased percentage of severe symptom days per patient (6.8 ± 9.5, 38.4 ± 38.5, and 71.0 ± 33.3% in Low, Medium, and High, respectively, p < 0.0001). A similar trend was seen for moderate plus severe symptom days combined (2349/6089, 3382/4091, and 4303/4317 in Low, Medium, and High, respectively, p < 0.0001) and percent moderate plus severe symptom days per patient (41.9 ± 40.0, 83.8 ± 22.0, 99.7 ± 0.6 in Low, Medium, and High, respectively, p < 0.0001). When the sputum criteria were removed from the symptom severity score and the same scoring criteria for each category were applied, the same trend of increasing numbers of severe symptom days and moderate plus severe symptom days was again seen in the Medium and High groups. demonstrates the percent of total patient observation days with severe symptoms in each group.
As sputum complaints increased across groups, the majority of the sputum symptoms focused on quantity (0.64 ± 0.57, 3.70 ± 0.76, and 4.67 ± 0.48 in Low, Medium, and High, p < 0.0001) followed by consistency (0.30 ± 0.24, 1.71 ± 0.33, and 2.6 ± 0.41 in Low, Medium, and High, p < 0.0001). The least different sputum symptom among the three groups was color (0.04 ± 0.05, 0.20 ± 0.21, 0.64 ± 0.57 in Low, Medium, and High, p < 0.001 when the High compared to Medium and Low). demonstrates the average sputum indices as well as its components in each patient.
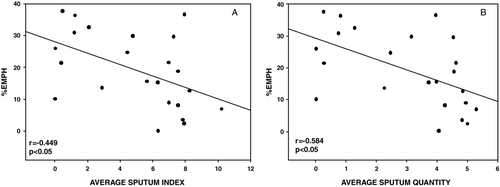
All groups had low daily PEF rates compared to the predicted peak flow rates, but the High group had a significantly lower average peak flow/ predicted peak flow ratio compared to the Medium and Low groups (0.56 ± 0.24 in Low, 0.53 ± 0.19 in Medium, and 0.42 ± 0.12 in High, p < 0.0001 compared to the Medium and Low groups). There was a trend toward less percent emphysema as sputum indices increased from Low to High (p = 0.10). However, there was a significant inverse relationship between percent emphysema and average sputum index and average sputum quantity (r = −0.449, p < 0.05 and r = −0.584, p < 0.05, respectively; see ).
DISCUSSION
Chronic mucus hypersecretion (CMH) has been shown to accelerate lung function decline, increase risk of respiratory infection, and increase hospitalization rates in large epidemiologic studies (Citation10, Citation12, Citation16, 17). Although these studies examined large numbers of patients, they offer little phenotypic description or details about sputum production or its impact on daily symptoms in severe COPD patients. In addition, although believed to be common in COPD, the prevalence of CMH is variable and poorly defined, and a careful characterization of sputum complaints and the associated clinical and radiographic features has not been performed. In our study, we described in detail the daily burden of chronic sputum production in patients with severe COPD, and characterized their effects on respiratory symptoms, airflow obstruction, and radiographic phenotype.
We showed that, in a group with very severe airflow obstruction, those with greater complaints of sputum production had more respiratory symptoms, including dyspnea, cough, wheeze, and nasal symptoms. This could not be explained by differences in lung function, exercise capacity, weight, or demographic factors. This study also adds to our prior results showing a strong correlation of the symptom severity score with validated measures of health related quality of life (Citation18). This association has significant clinical implications. Respiratory symptoms have prognostic value in COPD, such as an increased risk of death (Citation19, 20) and COPD exacerbation (Citation21, 22).
Figure 1 Percent of total patient observation days meeting criteria for severe symptoms in each tertile. p < 0.0001 for differences between Low, Medium, and High.
Therefore, the increased dyspnea in the groups with higher sputum symptoms not only reduces quality of life (Citation23) but also puts these patients in a higher risk group for morbidity and mortality. Interestingly, differences in respiratory symptoms were still demonstrated between groups despite similar baseline MMRC dyspnea and BODE scores. This suggests that identification of sputum production in a comprehensive semi-quantitative fashion has additional benefit to these validated metrics of COPD symptom assessment and outcome, and perhaps our symptom severity score provides a more representative biopsy of respiratory symptomatology.
Our study adds new information to our knowledge of chronic sputum production in COPD. Firstly, we found that a significant proportion, approximately one-third, of patients with severe COPD described severe sputum symptoms on a daily basis, despite aggressive medical therapy with long acting bronchodilators and corticosteroids. Secondly, our sputum index correlates roughly with the ATS DLD 78A questionnaire's assessment of phlegm production, but we add further detail by dissecting sputum symptoms into its multiple components. We scored the quantity of phlegm produced in greater detail, sputum color, as a barometer of airways inflammation and bacterial colonization (Citation24), and grades of viscosity, which may reflect tenacity of the secretions and difficulty in expectoration. Sputum purulence has been studied in chronic bronchitis and bronchiectasis (Citation24–26), but other qualities of sputum production have not been analyzed to this degree.
At first glance, it appears that the presence of greater respiratory symptoms in the higher groups is simply a mathematical relationship, since sputum symptoms are part of the symptom severity score. To account for this, we analyzed the respiratory symptoms unrelated to sputum, such as breathlessness, cough, wheeze, and nasal congestion, and found the same trend of worse respiratory symptoms in the higher groups. In addition, it should be emphasized that points in the symptom severity score were assigned based on changes in symptoms above baseline measurements, not the average sputum index for each patient, which was only used to divide the patients into groups. These factors suggest that the relationship between sputum severity and other respiratory symptoms is real, and not just a mathematical correlation.
Figure 2 Average daily sputum index by individual patient, shown in Panel A. Average individual components of the sputum index (quantity, color, and consistency) shown in Panels B, C, and D. Patients ranked by average daily sputum index. x = Low, + = Medium, Δ = High.
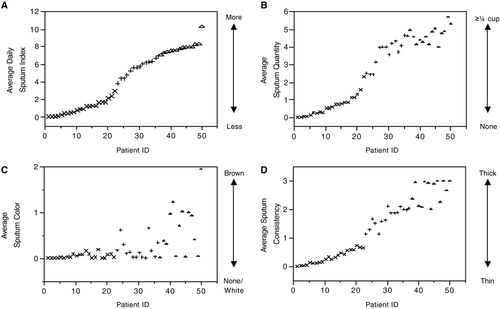
Figure 3 Average daily Sputum Index (A) and quantity (B) compared to percent emphysema. %Emph = percent lung attenuation at −950 Hounsfield units. n = 23.
We also gain further insight into disease pathophysiology by showing the relationship between sputum production and radiographic evidence of emphysema and observing more severely reduced PEF in those with high sputum production, suggesting that this group has a higher burden of airway pathology. Although only a trend toward a decrease in total percent emphysema was found as sputum increased between the three groups, we believe this is due to sample size, as only a representative sample of each group was analyzed. What is more significant is the moderately strong inverse correlation between sputum complaints and percent emphysema when the group was analyzed as a whole.
In this cohort of patients with a narrow range of lung function, this inverse relationship implies that the airflow obstruction is increasingly the consequence of airways disease not emphysema as sputum production worsens. This study is a significant contribution to the current literature correlating clinical presentation to radiographic phenotype in COPD. Although multiple studies have related the degree of emphysema or airway wall thickness with lung function (Citation27–30), few studies have characterized radiographic metrics of COPD based on sputum complaints. Radiographic airway thickness was not quantified in our study, and this deserves further investigation.
Some limitations to this analysis exist. The Pa-SCOPE study was designed to analyze the effects of daily monitoring of symptoms and early intervention on outcomes for COPD exacerbations; it was not designed to look specifically at chronic sputum production, and the sputum index was derived post hoc. A difference in exacerbation rate and hospitalizations in each group was difficult to quantify, given the low numbers and the confounding influence of the telemedicine approach versus the standard of care on management. The patients were divided into groups based on their average sputum complaints, so some information is not captured regarding the day to day variation in sputum and the trajectory of sputum complaints before, during, and after an exacerbation. Finally, although the symptom severity score is novel and more quantitative, it has not been used for clinical purposes prior to this study.
Nonetheless, this study highlights the clinical and radiographic differences in COPD patients with and without chronic sputum production and underscores its clinical importance. This study provides better insight into this phenotype of COPD patients, and it helps identify a more symptomatic subset of patients that is at increased risk of poor outcomes. Furthermore, our study shows that the use of a relatively simple assessment of sputum symptomatology adds valuable clinical information that should be more frequently utilized.
The utility of the detailed daily quantification of symptoms was to quickly identify an escalation of symptoms that signaled an impending COPD exacerbation; in our analysis, an aggregate assessment of these daily data was used to describe clinical and radiographic phenotype of patients with severe COPD. Therefore, it appears that a one time aggregate assessment of the multiple qualities of sputum symptoms over several months would have similar predictive value as multiple daily assessments, as it was performed in the Pa-SCOPE study. Long-term evaluation of this novel method of daily symptom assessment is needed and should prove to be valuable in developing more effective ways of assessing prognosis and treating COPD patients.
DECLARATION OF INTEREST
The authors report no conflicts of interest. The authors alone are responsible for the content and writing of the paper.
REFERENCES
- Saetta M, Turato G, Baraldo S, Zanin A, Braccioni F, Mapp CE, Maestrelli P, Cavallesco G, Papi A, Fabbri LM. Goblet cell hyperplasia and epithelial inflammation in peripheral airways of smokers with both symptoms of chronic bronchitis and chronic airflow limitation. Am J Respir Crit Care Med 2000; 161:1016–1021.
- Hogg JC, Chu F, Utokaparch S, Woods R, Elliott WM, Buzatu L, Cherniack RM, Rogers RM, Sciurba FC, Coxson HO, Pare PD. The nature of small-airway obstruction in chronic obstructive pulmonary disease. N Engl J Med 2004; 350:2645–2653.
- Innes AL, Woodruff PG, Ferrando RE, Donnelly S, Dolganov GM, Lazarus SC, Fahy JV. Epithelial mucin stores are increased in the large airways of smokers with airflow obstruction. Chest 2006; 130:1102–1108.
- Kim V, Kelemen SE, Abuel-Haija M, Gaughan J, Sharafkhaneh A, Evans CM, Dickey BF, Solomides CC, Rogers TJ, Criner GJ. Small Airway Mucous Metaplasia and Inflammation in Chronic Obstructive Pulmonary Disease. J COPD 2008; 5:329–338.
- Barnes PJ, Shapiro SD, Pauwels RA. Chronic obstructive pulmonary disease: molecular and cellular mechanisms. Eur Respir J 2003; 22:672–688.
- Burgel PR, Nadel JA. Roles of epidermal growth factor receptor activation in epithelial cell repair and mucin production in airway epithelium. Thorax 2004; 59:992–996.
- Hogg JC, Chu FS, Tan WC, Sin DD, Patel SA, Pare PD, Martinez FJ, Rogers RM, Make BJ, Criner GJ, Cherniack RM, Sharafkhaneh A, Luketich JD, Coxson HO, Elliott WM, Sciurba FC. Survival after lung volume reduction in chronic obstructive pulmonary disease: insights from small airway pathology. Am J Respir Crit Care Med 2007; 176:454–459.
- Lange P, Nyboe J, Appleyard M, Jensen G, Schnohr P. Relation of ventilatory impairment and of chronic mucus hypersecretion to mortality from obstructive lung disease and from all causes. Thorax 1990; 45:579–585.
- Sherman CB, Xu X, Speizer FE, Ferris BG, Jr, Weiss ST, Dockery DW. Longitudinal lung function decline in subjects with respiratory symptoms. Am Rev Respir Dis 1992; 146:855–859.
- Vestbo J, Prescott E, Lange P. Association of chronic mucus hypersecretion with FEV1 decline and chronic obstructive pulmonary disease morbidity. Copenhagen City Heart Study Group. Am J Respir Crit Care Med 1996; 153:1530–1535.
- Vestbo J. Epidemiological studies in mucus hypersecretion. Novartis Found Symp 2002; 248:3–12; discussion 12–9, 277–82.
- Prescott E, Lange P, Vestbo J. Chronic mucus hypersecretion in COPD and death from pulmonary infection. Eur Respir J 1995; 8:1333–1338.
- Miravitlles M, Guerrero T, Mayordomo C, Sanchez-Agudo L, Nicolau F, Segu JL. Factors associated with increased risk of exacerbation and hospital admission in a cohort of ambulatory COPD patients: a multiple logistic regression analysis. The EOLO Study Group. Respiration 2000; 67:495–501.
- Ferris BG. Epidemiology Standardization Project (American Thoracic Society). Am Rev Respir Dis 1978; 118:1–120.
- Hankinson JL, Odencrantz JR, Fedan KB. Spirometric reference values from a sample of the general U.S. population. Am J Respir Crit Care Med 1999; 159:179–187.
- Griffith KA, Sherrill DL, Siegel EM, Manolio TA, Bonekat HW, Enright PL. Predictors of loss of lung function in the elderly: the Cardiovascular Health Study. Am J Respir Crit Care Med 2001; 163:61–68.
- Pelkonen M, Notkola IL, Nissinen A, Tukiainen H, Koskela H. Thirty-year cumulative incidence of chronic bronchitis and COPD in relation to 30-year pulmonary function and 40-year mortality: a follow-up in middle-aged rural men. Chest 2006; 130:1129–1137.
- Ciccolella DE, Cordova FC, Criner GJ. Relationship of a COPD Daily Symptom Score to Quality of Life (QOL) and Functional Status [abstract]. Am J Respir Crit Care Med 2009; 179: A2913.
- Nishimura K, Izumi T, Tsukino M, Oga T. Dyspnea is a better predictor of 5-year survival than airway obstruction in patients with COPD. Chest 2002; 121:1434–1440.
- Celli BR, Cote CG, Marin JM, Casanova C, Montes de Oca M, Mendez RA, Pinto Plata V, Cabral HJ. The body-mass index, airflow obstruction, dyspnea, and exercise capacity index in chronic obstructive pulmonary disease. N Engl J Med 2004; 350:1005–1012.
- Ramsey SD, Hobbs FD. Chronic obstructive pulmonary disease, risk factors, and outcome trials: comparisons with cardiovascular disease. Proc Am Thorac Soc 2006; 3:635–640.
- Marin JM, Carrizo SJ, Casanova C, Martinez-Camblor P, Soriano JB, Agusti AG, Celli BR. Prediction of risk of COPD exacerbations by the BODE index. Respir Med 2009; 103:373–378.
- Hajiro T, Nishimura K, Tsukino M, Ikeda A, Koyama H, Izumi T. Comparison of discriminative properties among disease-specific questionnaires for measuring health-related quality of life in patients with chronic obstructive pulmonary disease. Am J Respir Crit Care Med 1998; 157:785–790.
- Stockley RA, Bayley D, Hill SL, Hill AT, Crooks S, Campbell EJ. Assessment of airway neutrophils by sputum colour: correlation with airways inflammation. Thorax 2001; 56:366–372.
- Hill AT, Campbell EJ, Hill SL, Bayley DL, Stockley RA. Association between airway bacterial load and markers of airway inflammation in patients with stable chronic bronchitis. Am J Med 2000; 109:288–295.
- Murray MP, Pentland JL, Turnbull K, MacQuarrie S, Hill AT. Sputum colour: a useful clinical tool in non-cystic fibrosis bronchiectasis. Eur Respir J 2009; 34:361–364.
- Nakano Y, Muro S, Sakai H, Hirai T, Chin K, Tsukino M, Nishimura K, Itoh H, Pare PD, Hogg JC, Mishima M. Computed tomographic measurements of airway dimensions and emphysema in smokers. Correlation with lung function. Am J Respir Crit Care Med 2000; 162:1102–1108.
- Baldi S, Miniati M, Bellina CR, Battolla L, Catapano G, Begliomini E, Giustini D, Giuntini C. Relationship between extent of pulmonary emphysema by high-resolution computed tomography and lung elastic recoil in patients with chronic obstructive pulmonary disease. Am J Respir Crit Care Med 2001; 164:585–589.
- Nakano Y, Wong JC, de Jong PA, Buzatu L, Nagao T, Coxson HO, Elliott WM, Hogg JC, Pare PD. The prediction of small airway dimensions using computed tomography. Am J Respir Crit Care Med 2005; 171:142–146.
- Hasegawa M, Nasuhara Y, Onodera Y, Makita H, Nagai K, Fuke S, Ito Y, Betsuyaku T, Nishimura M. Airflow limitation and airway dimensions in chronic obstructive pulmonary disease. Am J Respir Crit Care Med 2006; 173:1309–1315.