Abstract
Although influenza has been associated with chronic obstructive pulmonary disease (COPD) exacerbations, it is not clear the extent to which this association affects healthcare use in the United States. The first goal of this project was to determine to what extent the incidence of COPD hospitalizations is associated with seasonal influenza. Second, as a natural experiment, we used influenza activity to help predict COPD admissions during the 2009 H1N1 influenza pandemic. To do this, we identified all hospitalizations between 1998 and 2010 in the Nationwide Inpatient Sample from the Healthcare Cost and Utilization Project (HCUP) during which a primary diagnosis of COPD was recorded. Separately, we identified all hospitalizations during which a diagnosis of influenza was recorded. We formulated time series regression models to investigate the association of monthly COPD admissions with influenza incidence. Finally, we applied these models, fit using 1998–2008 data, to forecast monthly COPD admissions during the 2009 pandemic. Based on time series regression models, a strong, significant association exists between concurrent influenza activity and incidence of COPD hospitalizations (p-value < 0.0001). The association is especially strong among older patients requiring mechanical ventilation. Use of influenza data to predict COPD admissions during the 2009 H1N1 pandemic reduced the mean-squared prediction error by 29.9%. We conclude that influenza activity is significantly associated with COPD hospitalizations in the United States and influenza activity can be exploited to more accurately forecast COPD admissions. Our results suggest that improvements in influenza surveillance, prevention, and treatment may decrease hospitalizations of patients diagnosed with COPD.
Introduction
Chronic obstructive pulmonary disease (COPD) is a major cause of morbidity and mortality in the United States (Citation1). In addition, COPD is one of the most expensive chronic diseases, and hospitalizations are a major component of direct medical costs attributable to COPD (Citation2, 3). Acute exacerbations of COPD (AECOPD) are thought to be acute inflammatory episodes triggered by environmental factors, including bacterial pathogens, viruses, and ambient air pollution (Citation4, 5). The association between influenza and AECOPD is thought to be mediated via destruction of lung epithelial cells and resultant inflammation leading to lung tissue damage, increased production of mucus, vasoconstriction, and bronchoconstriction. The exact disease mechanisms are not completely understood. However, episodes of respiratory failure and mechanical ventilation have been associated with accelerated decline of lung function and poor quality of life in patients diagnosed with COPD (Citation6, 7).
Epidemiologically, the seasonality of influenza infections and COPD exacerbations is similar, with both peaking during winter months from December to February (Citation8). Thus, although influenza has been associated with COPD exacerbations, it is less clear how important these patterns are regarding healthcare use. Understanding the extent of the association between influenza and COPD hospitalizations could lead to more focused and cost-effective efforts to prevent hospitalizations and develop novel interventions. Predicting and quantifying the burden of COPD hospitalizations using influenza-related data streams may also allow hospitals to plan for increases in hospital resources (e.g. pharmaceuticals, ventilators, and staffing of critical care units).
The purpose of this study is to use time series methods to determine whether, and to what extent, the incidence of COPD hospitalizations is associated with the seasonal variation in the incidence of influenza. Because both influenza and COPD may be caused by some other seasonal and winter-related factor, we use the unusually early peak of the 2009 H1N1 influenza pandemic in October as a natural experiment to determine if influenza and COPD admissions are associated outside of the traditional influenza season typically comprised of winter months (December through February). Finally, we provide estimates of a measure of attributable risk that further characterize the relationship between COPD and influenza.
Methods
Data source
All data were extracted from the Nationwide Inpatient Sample (NIS), the largest all-payer database of national discharges in the U.S. The database is maintained as part of the Healthcare Cost and Utilization Project (HCUP) by the Agency for Healthcare Research and Quality (AHRQ), and contains data from a 20% stratified sample of nonfederal acute care hospitals (Citation9). This sample includes academic medical centers, community hospitals, general hospitals, and specialty hospitals. It excludes long-term care facilities and rehabilitation hospitals. To adjust for yearly changes in the sampling design, we applied the weights provided by the AHRQ HCUP for the NIS (Citation9). Our institutional review board determined that this project was not human subjects research. All analyses were performed using R, version 2.14.1 (R Foundation for Statistical Computing).
We first identified all hospitalizations during the period from January 1998 through July 2010 during which a primary diagnosis of COPD was received. For case ascertainment, we used the International Classification of Diseases, 9th Revision, Clinical Modification (ICD-9-CM) codes 491.x (chronic bronchitis), 492.x (emphysema), 496 (chronic airway obstruction), and 493.2x (chronic obstructive asthma). We then aggregated all cases of COPD by month, based on the month that the patient was admitted to the hospital. We also identified a subgroup of patients admitted specifically for acute COPD exacerbations (ICD-9-CM code: 491.21).
For both of these groups, we then identified patients who required mechanical ventilation using the ICD-9- CM codes 93.90 (non-invasive mechanical ventilation) and/or 96.70–96.72 (continuous invasive mechanical ventilation). Separately, to build our influenza series, we identified all hospitalizations from January 1998 through July 2010 during which a primary or secondary diagnosis of influenza was received. For influenza case ascertainment, we used the ICD-9-CM codes 487.00 (influenza with pneumonia), 487.10 (influenza with other respiratory manifestations), and 487.80 (influenza with other manifestations). We then compiled monthly totals of cases of influenza in the same manner as COPD based on the month that the patient was admitted. Using this same approach, we compiled COPD and influenza series from the four census regions (Northeast, Midwest, South, and West) to confirm the results at the national level.
Time series correlation analysis
To investigate the association of COPD with influenza, we computed cross-correlation functions (CCF) for the influenza series and each of our four COPD series: COPD, AECOPD, COPD with mechanical ventilation, and AECOPD with mechanical ventilation. The CCF indicates the temporal correlations between two time series: specifically, a series at time t and another series at time t+m, where m is referred to as the lag. Because cross-correlations between time series can be spurious due to the effects of common temporal patterns, we employed a prewhitening process (Citation10). In our application, common yearly cycles are present in both the COPD series and the influenza series, since both are elevated during the winter months. The prewhitening process allows us to detect correlations based on prominent local peaks or troughs in two time series that are temporally aligned, as opposed to coincidental correlations based on shared seasonal patterns. The former are representative of a legitimate association, whereas the latter are merely due to common cyclic behavior.
Time series model building
Using the CCFs and clinical judgment to determine the appropriate leading/lagging relationship association between the influenza and COPD series, we formulated four time series regression models with autocorrelated errors. The errors were described using seasonal autoregressive integrated moving average (ARIMA) models. In each regression model, a COPD incidence series served as the response series and influenza activity served as the explanatory series. To better meet the assumption of stationarity, all of the series were log transformed, and a first-order seasonal difference was then applied to the log-transformed series.
Our time series regression models are summarized in . The concurrent relationship between COPD incidence and influenza activity is indicated by the CCFs for the four prewhitened series (Supplemental Figure S1). The CCFs exhibit strong statistically significant peaks at lag zero, indicating that there is an instantaneous correlation between time of COPD admission and influenza activity in the population, rather than a leading/lagging association between the two series. This is consistent with clinical judgment, which dictates that any elevation in the risk of COPD due to influenza would be expected to occur within the same month. All of the models feature an autoregressive component of order 1 (AR1), a moving average component of order 1 (MA1), and a seasonal moving average component of order 1 with a periodicity of 12 (SMA1). An autoregressive component of order 2 (AR2) is also contained in the models for COPD and AECOPD. These components were suggested by the autocorrelation function (ACF) and the partial autocorrelation function (PACF) for the residuals from a simple linear regression model fit to the response and explanatory series using ordinary least squares. By modeling the temporal patterns in the residuals, we reduce the standard errors and improve the sensitivity of the resulting inferential procedures. Failure to account for the autocorrelation in the residuals (i.e. with the autoregressive and moving average components) may lead to incorrect inferential conclusions. The final time series regression models, fit using maximum likelihood, showed no evidence of lack of fit, based on an inspection of the ACF and PACF for the residuals.
Table 1. Fitted time series regression models with the COPD incidence series as the response series and concurrent influenza activity as the explanatory series
Time Series Model Forecasting
To further confirm the contemporaneous association between each of the COPD series and influenza, we used the novel H1N1 pandemic as a natural experiment. In particular, we applied the existing time series models, fit using 1998–2008 data, to forecast monthly COPD admissions during 2009 and the first half of 2010. Note that this period includes the fall pandemic, which peaked in October, as well as the months preceding and following. Specifically, we investigated whether the inclusion of external influenza information would improve the forecasting accuracy of COPD admissions during the early H1N1 outbreak period. A one-step-ahead forecasting scheme was implemented in our experiment based on the models with and without influenza. Mean squared prediction errors (MSPEs) were employed to compare the forecasting performances of the two different time series models.
Measure of Attributable Risk of Influenza for COPD Admissions
To further quantify the burden of influenza activity on COPD incidence, we computed a measure of attributable risk of COPD admissions due to influenza. First, we found the peak influenza month during each 12-month period from July of one year to June of the following year. We then calculated the excess risk of COPD admissions related to influenza in the peak influenza month of each year by computing the difference between the average rate of admissions for COPD during all twelve months, representing the overall risk, and the average rate of admissions for COPD during the eleven non-peak months. The attributable risk for the year was then defined as a ratio of the excess risk to the overall risk. The final attributable risk measure was based on the average of the yearly ratios.
The attributable risk measure reflects the proportion of the overall incidence of COPD hospitalizations that could be potentially eliminated if influenza activity during the peak month could be reduced to the baseline level corresponding to the average over the eleven non-peak months. For example, a measure of 0.03 implies that 3% of annual COPD hospitalizations could be conceivably prevented if influenza during the annual peak month could be held to the baseline annual level.
Results
Time series modeling
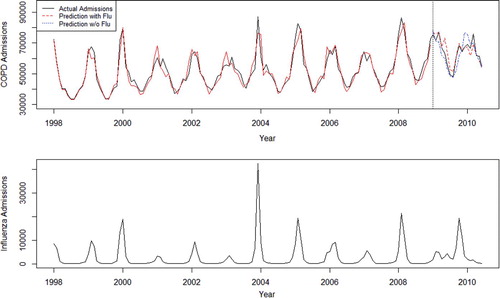
Using the CCF based on the prewhitened series, we found significant contemporaneous correlations between each of the COPD incidence series and influenza activity (Online Supplemental Figure S1). Our time series regression models, based on these contemporaneous correlations, indicate strong, significant associations between influenza and COPD, influenza and COPD requiring mechanical ventilation, influenza and AECOPD, and influenza and AECOPD requiring mechanical ventilation (all p-values < 0.0001) (). All other components incorporated into the final models were significant. This is likely due to additional autocorrelations and seasonal variations that were not fully explained by the influenza series. In all of our models, concurrent influenza activity significantly improves the prediction of COPD hospitalization incidence. When the influenza series is dropped from any model, we observed a considerable increase in the value of the Akaike information criterion, indicating the importance of influenza in predicting admissions for COPD. (For instance, the AIC for the overall COPD model with the influenza series is –279.06; the AIC for the model without the influenza series is –220.39. A difference of two is viewed as meaningful.) The overall COPD series, along with the fitted series based on the first model described in , is displayed in . Note that the model provides highly accurate fitted values of COPD incidence during the study period. Similarly, at a regional level, we observed a strong concurrent relationship between COPD series and influenza within each of the four different census regions (results not shown).
Figure 1. COPD admissions (upper panel) and influenza admissions (lower panel) by month from January 1998 to July 2010. In the upper panel, prior to 2009, the red series represents the fitted values based on the time series model with concurrent influenza activity as an explanatory variable. After 2009, the dotted red series represents forecasts of COPD admissions with influenza; the dotted blue series represents forecasts of COPD admissions without influenza.
Forecasting COPD admissions
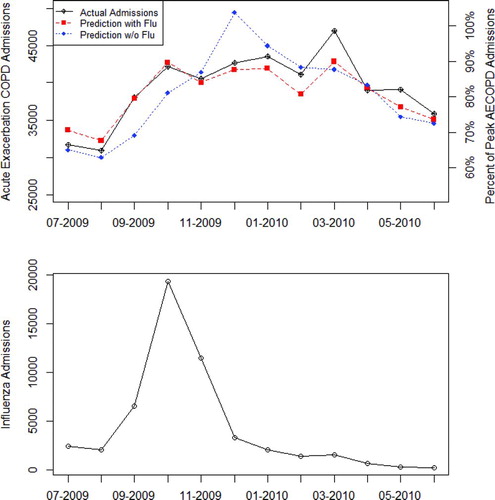
Both the actual COPD series and the fitted COPD series based on the 1998–2008 data, along with the two predicted COPD series with and without external influenza information in the 2009 influenza pandemic, are displayed in the upper panel of . The corresponding influenza incidence series is shown in the lower panel of . The inclusion of the external influenza information in the model greatly improves the forecasting performance of COPD admissions, especially in tracking the COPD admissions peak corresponding to the unusually early influenza outbreak in September and October 2009, and the subsequent COPD admissions pattern after the outbreak. shows the more detailed forecasting results regarding the early outbreak. As illustrated, prediction without the external influenza information fails to detect the early outbreak and continues to incorrectly track COPD admissions, since the forecasts exploit the seasonal memory where the peak usually happens in a typical winter month. A 29.9% reduction in MSPE was accomplished when our forecasting models used the external influenza information. Similar patterns were also found for the AECOPD series where we observed a 31.3% reduction in MSPE. Detailed forecasting results regarding AECOPD are shown in .
Figure 2. Time series forecast for the COPD admissions during July 2009 through June 2010. In the upper panel, the black series represents the actual COPD series; the dotted red series represents forecasts of COPD admissions with influenza and the dotted blue series represents forecasts of COPD admissions without influenza. The corresponding influenza series is shown in the lower panel. Importantly, the last 6 months of 2009 include the second wave of the 2009 influenza pandemic. Note: The right vertical axis represents monthly COPD admissions in terms of the percentage of peak monthly COPD admissions during the forecasting period. Thus, the peak month corresponds to 100%. For example, in December 2009, the forecasting error with influenza is roughly 1%, and the error without influenza is approximately 15% (where the percentage is relative to peak admissions during the forecasting period).
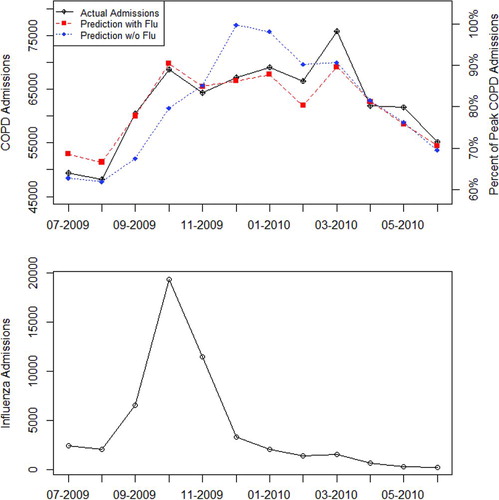
Figure 3. Time series forecast for AECOPD admissions during July 2009 through June 2010. In the upper panel, the black series represents the actual AECOPD series; the dotted red series represents forecasts of AECOPD admissions with influenza and the dotted blue series represents forecasts of AECOPD admissions without influenza. The corresponding influenza series is shown in the lower panel. Importantly, the last 6 months of 2009 include the second wave of the 2009 influenza pandemic. Note: The right vertical axis represents monthly AECOPD admissions in terms of the percentage of peak monthly AECOPD admissions during the forecasting period. Thus, the peak month corresponds to 100%. For example, in December 2009, the forecasting error with influenza is roughly 2–3%, and the error without influenza is approximately 15% (where the percentage is relative to peak admissions during the forecasting period).
Attributable risk of influenza for COPD admissions
The national COPD series were then partitioned into two age groups: under 65 and 65 and over. To characterize the national impact of influenza activity on COPD incidence, we calculated our attributable risk measure for each of the four COPD incidence series stratified by age group (). Note that the attributable risk measure of influenza activity on COPD incidence increases with age. The risk is also higher for patients admitted for AECOPD who are 65 years and older and elderly patients that require mechanical ventilation.
Table 2. Attributable risk measures by age group for the four COPD series
Discussion
Our results clearly show that the incidence of hospitalizations for COPD is significantly associated with influenza activity. Based on our attributable risk measure, this association is most prominent for patients admitted specifically for AECOPD, and for patients with COPD who are over 65 years of age. Among patients over 65 years of age, the association is strongest for those who require mechanical ventilation during the hospitalization. Our results also suggest that knowledge of concurrent influenza activity in the population can be used to substantially improve prediction of admissions due to COPD. Because the peak in pandemic influenza was not in a typical winter month, the natural experiment provided by this outbreak provides further evidence that influenza is a significant driver of COPD hospitalizations. Improvements in influenza surveillance, prevention, and treatment could provide significant opportunities to decrease the national burden of hospitalizations of patients with COPD.
Our findings further indicate that influenza surveillance is important in anticipating the need for mechanical ventilation in patients with COPD. Anticipating high, disproportionate, or cyclical increases in hospitalizations and mechanical ventilation may allow hospitals to more efficiently use equipment (ventilators, bilevel positive airway pressure machines), staffing (specialized nursing, respiratory therapists), and ward census (particularly with respect to intensive care units) based on influenza activity. At this time in the U.S., the most widely available surveillance data is at the state level, which can often be 1–2-weeks-old when it becomes available. However, novel surveillance methods using internet search queries through other forms of social media can also provide timely estimates, and perhaps, even forecasts of influenza activity (Citation11–14).
With more local and timely influenza activity reports, physicians can better target interventions for patients with COPD prior to hospitalization. For example, patients with COPD exacerbations could potentially benefit from early antiviral or anti-inflammatory treatment strategies. Oseltamivir is currently recommended for treatment of influenza in hospitalized patients (Citation15). The drug not only reduces viral load, but also may have an anti-inflammatory effect that could reduce severity of an exacerbation (Citation16). However, to be effective, it must be administered promptly within the first 48 hours of symptoms (Citation15). Thus, more timely information regarding influenza activity may help physicians target and aggressively diagnose and treat patients with COPD during the influenza season. In addition, randomized trials have shown that prior use of inhaled corticosteroids reduces hospitalizations in patients with frequent exacerbations, and similar findings have been shown for long-acting bronchodilators (Citation17–21). Overall, the impact of influenza on outcomes in patients with COPD warrants further research to define the exact pathological mechanisms in influenza-related flares in order to develop novel therapies that may alone, or in combination, reduce the severity of COPD hospitalizations during the influenza season.
Seasonal influenza vaccination is also effective in preventing influenza and appears to decrease the frequency of COPD exacerbations (Citation22–25). However, despite clear guidelines for routine influenza vaccination in patients with COPD, vaccination rates in the United States continue to be below the target rates of both the World Health Organization and the U.S. Public Health Service "Healthy People 2010" initiative for all age and risk groups (Citation26). Our results indicate that there is still a significant burden of COPD hospitalizations related to influenza. Our attributable risk measure indicates that if influenza activity in the peak month of the year alone could be decreased to the baseline level that occurs during the rest of the year, then approximately 3–5% of COPD hospitalizations per year (approximately 18,000–30,000) could potentially be avoided. Thus, our results provide further evidence for the importance of vaccinating patients with COPD against influenza.
Our study has several limitations. First, we use administrative data rather than clinical or microbiologic data for case ascertainment. ICD-9-CM codes have a reasonable sensitivity, specificity, and positive predictive value for detecting influenza (Citation27,28). For COPD, the sensitivity of the ICD-9-CM code may be less strong than specificity, and therefore, we may have missed some cases using our methods (Citation29). Second, other respiratory viral pathogens that we did not analyze may co-circulate during winter months, possibly contributing to COPD incidence. Third, our study is ecological. We used the aggregate incidence for each disease and did not study associations at the individual level; instead, we focused on influenza as an “environmental” risk factor. Although it would be ideal to have data showing that individual people actually had influenza immediately prior to their COPD hospitalization, we cannot directly infer this from hospital discharge data. Fourth, we do not consider temperature or humidity in our models. However, our results show strong associations between influenza and COPD admissions across different geographic regions in the United States. Last, because we do not know the percentage of patients with COPD and influenza who do not get hospitalized, we cannot calculate a traditional measure of attributable risk. However, we did calculate a modified risk value of COPD hospitalizations for the peak month of influenza each year as compared to the risk during the non-peak months. This is a conservative estimate, as it does not take into account the potential for eliminating influenza altogether, or even lessening the incidence over the eleven non-peak months.
Despite these limitations, we are able to explore the impact of influenza on COPD hospitalizations on a population level with a large sample size of hospitalized patients across the nation. Further, our study exploits the benefits of using a time series modeling framework and controls for spurious correlation induced by common seasonal patterns. This approach allows us to see the strong correlation in monthly variations of influenza and COPD admissions over a period of 11 years. Furthermore, the peak of the H1N1 influenza pandemic in 2009 allowed us to perform a natural experiment to confirm our associations and to test our prediction models, as the peak incidence was in October, rather than in the typical winter months.
In conclusion, our study found an association between hospitalization for COPD and influenza activity in the United States on a national level. The association is pronounced among older patients, particularly in those needing mechanical ventilation, and patients with acute exacerbations. Our results show that, despite guidelines for routine vaccination in patients with COPD, influenza continues to have a significant influence on patient outcomes and healthcare use. Further research is needed to prevent and treat influenza in patients with COPD. Finally, the use of improved surveillance and development of novel surveillance measures for influenza may help prevent, as well as forecast, hospital admissions.
Declaration of Interest Statement
The authors report no conflicts of interest. This work was supported in part by the National Institutes of Health, Grant 1KL2RR024980: Institute for Clinical and Translational Science, University of Iowa (AKG) and by a National Institutes of Health Career Investigator Award (Research Grant K01 AI75089) (PMP). The funding sources did not have involvement in the study design, data analysis, writing, or submission of the manuscript.
Acknowledgements
The authors would like to acknowledge Alejandro Comellas, M.D. for his review and suggestions in the preparation of this manuscript.
A supplemental figure is available in the online version of this article
References
- Hurd S. The impact of COPD on lung health worldwide: epidemiology and incidence. Chest 2000; 117:1S–4S.
- Toy EL, Gallagher KF, Stanley EL, Swensen AR, Duh MS. The economic impact of exacerbations of chronic obstructive pulmonary disease and exacerbation definition: a review. COPD 2010; 7:214–228.
- Halpern MT, Stanford RH, Borker R. The burden of COPD in the U.S.A.: results from the confronting COPD survey. Respir Med 2003; 97 Suppl C:S81–89.
- Wedzicha JA, Seemungal TA. COPD exacerbations: defining their cause and prevention. Lancet 2007; 370:786–796.
- Celli BR, MacNee W. Standards for the diagnosis and treatment of patients with COPD: a summary of the ATS/ERS position paper. Eur Respir J 2004; 23:932–946.
- MacIntyre N, Huang YC. Acute exacerbations and respiratory failure in chronic obstructive pulmonary disease. Proc Am Thorac Soc 2008; 5:530–535.
- Miravitlles M, Ferrer M, Pont A, Zalacain R, Alvarez-Sala JL, Masa F, Effect of exacerbations on quality of life in patients with chronic obstructive pulmonary disease: a 2 year follow up study. Thorax 2004; 59:387–395.
- Moineddin R, Nie JX, Domb G, Leong AM, Upshur RE. Seasonality of primary care utilization for respiratory diseases in Ontario: a time-series analysis. BMC Health Serv Res 2008; 8:160.
- HCUP Nationwide Inpatient Sample (NIS). Healthcare Cost and Utilization Project (HCUP) [Internet]. Rockville, MD: Agency for Healthcare Research and Quality, 1998–2010 [updated 2012 Sep 10; cited 2013 Jan 14]; Available from: www.hcup-us.ahrq.gov/nisoverview.jsp
- Cryer J. Time Series Analysis with Applications in R. New York: Springer, 2008.
- Polgreen PM, Chen Y, Pennock DM, Nelson FD. Using internet searches for influenza surveillance. Clin Infect Dis 2008; 47:1443–1448.
- Signorini A, Segre AM, Polgreen PM. The use of Twitter to track levels of disease activity and public concern in the U.S. during the influenza A H1N1 pandemic. PLoS One 2011; 6:e19467.
- Ginsberg J, Mohebbi MH, Patel RS, Brammer L, Smolinski MS, Brilliant L. Detecting influenza epidemics using search engine query data. Nature 2009; 457:1012–1014.
- Corley CD, Cook DJ, Mikler AR, Singh KP. Using web and social media for influenza surveillance. Adv Exp Med Biol 2010; 680:559–564.
- Mandell LA, Wunderink RG, Anzueto A, Bartlett JG, Campbell GD, Dean NC, Infectious Diseases Society of America/American Thoracic Society consensus guidelines on the management of community-acquired pneumonia in adults. Clin Infect Dis 2007; 44 Suppl 2:S27–72.
- Wong ZX, Jones JE, Anderson GP, Gualano RC. Oseltamivir treatment of mice before or after mild influenza infection reduced cellular and cytokine inflammation in the lung. Influenza Other Respi Viruses 2011; 5(5):343–350.
- Vincken W, van Noord JA, Greefhorst AP, Bantje TA, Kesten S, Korducki L, Improved health outcomes in patients with COPD during 1 yr's treatment with tiotropium. Eur Respir J 2002; 19:209–216.
- Casaburi R, Mahler DA, Jones PW, Wanner A, San PG, ZuWallack RL, A long-term evaluation of once-daily inhaled tiotropium in chronic obstructive pulmonary disease. Eur Respir J 2002; 19:217–224.
- Paggiaro PL, Vagaggini B, Di Franco A, Zingoni M, Fano M, Biraghi M. Efficacy of nebulized flunisolide combined with salbutamol and ipratropium bromide in stable patients with moderate-to-severe chronic obstructive pulmonary disease. Respiration 2006; 73:603–609.
- Calverley PM, Boonsawat W, Cseke Z, Zhong N, Peterson S, Olsson H. Maintenance therapy with budesonide and formoterol in chronic obstructive pulmonary disease. Eur Respir J 2003; 22:912–919.
- Brusasco V, Hodder R, Miravitlles M, Korducki L, Towse L, Kesten S. Health outcomes following treatment for six months with once daily tiotropium compared with twice daily salmeterol in patients with COPD. Thorax 2003; 58:399–404.
- Menon B, Gurnani M, Aggarwal B. Comparison of outpatient visits and hospitalisations, in patients with chronic obstructive pulmonary disease, before and after influenza vaccination. Int J Clin Pract 2008; 62:593–598.
- Poole PJ, Chacko E, Wood-Baker RW, Cates CJ. Influenza vaccine for patients with chronic obstructive pulmonary disease. Cochrane Database Syst Rev 2006 Jan;1:CD002733.
- Schembri S, Morant S, Winter JH, MacDonald TM. Influenza but not pneumococcal vaccination protects against all-cause mortality in patients with COPD. Thorax 2009; 64:567–572.
- Wongsurakiat P, Maranetra KN, Wasi C, Kositanont U, Dejsomritrutai W, Charoenratanakul S. Acute respiratory illness in patients with COPD and the effectiveness of influenza vaccination: a randomized controlled study. Chest 2004; 125:2011–2020.
- Monto AS. Seasonal influenza and vaccination coverage. Vaccine 2010; 28 Suppl 4:D33–44.
- Ginde AA, Tsai CL, Blanc PG, Camargo CA, Jr. Positive predictive value of ICD-9-CM codes to detect acute exacerbation of COPD in the emergency department. Jt Comm J Qual Patient Saf 2008; 34:678–680.
- Marsden-Haug N, Foster VB, Gould PL, Elbert E, Wang H, Pavlin JA. Code-based syndromic surveillance for influenzalike illness by International Classification of Diseases, Ninth Revision. Emerg Infect Dis 2007;13:207–216.
- Stein BD, Bautista A, Schumock GT, Lee TA, Charbeneau JT, Lauderdale DS, The validity of ICD-9-CM diagnosis codes for identifying patients hospitalized for COPD exacerbations. Chest 2012; 141(1):87–93.