
Abstract
Chronic Obstructive Pulmonary Disease (COPD) is a heterogeneous disease with a wide range of clinical phenotypes that vary from predominantly airway disease (chronic bronchitis) to predominantly parenchymal disease (emphysema). Current advances for the treatment of COPD are increasingly focused on targeted treatments and development of novel biomarker-based diagnostics (Dx)'s to select the patients most likely to benefit. Clinical trial planning and design with biomarkers includes additional considerations beyond those for conventional trials in un-selected populations, e.g., the heterogeneity of COPD phenotypes in the population, the ability of a biomarker to predict clinically meaningful phenotypes that are differentially associated with the response to a targeted treatment, and the data needed to make Go/No Go decisions during clinical development.
We developed the Clinical Trial Object Oriented Research Application (CTOORA), a computer-aided clinical trial simulator of COPD patient outcomes, to inform COPD trial planning with biomarkers. CTOORA provides serial projections of trial success for a range of hypothetical and plausible scenarios of interest. In the absence of data, CTOORA can identify characteristics of a biomarker-based Dx needed to provide a meaningful advantage when used in a clinical trial. We present a case study in which CTOORA is used to identify the scenarios for which a biomarker may be used successfully in clinical development. CTOORA is a tool for robust clinical trial planning with biomarkers, to guide early-to-late stage development that is positioned for success.
Keywords :
Introduction
Chronic Obstructive Pulmonary Disease (COPD) is a heterogenous diseases characterized by clinical phenotypes ranging from chronic bronchitis to emphysema (Citation1,2). COPD prevalence is rising globally and expected to dramatically impact world wide health care costs in the next decade (Citation3–6). GOLD staging guidelines outline the procedures for diagnosis of COPD and determination of disease progression (Citation7). COPD patients suffer from many of the symptoms as asthma patients, although they tend to be diagnosed later in life with a history of smoking.
COPD patients can experience exacerbations, episodes of reduced lung function and deterioration of quality of life, most commonly triggered by bacterial and viral infections (Citation7,8). Exacerbation frequency has been associated with accelerated lung function decline and co-morbidities (Citation1). For the patient suffering frequent and severe exacerbations that require hospitalization, there are limited treatment options to slow the disease progression. Treatment of exacerbations accounts for the greatest share of per patient year COPD health care cost (Citation3). Medical advances to segment the COPD patient population could potentially support development of targeted treatments (Citation9).
Segmentation of cellular inflammatory processes in airway diseases into four groups (i) neutrophilic, (ii) eosinophilic, (iii) neutrophilic and eosinophilic, and (iv) paucigranular, provides a framework for understanding the underlying biology driving these processes in asthma (Citation10). Historically, COPD has been characterized as a having a predominantly neutrophilic cellular inflammatory response. However, recent studies have demonstrated that a subset of individuals may have eosinophilic airway inflammation when clinically stable (Citation11,12) that is more likely in GOLD stages III–IV (Citation13), as well as during exacerbations (Citation14).
Estimates of the percentage of exacerbations with an eosinophilic inflammatory cell profile range from 17%–28% (Citation14,15). A longitudinal study of sputum cytology in COPD has revealed that in most cases the cellular inflammatory response is relatively stable although it is possible an individual patient could experience multiple exacerbations associated with different inflammatory cell profiles. Even more recent attempts to stratify COPD into 4 distinct acute exacerbation biological clusters revealed that COPD patients may share characteristics of more than one cluster (Citation15).
Assessment of the cellular inflammatory phenotype in COPD appears to translate into meaningful clinical benefits. COPD patients with increased sputum eosinophil percentages have a more robust clinical response to inhaled and oral corticosteroids (12, 16,17). These findings have also been replicated in subjects with COPD/Asthma overlap syndrome (Citation18). Current methodologies to accurately determine airway inflammatory phenotypes are either invasive (airway biopsy, bronchial alveolar lavage) or impractical (induced sputum cytology) in routine clinical practice. A recent study by Bafadehl and colleagues in COPD patients demonstrated the utility of using blood eosinophil percentage >2% as a biomarker to predict clinical response to prednisone (Citation14), or exhaled FENO predicting sputum eosinophilia in COPD (Citation19), suggesting that biomarkers for eosinophilic airway in COPD may be on the horizon.
Integrating a biomarker into COPD drug development holds the possibility of great reward, but is not without challenges and risks. Defining the clinical target COPD patient population that would most likely benefit from an anti-inflammatory targeted treatment is challenging, given the complexity of cellular inflammatory phenotypes in COPD, the potential overlap between types, and the complex mechanisms of a targeted drug. Variability in the categorization of a phenotype overtime and the overall responsiveness and accuracy of a biomarker underscores some major hurdles associated with targeting COPD sub-groups.
From a clinical perspective, for example, targeting the two predominant inflammatory cellular phenotypes (neutrophils and eosinophils) by neutralizing increased levels of GM-CSF in the airway could result in a beneficial response (Citation20). However, in asthma only selective therapies targeting eosinophilic inflammation have been successful to date (Citation21,22). Despite disproportionate progress and the remaining uncertainty, tools that could help to better inform early-to-late stage planning decisions in a context of simulated scenarios would be beneficial for integrating a biomarker into COPD drug development.
Clinical trial simulation of targeted intervention trials with a biomarker over a collection of relevant scenarios can portray how early planning can impact late-stage opportunities and success, such as the possible advantages of a biomarker. The three critical parameters we focus on here are the COPD clinical phenotypes and their prevalences, the performance of the biomarker-based Dx to predict clinically relevant COPD phenotypes, and the differential clinical response to a targeted treatment by phenotype or surrogate for phenotype.
Because in practice these parameters are learned with uncertainty, advanced computational tools are used to ascertain the consequences of early-to-late stage decision criteria over a collection of relevant scenarios (Citation23,24). Simulations are not a substitute for independently replicated credible scientific study. This critical work is a precursor to clinic testing, and parallel efforts should be monitored closely during clinical development. Amid early-to-late phase clinical trial investigation, measures of belief about uncertain target populations and biomarkers can be specified to formulate projections about future success, though; beliefs can differ widely and change. A well constructed and executed simulation plan renders the backdrop to efficiently explore adaptations to beliefs, as new evidence emerges.
We developed the Clinical Trial Object Oriented Research Application (CTOORA), a COPD clinical trial simulator, to investigate when a biomarker is attractive for drug development. The COPD trial simulator is described; a simulation case study was developed to demonstrate CTOORA, which is also outlined. We next offer the in-depth results of the case study, of the factors leading to improved overall success probability with a biomarker, and we summarize the implications for clinical development. Finally, we address challenges and limitations that lie ahead.
Method
Modeling COPD patient outcomes
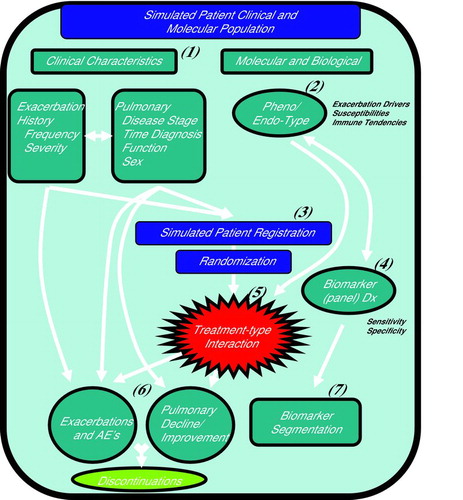
We developed CTOORA, a computer-aided model, to simulate COPD patient outcomes and investigate when a biomarker is advantageous for targeted drug development. CTOORA is a hierarchical longitudinal model composed of a collection of modules for simulating COPD patient experiences during enrollment and follow up on a clinical trial (Diagram ). CTOORA takes (i) clinical input features, e.g. rates of disease progression, heterogeneity in pulmonary function, and exacerbation history, (ii) biological characteristics, e.g. the prevalences of clinical phenotypes, sensitivity and specificity of a biomarker-based Dx to predict phenotype, and (iii) the differential clinical responses to a targeted treatment in each phenotype. Simulated COPD patients with diverse clinical histories and biological tendencies are registered on a simulated trial with a mock protocol, and randomized to treatment arms (Citation25,26).
Diagram 1. CTOORA: (Citation1) Clinical characteristics simulated from a COPD population, with dependencies between exacerbation history and disease progression, (Citation2) Two patient molecular types are simulated given assumed prevalence, (Citation3) Simulated patients are registered according to a mock protocol, and randomized to treatment arms, (Citation4) Biomarker (panel) Dx test is performed, to predict patient molecular type (Citation2), (Citation5) Simulated targeted treatment effect differential by patient molecular type (Citation2), (Citation6) Simulated clinical outcomes given patient histories, treatment, and molecular-type. (Citation7) Biomarker segmentation (assay) merged to clinical outcomes.
The simulated COPD patients experience exacerbations, adverse events, and changes in pulmonary function during the trial, depending on phenotype and treatment arm (Citation27,28). Discontinuations are modeled as a random process, based on disease progression and adverse events (Citation29). Clinical and biomarker endpoints are collected at interim time points, and at the conclusion of the simulation trial. This is repeated for a desired number of ‘replicate’ trials in order to evaluate the trial performance at meeting endpoints, estimating population parameters, or learning about the COPD population to a desired level of accuracy (Citation30).
Simulation plan
We simulated a sequence of early-to-late phase COPD clinical trials of a targeted treatment compared to standard of care (SOC) in a moderate to severe COPD patient population to answer the question when is a biomarker advantageous? The primary endpoint was exacerbations, testing for a reduction in the rate of exacerbations per year (RRE) from a baseline mean of 1.5 exacerbations per year (Citation31,32). We simulated COPD phenotypes, treatment responses by phenotype, and a biomarker with the ability to segment phenotypes to evaluate how: (i) treatment response, (ii) early phase study size, (ii) choice of biomarker-based Dx test sensitivity, and (iv) the ability of the biomarker to predict phenotype impacted the probability to adopt a biomarker in Phase III and consequently the overall probability of late-stage success.
The first in the sequence of simulated trials was a Phase IIb all comers two-arm trial, followed by the decision to proceed to Phase III without a biomarker, with a biomarker, or discontinue, as illustrated in Diagram . We assumed at the outset of Phase IIb that: (i) dose selection had been completed, (ii) the biological validity of a known phenotype had been established for drug development, and (iii) that a biomarker predictive of phenotype was available, though, the clinical validity of the biomarker had not been tested (identification of a phenotype and biomarker are early scientific goals, that we did not simulate). Upon completion of each simulated Phase IIb trial, the RRE was tested in the full cohort of each of the simulated Phase IIb trials, followed by testing in the biomarker-based Dx test positive and negative segments as exploratory endpoints. Development continued to Phase III without a biomarker if a significant RRE was detected in the whole simulated COPD cohort, or to enrich for Dx test positive subjects if a significant RRE was confined to the Dx test positive patients (not as a formal recommendation, but rather for simplicity to demonstrate our simulations). We estimated the decision probabilities to proceed to Phase III without a biomarker, to enrich, or to stop development over 5,000 simulated Phase IIb trial iterations (Diagram ).
Diagram 2. Simulation Plan: Phase IIb trial simulated for study size, RRE, biomarker Dx cutoffs, and COPD phenotype prevalences. At the end of Phase IIb the Go/No Go decision made to pursue Phase III without a biomarker, with a biomarker (enrichment), or discontinue. The overall probability of Phase III success is weighted by the respective end of Phase IIb decision probabilities. Decision and success probabilities estimated from 5,000 simulated trial sequences.
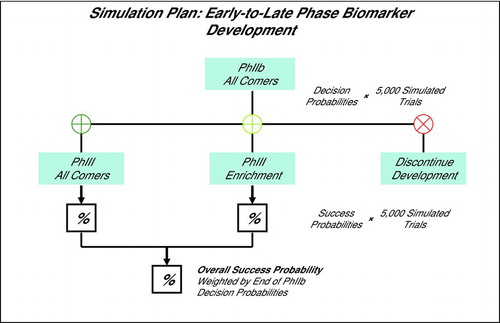
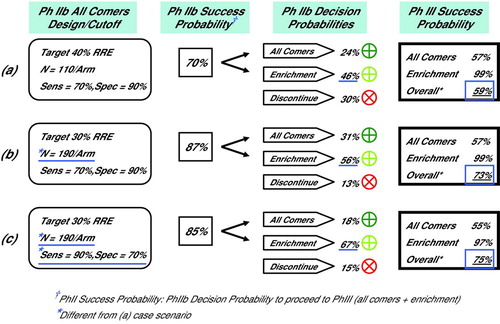
Diagram 3. Selected Simulation Results, Phase IIb Decision and Phase III Success Probabilities (a) Phase IIb simulated with N = 110 subjects per arm and biomarker Dx test sensitivity of 70%. There was a 46% probability of enriching with a biomarker in Phase III, and a 59% overall probability of Phase III success. (b) Increasing Phase IIb study size to N = 190 subjects per arm increased probability of enriching with biomarker in Phase III to 56%, and overall probability of Phase III success to 73%. (c) As in (b) although with increased Dx test sensitivity of 90%. Probability of enriching with biomarker in Phase III increased to 67%, while the overall probability of Phase III success of 75% was negligible from (b) at 73%.
The probability of Phase IIb success was calculated as the probability to continue to Phase III. Phase III success was defined as significant RRE's in two independent trials, for all comers or enrichment designs. The overall probability of Phase III success was defined as the weighted average probability of success of all comers and enrichment trials, weighted by the respective end of Phase IIb decision probabilities, to pursue either design in Phase III, as illustrated in Diagram and described in the Supplement. Across the many scenarios that we simulated, we considered the biomarker advantageous if the option to adopt a biomarker and enrich in Phase III raised the overall probability of late stage success ≥70%.
COPD patients were simulated as one of two phenotypes, arbitrarily labeled A and B, that responded differently to a targeted treatment. These labels are hypothetical; though should represent a meaningful clinical phenotype: A of a COPD population with the targeted inflammatory cell profile at exacerbation, and B of those without the inflammatory response. The eosinophilic phenotype we discussed in the Introduction (Citation14, Citation19) has gained attention, although, for the purposes of our simulation model, could be defined based on other immunotypes of interest.
This simple and flexible modeling approach can capture many possible clinical associations between patient molecular characteristics and treatment response. The variability can be extended in treatment response or by specifying broader patient heterogeneity. For example, in this study phenotype A subjects had an 80% chance of receiving a clinical benefit from the targeted treatment, and phenotype B a 10% chance. The prevalence of phenotype A in the COPD population was simulated as 30%, 40%, or 50% (phenotype B as one minus the prevalence of phenotype A). We simulated a biomarker-based Dx predictive of phenotype. A subject with a Dx positive test result at screening was predicted to have phenotype A and a Dx negative test to have phenotype B. The Dx test was simulated with different sensitivities and specificities (Citation33) to investigate the impact on the decision to adopt a biomarker and plan an enrichment design for Phase III, and consequently the probability of overall pivotal trial success, see the Supplemental material.
Results
Simulating treatment response
Initially, in our base case scenarios we fixed the RRE = 25% to the targeted drug in the simulated Phase IIb all comers population. We assumed that the clinical efficacy was never worse than SOC despite phenotype differences, so a simulated patient either responded more favorably to the targeted treatment than SOC or not, but symptoms were not aggravated by the targeted treatment (we return to address this assumption in the Discussion). Fixing the RRE at 25% meant that the RRE among the Dx test positive subjects varied, ranging from 30%−55%, depending on phenotype prevalences and Dx test sensitivity, listed in .
Table 1. Simulated Phase IIb Decision and Phase III Success Probabilities with a Biomarker, RRE = 25% to Targeted Treatment in the All Comers Population
The option to enrich with a biomarker-based Dx in Phase III increased the overall probability of late stage success more or less depending on many simulated factors, in particular the Phase IIb study size. For instance, increasing the Phase IIb study size from N = 110 to N = 190 subjects per arm increased the chances of enrichment with the biomarker-based Dx in Phase III, and markedly increased the overall probability of late stage success to between 72%−75% from 55%−60%, see and .
We repeated the simulations, fixing the RRE to the targeted drug in the Phase IIb all comers population at 20%, . The overall probabilities for late-stage success were <50% for most scenarios ranging from 32%−57% with N ≤ 190 subjects per arm. A study size of N = 190 subjects per arm was insufficient to raise the chances of enrichment in Phase III to >57%.
Table 2. Simulated Phase IIb Decision and Phase III Success Probabilities with a Biomarker, RRE = 20% to Targeted Treatment in the All Comers Population
CTS showed that the biomarker was helpful when the RRE in the simulated COPD population was moderate, a grey zone for decision making. In our simulations we fixed the RRE in the simulated COPD Phase IIb all comers population to the targeted treatment. Had we fixed the RRE in the Dx test positive and negative segments, the phenotype prevalence would have appeared to play a larger role in overall success, although, the factors leading to the probability of overall success would have been less clear.
Early phase study size
The effect of increasing the Phase IIb study size was positive for biomarker adoption and late-stage success. Phase IIb stopping rates were relatively high with N = 110 subjects per arm, ≥28% for a RRE = 25% and ≥43% for a RRE = 20%, Tables and . Increasing the study size from N = 110 to N = 140 subjects per arm moderately increased the probability of adopting a biomarker and enriching in Phase III from between 44%−51% to 49%−58%, . Inflating the study size N = 190 subjects per arm was sufficient to raise the probability of enriching with a biomarker in Phase III to between 55%−68% and consequently the overall probability of Phase III success to 72%−75%. This was not the case for a poorer RRE in . A more than doubling of the study size to N = 285 subjects per arm was needed to elevate the probability of adopting the biomarker well above 50%.
Choice of biomarker-based Dx sensitivity
We investigated how the choice of biomarker-based Dx test sensitivity impacted Phase IIb and overall success. In practice the Dx test sensitivity is known only up to a margin of error. We recommend simulating a range of Dx test performances to ascertain the consequences for late-stage success. See the supplement for background on Dx test sensitivity, specificity, positive predictive value (PPV), and negative predictive value (NPV), and the relationships between these quantities.
In the simulation scenarios that we ran, increasing the Dx test sensitivity increased the chance of a Dx positive test result and consequently the power to detect a significant RRE among Dx test positive subjects in Phase IIb. This increased the chance of adopting the biomarker and enriching in Phase III. Notice though, that increasing the Dx test sensitivity lowered the PPV of the Dx test, and thereby reduced the probability of Phase III enrichment success from 99% to 94%, for RRE = 25% in the simulated all comers population, . The reduction was more pronounced for a poorer RRE, .
For example, at N = 190 subjects per arm, 40% phenotype A prevalence, and a Dx test sensitivity of 70%, the overall probability of Phase III success was 73%, and . Increasing the Dx test sensitivity to 90% elevated the probability of enriching with the biomarker in Phase III to 67% from 56%, while the difference in the overall probability of success, 75%, was negligible. Note also that the NPV was raised to 91% from 82%, meaning half as many simulated patients that would have been denied access to the targeted drug had the target phenotype. A larger sensitivity of 95% (specificity of 55%) yielded similar overall pivotal study success, though tended to increase the chance of a Dx positive test result to greater than 65%.
Simulating a less predictive biomarker
We simulated a Dx test less predictive of phenotype, with a poorer trade off in sensitivity and specificity, listed in . Inflating the Phase IIb study size to N = 190 subjects per arm was not sufficient to raise the probability of enriching with the biomarker in Phase III above 55%, or the overall probability of Phase III success above 64%. A Phase IIb study size of N = 285 subjects per arm was needed to elevate the overall probability of success with the biomarker option to between 67%−71%.
Table 3. Simulated Phase IIb Decision and Phase III Success Probabilities with a Biomarker, RRE = 25% to Targeted Treatment in the All Comers Population with Reduced Sensitivity and Specificity
Discussion
The option to pursue drug development with a biomarker-based diagnostic is exciting for drug development and health care, as well as risky. The factors leading to overall success with a biomarker can be unfamiliar or confusing. Early phase biomarker decisions can be tested in a simulation framework, to support crucial decisions, before the next trial begins enrollment. Absent a better understanding of the consequences, the advantages of biomarkers may not be realized. In the case study we simulated, there was a narrow window in treatment response for which a biomarker was advantageous. Phase IIb study designs with high stopping rates, or modest probabilities to adopt a biomarker, faired poorer. Although PPV is an important criterion for biomarker-based Dx development, actually increasing the Dx test sensitivity while modestly reducing the PPV increased the probability that a biomarker would be adopted for Phase III, while not compromising the overall probability of Phase III success. Moreover, a biomarker with an apparent robust association with phenotype, , was not helpful for COPD targeted drug development, absent a sizable investment in the Phase IIb study size.
Clinical trials have grown more complex in addressing clinical and scientific questions, while financial requirements and competition are driving cycle time reductions. The decision to enrich with a molecular based Dx is complicated by many temporal factors beyond those simulated here such as analytical diagnostic validation, processing screen failures during trial registration, and regulatory approval. These steps lead to delays in cycle times and regulatory approval, and can add appreciably to the costs and risks of diagnostic development (Citation34). These and many other considerations have been modeled in a simulation framework, differing in scope and complexity on a case-by-case basis (Citation35), though not specifically for clinical trials of targeted treatments for COPD with biomarkers.
In our simulations we assumed that when the drug was not efficacious, it was not worse than standard of care. Serious adverse events (AE) of an acute nature raise concerns about treatment in a broader population. If a patient segment could be identified with a higher risk of serious AE, it could make the drug safer. The rarity of serious AEs makes it difficult to predict and challenging to model, on a case-by-case basis. This as well as ongoing work to validate and extend CTOORA to aid in COPD biomarker-based Dx development is the topic of future work.
CTOORA is an advanced tool to support innovative drug development with biomarkers. In the absence of data or experience, CTOORA can aid in trial interpretation and point to robust strategies that increase the odds of future success and avoid undesirable outcomes (Citation24). We recommend applications like CTOORA for clinical development of companion biomarker-based Dx's in conjunction with targeted treatments in COPD.
Declaration of Interest Statement
The authors report no conflicts of interest. The authors alone are responsible for the content and writing of the paper. The views of the authors are solely their own and do not necessarily reflect the views of MedImmune/AstraZeneca.
References
- Barnes PJ, Celli BR. Systemic manifestations and comorbidities of COPD. Eur Respir J 2009; 33(5):1165–1185.
- Allen-Ramey FC, Gupta S, DiBonaventura MD, Patient characteristics, treatment patterns, and health outcomes among COPD phenotypes. Int J Chron Obstruct Pulmon Dis 2012; 7:779–787.
- Toy EL, Gallagher KF, Stanley EL, Swensen AR, Duh MS. The economic impact of exacerbations of chronic obstructive pulmonary disease and exacerbation definition: a review. COPD 2010; 7(3):214–228.
- Mannino DM, Buist AS. Global burden of COPD: risk factors, prevalence, and future trends. Lancet 2007; 370(9589):765–773.
- Lopez AD, Shibuya K, Rao C, Mathers CD, Hansell AL, Held LS, Schmid V, Buist S. Chronic obstructive pulmonary disease: current burden and future projections. Eur Respir J 2006; 27:397–412.
- Richard Russell R, Anzueto A, Weisman I. Optimizing management of chronic obstructive pulmonary disease in the upcoming decade. Int J Chron Obstruct Pulmon Dis 2011; 6:47–61.
- Vestbo J, Hurd SS, Agusti AG, Jones PW, Vogelmeier C, Anzueto A, Global Strategy for the Diagnosis, Management and Prevention of Chronic Obstructive Pulmonary Disease, GOLD Executive Summary. Am J Respir Crit Care Med 2012; Epub ahead of print.
- Gómez FP, Rodriguez-Roisin R. Global Initiative for Chronic Obstructive Lung Disease (GOLD) guidelines for chronic obstructive pulmonary disease. Curr Opin Pulm Med 2002; 8(2):81–86.
- Silverman EK, Vestbo J, Agusti A, Anderson W, Bakke PS, Barnes KC, Opportunities and challenges in the genetics of COPD 2010: an International COPD Genetics Conference report. COPD 2011; 8(2):121–135.
- Simpson JL, Scott R, Boyle MJ, Gibson PG. Inflammatory subtypes in asthma: assessment and identification using induced sputum. Respirology 2006; 11(1):54–61.
- Saha S, Brightling CE. Eosinophilic airway inflammation in COPD. Int J Chron Obstruct Pulmon Dis 2006; 1(1):39–47.
- Siva R, Green RH, Brightling CE, Shelley M, Hargadon B, McKenna S, Eosinophilic airway inflammation and exacerbations of COPD: a randomised controlled trial. Eur Respir J 2007; 29(5):906–913.
- Bafadhel M, McCormick M, Saha S, McKenna S, Shelley M, Hargadon B, Profiling of sputum inflammatory mediators in asthma and chronic obstructive pulmonary disease. Respiration 2012; 83(1):36–44.
- Bafadhel M, McKenna S, Terry S, Mistry V, Pancholi M, Venge P, Blood eosinophils to direct corticosteroid treatment of exacerbations of chronic obstructive pulmonary disease: a randomized placebo-controlled trial. Am J Respir Crit Care Med 2012; 186(1):48–55.
- Bafadhel M, McKenna S, Terry S, Mistry V, Reid C, Haldar P, Acute exacerbations of chronic obstructive pulmonary disease: identification of biologic clusters and their biomarkers. Am J Respir Crit Care Med 2011: 184(6):662–671.
- Brightling CE, Monteiro W, Ward R, Sputum eosinophilia and short-term response to prednisolone in chronic obstructive pulmonary disease: a randomized controlled trial. Lancet 2000; 356:1480–1485.
- Leigh R, Pizzichini MMM, Morris MM, Maltais F, Hargreave FE, Pizzichini E. Stable COPD: predicting benefit from high-dose inhaled corticosteroid treatment. Euro Resp Journ 2006; 27(5):946–971.
- Kitaguchi Y, Komatsu Y, Fujimoto K, Hanaoka M, Kubo K. Sputum eosinophilia can predict responsiveness to inhaled corticosteroid treatment in patients with overlap syndrome of COPD and asthma. Int Journ of Chron Obstr Pul Dis 2012; 7:283–289.
- Soter S, Barta I, Antus B. Predicting sputum eosinophilia in exacerbations of COPD using exhaled nitric oxide. Inflammation 2013; Epub: 10.1007/s10753–013–9653–8.
- Saha S, Doe C, Mistry V, Siddiqui S, Parker D, Sleeman M, Cohen ES, Brightling CE. Granulocyte–macrophage colony-stimulating factor expression in induced sputum and bronchial mucosa in asthma and COPD. Thorax 2009; 64(8):671–676.
- Pavord ID, Korn S, Howarth P, Bleecker ER, Buhl R, Keene ON, Ortega H, Chanez P. Mepolizumab for severe eosinophilic asthma (DREAM): a multicentre, double-blind, placebo-controlled trial. Lancet 2012; 380(9842):651–659.
- Castro M, Mathur S, Hargreave F, Boulet LP, Xie F, Young J, Wilkins HJ, Henkel T, Nair P. Reslizumab for poorly controlled, eosinophilic asthma: a randomized, placebo-controlled study. Am J Respir Crit Care Med 2011; 184(10):1125–1132.
- Holford N, Ma SC, Ploeger BA. Clinical trial simulation: a review. Clin Pharmacol Ther 2010; 88(2):166–182.
- Girard P. Clinical trial simulation: a tool for understanding study failures and preventing them. Basic Clin Pharmacol Toxicol 2005; 96(3):228–234.
- Eddy DM, Schlessinger L.Validation of the Archimedes diabetes model. Diabetes Care 2003;26(11):3102–3110.
- Weinstein MC, O'Brien B, Hornberger J, Jackson J, Johannesson M, McCabe C, Principles of good practice for decision analytic modeling in health-care evaluation: report of the ISPOR Task Force on Good Research Practices–Modeling Studies. Value Health 2003; 6(1):9–17.
- Hurst JR, Vestbo J, Anzueto A, Locantore N, Müllerova H, Tal-Singer R, Susceptibility to exacerbation in chronic obstructive pulmonary disease. Evaluation of COPD Longitudinally to Identify Predictive Surrogate Endpoints (ECLIPSE) Investigators. N Engl J Med 2010; 363(12):1128–1138.
- Magda S. Susceptibility to exacerbation in chronic obstructive pulmonary disease - Data from the ECLIPSE study. Maedica 2010; 5(3):223–224.
- Westfall PH, Tsai K, Ogenstad S, Tomoiaga A, Moseley S, Lu Y. Clinical Trials Simulation: A Statistical Approach. J Biopharm Stat 2008; 18:611–630.
- Casella G, Berger RL. Statistical Inference.. Chapter 5 Properties of a Random Sample. Belmont (CA): Duxbury Press; 1990: 201–235.
- Vogelmeier C, Ramos-Barbon D, Jack D, Piggott S, Owen R, Higgins M, Indacaterol provides 24-hour bronchodilation in COPD: a placebo-controlled blinded comparison with tiotropium. Respir Res 2010; 11:135.
- Calverley PMA, Rabe KF, Goehring UM, Kristiansen S, Fabbri LM, Martinez FJ. Roflumilast in symptomatic chronic obstructive pulmonary disease: two randomised clinical trials. Lancet 2009; 374(9691):685–694.
- Pepe S. The Statistical Evaluation of Medical Tests For Classification and Prediction: Oxford Statistical Science Series 28. New York: Oxford University Press; c2003. Ch 2, Measures of accuracy for binary tests; p. 14–34.
- Trusheim MR, Burgess B, Hu SX, Long T, Averbuch SD, Flynn AA, Quantifying factors for the success of stratified medicine. Nat Rev Drug Discov 2011; 10(11):817–833.
- Lalonde RL, Kowalski KG, Hutmacher MM, Ewy W, Nichols DJ, Milligan PA, Model-based drug development. Clin Pharmacol Ther 2007; 82(1):21–32.