Abstract
Intercellular Ca2 + wave propagation between vascular smooth muscle cells (SMCs) is associated with the propagation of contraction along the vessel. Here, we characterize the involvement of gap junctions (GJs) in Ca2 + wave propagation between SMCs at the cellular level. Gap junctional communication was assessed by the propagation of intercellular Ca2 + waves and the transfer of Lucifer Yellow in A7r5 cells, primary rat mesenteric SMCs (pSMCs), and 6B5N cells, a clone of A7r5 cells expressing higher connexin43 (Cx43) to Cx40 ratio. Mechanical stimulation induced an intracellular Ca2 + wave in pSMC and 6B5N cells that propagated to neighboring cells, whereas Ca2 + waves in A7r5 cells failed to progress to neighboring cells. We demonstrate that Cx43 forms the functional GJs that are involved in mediating intercellular Ca2 + waves and that co-expression of Cx40 with Cx43, depending on their expression ratio, may interfere with Cx43 GJ formation, thus altering junctional communication.
Keywords::
Introduction
Coordinated contraction and relaxation of smooth muscle cells (SMCs) in the arterial wall play a key role in the control of hemodynamics. The contractile state of SMCs is caused by an increase in the cytosolic calcium concentration ([Ca2 +]i) in response to vasoconstrictors or neurotransmitters (CitationBerridge, 2008; CitationOishi ET AL., 2001). An increase in [Ca2 +]i may result from Ca2 + influx across the plasma membrane and/or Ca2 + -release from internal stores (e.g., sarcoplasmic reticulum). It has been shown that the increase in [Ca2 +]i can progress as a concentration gradient throughout a cell and can propagate to neighboring cells as an intercellular Ca2 + wave (CitationSchuster ET AL., 2001; CitationSegal ET AL., 1989; CitationSeppey ET AL., 2010; CitationYashiro & Duling, 2003). The mechanisms underlying intercellular Ca2 + wave propagation in SMCs, however, are still elusive.
Intercellular Ca2 +waves have been shown to be mediated through gap junction channels (GJs). GJs are assemblies of cell–cell channels, where each channel is formed by docking of two hemichannels (connexins) located in opposing cell membranes (CitationEvans ET AL., 2006). GJs permit the passage of ions and small molecules including Ca2 + , inositol 1,4,5-trisphosphate (IP3), ATP, and glucose (CitationHarris, 2007). One of the most prominent connexin (Cx) isoforms expressed in vascular SMCs is Connexin43 (Cx43) (CitationChrist ET AL., 1992; CitationSáez ET AL., 2003), classified according to their molecular weight in kDa. The amount and type of Cxs expressed are tissue and cell type specific. Some, but not all SMCs have been shown to co-express Cx43 and Cx40 (CitationGustafsson ET AL., 2003; CitationKanagaratnam ET AL., 2002; CitationVan Kempen & Jongsma, 1999). One of the consequences of Cx43 and Cx40 co-expression is the formation of GJs and channels with mixed connexin composition. Such GJs display distinct permeability and selectivity properties than those composed of a single Cx isoform (CitationBurt ET AL., 2001; CitationGoldberg ET AL., 2004; CitationHarris, 2007; CitationHeyman ET AL., 2009; CitationKanaporis ET AL., 2008). The physiological consequences of such co-expression have not been thoroughly explored.
To study the mechanisms of intercellular Ca2 + signal transmission from one cell to another via GJs, we chose to perform experiments using A7r5 cells, a rat aortic SMC line that has been well characterized and extensively used for studying calcium homeostasis in vascular smooth muscles (CitationBlatter & Wier, 1992; CitationByron, 1996; CitationMoore ET AL., 1991; CitationRüegg ET AL., 1985). Local mechanical stimulation induced a Ca2 + wave in the stimulated A7r5 cell, but the Ca2 + wave did not propagate to adjacent cells. In contrast, in primary cultured rat mesenteric smooth muscle cells (pSMCs), local mechanical stimulation of one pSMC evoked an increase in [Ca2 +]i that propagated to neighboring pSMCs. These cells are derived from the same tissue in which Ca2 + wave propagation was observed in arterial segments (CitationSeppey ET AL., 2010).
We have recently shown the mechanisms by which Ca2 + waves propagate between pSMCs (CitationHalidi ET AL., 2011). Here, the aim of this work was to understand the reason(s) behind the difference in cell–cell communication between A7r5 and pSMCs. Since some studies, but not all, have shown that Ca2 + waves are mediated through GJs composed of Cx43 (CitationCharles ET AL., 1992; CitationPaemeleire ET AL., 2000; CitationToyofuku ET AL., 1998), we hypothesized that Ca2 + waves in pSMCs are also mediated through Cx43 GJs. Also, A7r5 cells are known to co-express Cx43 and Cx40 (CitationMoore ET AL., 1991), but there are no results concerning the expression of these proteins in pSMCs. For this purpose, we examined these cells for expression of the connexin isoforms: Cx40 and Cx43. To validate our hypothesis that Cx43 GJs are primarily involved in the propagation of Ca2 + waves in pSMCs, and better understand the functional consequences of co-expression of Cx43 and Cx40 at different ratios, we used 6B5N cells, a clone of A7r5 cells with an elevated Cx43:Cx40 protein expression ratio (CitationBurt ET AL., 2001). Our results demonstrate that Cx43 GJs are primarily responsible for mediating intercellular Ca2 + waves between primary cultured mesenteric SMCs and the co-expression of Cx43 and Cx40 may interfere in clustering of Cx43 into gap junction plaques, affecting cell–cell communication.
Materials and methods
Explant preparation and cell culture
Male Wistar rats (300 ± 50 g) were anesthetized with isoflurane (4%) and then decapitated in agreement with the Care of Animals (edited by the Swiss Academy of Medical Sciences and the Helvetic Society of Natural Sciences). All experiments performed on rat mesenteric arteries were approved by the Cantonal Veterinary Office (authorization no. 1799.1) in agreement with the law on animal protection in Switzerland. Explants from the mesenteric arcade were prepared as previously described in CitationFormey ET AL. (2011) and CitationHalidi ET AL. (2011) and cultured for 10–12 days. The purity of the primary cultured mesenteric artery smooth muscle cell cultures was verified by positive staining with smooth muscle specific alpha-actin and with desmin (data not shown). A7r5 cells were obtained from American Type Culture Collection and were used up to passage 15. 6B5N cells are a clone of the A7r5 cell line with higher Cx43:Cx40 expression ratio transfected as shown previously (CitationBurt ET AL., 2001). The same culture medium was used for all three cell types. For 6B5N cells, culture medium was supplemented with neomycin. For experiments, cells were trypsinized and seeded on ibidi coverslips (Ibidi GmbH, Martinsried, Germany) or 35 mm diameter petri dishes and cultured for 2 days.
Calcium imaging
A7r5, pSMCs and 6B5N cells were loaded for 40–50 minutes at room temperature in physiological solution containing 10 μM Fluo-4 AM in the presence of 2.5% pluronic F-127 (both from Molecular Probes) and subsequently washed for 30 minutes with physiological solution for deesterification. Experiments were performed with a Nikon (Tokyo, Japan) Eclipse TE300 inverted microscope and 40 ×, NA 1 objective lens. Data were acquired with a Micromax PB1300 and a Micromax 512FT cooled charge-coupled device cameras (Roper Scientific, Trenton, NJ) controlled by Metamorph software. Fluo-4 was excited at 488 nm with a high pressure mercury arc lamp (excitation filter: 490/20 nm, dichroic mirror: 510 nm). Light intensity was regulated by neutral density filters. Light exposure time was 80 ms and acquisition rate was 12 Hz. Increase in [Ca2 +]i due to local mechanical stimulation leads to an increase in the emitted fluorescence. Changes in [Ca2 +]i over time were presented as the relative fluorescence intensity change, which was calculated by dividing all images from the time series by the first image: F/F0 = fluorescence/(fluorescence at rest). Changes in [Ca2 +]i was measured by taking the average fluorescence intensity of the regions of interest (ROIs) that included the entire cell. All experiments were performed at room temperature. Image analysis was performed with ImageJ software (NIH Image, Bethesda, MD) and data processing was performed with MatLab software (MathWorks, MA, USA).
Mechanical stimulation
Local mechanical stimulus was applied by gently and transiently touching a single cell with a micropipette (Eppendorf Femtotips I). Under visible light the micropipette was initially positioned just above the target cell. Then, during fluorescence image capture, the pipette was lowered to transiently (< 1 s) contact the cell with a transjector (transjector 5246, Eppendorf, Schönenbuch, Switzerland) attached to a micromanipulator (Leica Mikroskopie und Systeme GmbH). To exclude the possibility that paracrine signals diffuse to neighboring cells, we performed all calcium experiments in a homemade flow chamber. Perfusion flow (2 ml min−1) was provided with a syringe pump (SP 210 IW, World Precision Instruments, Stevenage, UK). The direction of the flow was opposite to the pipette axis to ensure drifting of paracrine signals away from the examined neighboring cells. Without perfusion of the extracellular medium the onset Ca2 + signal propagated from the target cell to all neighboring cells in all directions. Control experiments showed that the stimulated cell could be repetitively and reproducibly stimulated without change in the rate of Ca2 + increase for subsequent stimuli. At the end of each experiment, the stimulated cell was observed under transmitted light to verify that the membrane depression was slight and had not visibly damaged the cell.
Gap junction inhibitors
Carbenoxolone (CBX) (Sigma–Aldrich) was first dissolved in distilled water to 100 mM, then diluted to 100 μM in buffer. Cells were allowed to preincubate in CBX for 20 minutes at room temperature. 1-Octanol (Sigma–Aldrich) was first dissolved in 100% ethanol at a concentration of 100 mM, and then diluted to 1 mM in buffer. Synthetic connexin-mimetic peptides 43Gap 26 (VCYDKSFPISHVR) (Tocris Bioscience Bristol, UK) were dissolved directly in buffer to the final concentration of 300 μM and allowed to preincubate for 40 minutes. For 43Gap 26 control experiments, cells were preincubated for 40 minutes either in buffer solution or buffer containing 300 μM of the 43Gap 26 scrambled version (PSFDSRHCIVKYV) (Severn Biotech, UK).
Scrape-loading and dye transfer with Lucifer Yellow
Gap junctional intercellular communication was evaluated by the diffusion of the fluorescent tracer Lucifer Yellow (LY) (Molecular Probes), as described in CitationFollonier ET AL. (2008). A7r5, pSMCs, and 6B5N cells grown to confluent monolayer were washed with Hank's buffered salt solution (HBSS) (Invitrogen), buffer solution was replaced with LY solution (5 mg ml−1) and then cells were injured along a line with a scalpel blade. Wounded cells were allowed to absorb and to intercellularly transmit LY for 5 minutes. Cells were then washed in HBSS, fixed for 10 minutes in 3% paraformaldehyde and stained with DAPI for nuclei. Images were acquired using 10 × Plan Neofluor Zeiss objective (NA 0.3) mounted on an upright Zeiss Axioplan microscope with a Zeiss AxioCam camera (HRm Rev.2) and were assembled and analyzed with ImageJ software (NIH Image, Bethesda, MD). Since A7r5, pSMCs, and 6B5N cells in confluent cultures appeared to be different in size, the spread of LY was quantified relative to the cell width for each cell type. Cells had no specific orientation; consequently, cell width could be calculated as the square root of the average cell area. Average cell area was calculated by measuring the surface area of LY positive cells (n = 50 for each cell type). Average cell area for A7r5 cells: 1104 ± 104 μm2, for pSMCs: 1216 ± 154 μm2, and for 6B5N cells: 581 ± 38 μm2.
RNA isolation and quantitative RT-PCR (Lightcycler©)
Cells were homogenized in the Tripure Isolation Reagent (Roche Diagnostics) and total RNA was extracted using the kit procedure. Transcripts (1 μg) were reverse-transcribed using ImProm-2 Reverse transcription System (Promega). Quantitative PCR was performed using the SYBR® Premix ExTaq™ (Takara) in a Lightcycler Instrument (Roche Diagnostics). cDNAs were amplified using the following primers: rat Cx43: 5′-CAACGACCTTCCAGCAGAG-3′ (sense) and 5′-CTCCCTTATCCCCACCTGTT-3′ (antisense). Rat Cx40: 5′-AGGGTGAGGCAGGACAGAAG-3′ (sense) and 5′-GGTTGGGGATTTGAGGAGTAG-3′ (antisense). Rat α-actin: 5′-CGTTGACATCCGTAAAGACC-3′ (sense) and 5′-TAGAGCCACCAATCCACACA-3′ (antisense).
Western blot
Cells were solubilized by sonication in SDS buffer (62.5 mM Tris–EDTA, pH 6.8, 5% SDS). Protein content was measured using a detergent-compatible DC protein assay kit (Bio-Rad Laboratories, Reinach BL, Switzerland). Samples were equally loaded (50 μg) on a 12.5% polyacrylamide gel followed by electrophoresis and transferred onto PVDF membrane (Immobilon-P; Millipore, Volketswil, Switzerland). Membranes were incubated for 1 hour in PBS containing 5% milk and 0.1% Tween20 (blocking buffer). Saturated membranes were incubated overnight at 4°C with: rabbit polyclonal antibodies against Cx40 (1:250) (AB1726, Chemicon International), Cx43 (1:2000) (AB1728, Chemicon International), or monoclonal antibody anti-alpha-tubulin (1:3000) (T5168, Sigma–Aldrich). After incubation at room temperature for 1 hour with a convenient secondary antibody conjugated to horseradish peroxidase (1:20,000) (Fluka Chemie), membranes were revealed by enhanced chemiluminescence (ECL) according to the manufacturer's instructions (Amersham Bioscience Europe). Densitometric analyses of immunolabeled proteins (Western blots) were performed using the ImageQuant Software (Molecular Dynamics, Amersham BioscienceEurope).
Immunofluorescence
Cells were washed with serum free culture medium then fixed for 10 minutes with 3% paraformaldehyde in PBS. For primary antibodies, we applied: anti-Cx43 (mouse IgG1 (1:100), BD Biosciences, Allschwill, Switzerland), anti-Cx40 (rabbit C-term (1:100), and invitrogen, Carlsbad, CA, USA). For secondary antibodies, we applied: anti-mouse Alexa Fluor 568 (1:250) (Molecular Probes), anti-rabbit Alexa Fluor 488 (1:250) (Molecular Probes), and nuclei were stained with DAPI (1:50) (Fluka, Buchs, Switzerland). For control experiments, cells were loaded with only secondary antibodies. In another series of experiments, different antibodies were applied against Cx43 (polyclonal mouse anti-Cx43, C-term (1:250), Chemicon) and Cx40 (mouse anti-Cx40, C-term (1:250), Invitrogen). No difference was found in Cx distribution using these antibodies (data not shown). Images were acquired using an oil-immersion objective 20 ×, NA 0.8 or 40 ×, NA 1.3, mounted on an Olympus IX 81 motorized inverted spinning disk confocal microscope (Perkin Elmer Ultra View ERS). Figures were assembled with ImageJ software (NIH Image, Bethesda, MD).
Co-immunoprecipitation
Cells prepared as described in the Western blot section were homogenized in 1X lysis buffer (10 mM Tris, pH 7.5; 150 mM NaCl; 1 mM EDTA; 1 mM EGTA; 1% Triton X-100; 2.5 mM sodium pyrophosphate; 1 mM β-glycerophosphate; 1 mM Na3VO4; 1 μg/ml aprotinin; 1 μg/ml leupeptin) and precleared by incubation with 20 μl of a mixture of Protein G PLUS/Protein A-Agarose beads (IP05, Calbiochem) for about 1 hour at 4°C. The cleared lysates were transferred into a fresh tube and incubated with either 2 μg of monoclonal anti-mouse Cx40 antibodies (37-8900, Invitrogen), 2 μg of polyclonal anti-mouse Cx43 antibodies (AB1728, Chemicon), or 2 μg of polyclonal anti-human NFκB-P65 antibodies (sc-372X, Santa Cruz Biotechnology) for 20 hours at 4°C. Connexins containing complexes were captured by incubation with 20 μl of a mixture of Protein G PLUS/Protein A-Agarose beads (IP05, Calbiochem) for 3 hours at 4°C. After incubation, the beads were washed three times with 1X lysis buffer, before removal of bound proteins by boiling in SDS sample buffer. Samples were resolved in a 10% polyacrylamide gel by electrophoresis and analyzed by Western blot. Saturated blots were incubated overnight at 4°C in blocking solution containing the following primary antibodies: monoclonal anti-mouse Cx40 (37-8900, 1/250; Invitrogen) and polyclonal anti-mouse Cx43 (AB1728, 1/2000; Chemicon). Bound antibodies were detected with peroxidase-conjugated secondary antibodies (Fluka Chemie, 1/20,000) and visualized using enhanced chemiluminescence Western blotting detection reagent (Amersham Bioscience Europe).
In situ proximity ligation assay
The Duolink in situ proximity ligation assay (PLA, OLINK Bioscience, Sweden) was used for the visualization of a direct protein interaction between Cx43 and Cx40 in A7r5 and 6B5N cells. After being fixed for 10 minutes in acetone at − 20°C, cells were incubated in the presence of two primary antibodies from different species: monoclonal anti-mouse Cx40 (37-8900, 1/250; Invitrogen) and polyclonal anti-mouse Cx43 (AB1728, 1/250; Millipore). Two secondary antibodies, to which oligonucleotides have been attached, were used to detect the target proteins. If the target proteins are in interaction, the attached oligonucleotides are brought into close proximity and can then be used as a template for the DNA ligase-mediated joining of two additional linear oligonucleotides, causing them to form a circular DNA molecule. By using one of the antibody-attached oligonucleotides as a primer, the circular DNA molecule was amplified into a long single-stranded concatemer by rolling circle amplification. The rolling circle amplification product collapsed into a bundle of DNA that was detected by hybridizing fluorophore-labeled oligonucleotides to the repeated sequences in the amplification product and were detected by fluorescence microscopy as bright sub-micrometer-sized spots. For control experiments, cells were incubated by omitting one of the two primary antibodies. Images were acquired using a fluorescence microscope (Leica Leitz DMRB, Nidau, Switzerland) and analyzed with ImageJ software (NIH Image, Bethesda, MD) in order to evaluate the number of Cx43–Cx40 interactions in each cell type (number of positive red dots divided by the number of cells; n = 5 for each cell type).
Statistical analysis
Data are reported as the mean ± standard error of the mean (S.E.M.). n indicates the number of independent experiments. Comparisons of means between groups were performed by paired or unpaired student's t-tests as appropriate. *p < 0.05, **p < 0.01, ***p < 0.001. p < 0.05 was considered as a statistically significant difference.
Results
Intercellular communication in A7r5 cells and pSMCs
Ca2 + waves were induced by local mechanical stimulation of one single SMC, and then observed the propagation of the signal to adjacent cells. The stimulation was restricted to a small region of one cell, the furthest possible from neighboring cells. Local mechanical stimulation of A7r5 cells gave rise to a [Ca2 +]i increase in the stimulated cell (n = 20). In 15 experiments (out of 20), this Ca2 + signal was transmitted to only few adjacent cells, but with much smaller amplitude (). In the remaining five experiments, the induced Ca2 + signal did not propagate to any adjacent cell. Because of the weak coupling between A7r5 cells we used pSMCs. Local mechanical stimulation of pSMCs evoked a Ca2 + rise that propagated to neighboring cells (n = 16) (). Quantitative assessment of the average peak fluorescence amplitude of the Ca2 + rise in neighboring cells relative to the stimulated cell (cell 1) further demonstrated that the transmission of the Ca2 + signal was significantly higher in pSMCs compared to A7r5 cells ().
Figure 1. Representative fluorescence profiles of local mechanical stimulation-induced Ca2 + responses. Site of stimulation is marked by an asterisk on cell 1. To exclude the possibility that soluble factors released due to mechanical stimulation may induce a Ca2 + increase, a counter perfusion flow of the extracellular medium was applied. The direction of the flow is indicated above the fluorescence images. Time of stimulation is indicated by an arrow. (A) In A7r5 cells stimulation evoked a Ca2 + increase in the stimulated cell (cell 1) that failed to propagate to neighboring cells. In pSMCs (B) and 6B5N cells (C), the Ca2 + transient evoked in the stimulated cell propagated to neighboring cells. Scale bars, 25 μm. (D) A data summary of average peak fluorescence amplitude of the Ca2 + rise in neighboring cells relative to the Ca2 + rise in the stimulated cell.
To test whether the intercellular Ca2 + wave propagation in pSMCs was mediated through GJs, experiments were performed in buffer solution containing carbenoxolone (CBX) or octanol. Both GJ uncouplers inhibited the propagation of the Ca2 + wave to adjacent cells. In the presence of 100 μM CBX, Ca2 + wave propagation was diminished (n = 4, upper row), whereas 1 mM octanol completely abolished the propagation (n = 4, upper row). A decrease in Ca2 + peak amplitude in the stimulated pSMCs in the presence of CBX and octanol was also observed.
Figure 2. Effects of GJ inhibitors on the propagation of Ca2 + wave in pSMCs and 6B5N cells. The same cell (cell 1) is stimulated before and after inhibitors were applied. Carbenoxolone (CBX) (A) remarkably diminished, whereas octanol (B) blocked the propagation of Ca2 + waves to neighboring cells. Scale bars, 25 μm.
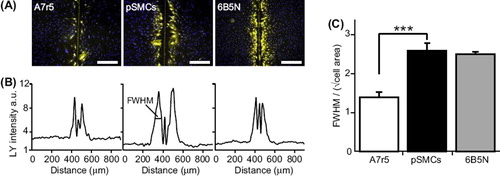
In order to compare the difference in dye-coupling between A7r5 cells and pSMCs, we tested the intercellular diffusion of Lucifer Yellow (LY) in confluent monolayer cultures with the scrape-loading dye transfer technique. The spread of LY was significantly greater in pSMCs (n = 9) than in A7r5 cells (n = 9). In A7r5 cells usually only the first rank of cells, adjacent to the scrape, showed LY signal ().
Figure 3. Quantification of GJ dye-coupling by intercellular Lucifer Yellow diffusion. (A) Scrape-loading and dye transfer of LY (yellow) in A7r5, pSMCs and 6B5N cells (nuclei in blue). The vertical line in the middle of the image is the mark of the scalpel blade used for scrape-loading. Scale bars, 200 μm. (B) Plot of average LY fluorescence intensity in each pixel along the rows within the images in (A). (C) The distance of LY diffusion was quantified by taking the full width at half maximum (FWHM) of the plots in (B) divided by the square root of the average cell area. The spread of LY in pSMCs was significantly higher than in A7r5 cells and similar as in 6B5N cells.
Expression of Cx43 and Cx40 in A7r5 cells and in pSMCs
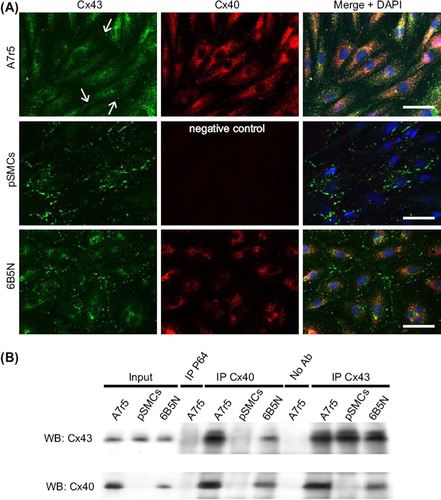
To understand the difference in the gap junctional Ca2 + signal transmission between A7r5 and pSMCs, we analyzed the expression of Cx43 and Cx40. Cx expression was tested in terms of mRNA content, protein expression and immunofluorescence staining. Results of quantitative RT-PCR showed that expression of Cx43 mRNA was significantly higher in pSMCs compared to A7r5 cells, and that Cx40 is not expressed in pSMCs (). Western blot analysis also showed that expression of Cx43 was significantly higher in pSMCs compared to A7r5 cells, and the absence of Cx40 in pSMCs (). Quantification of the Cx protein expression levels are summarized in . To compare Cx43 expression patterns, immunofluorescence for Cx43 and Cx40 was performed in both cell types. In A7r5 cells, immunostaining demonstrated that Cx43 was mainly localized in the cytoplasm with few immunofluorescent dots at the regions of cell-to-cell contact (arrows in , upper row, n = 12). Cx40 was also present, but mostly in the cytoplasm, and even with higher magnification (Supplementary Figure 1 available online at http://www.informahealthcare.com/doi/abs/10.3109/15419061.2012.690792), was barely observable at the sites of cell–cell contact. The same results were obtained using different antibodies against Cx43 and Cx40 (see Materials and Methods). In pSMCs, however, Cx43 was strongly expressed as shown by punctate staining at the regions of cell–cell contact corresponding to GJ plaques, with negligible amount in the cytoplasm ( middle row, n = 8).
Figure 4. Expression of Cx43 and Cx40. RT-PCR analysis of Cx mRNA expression (A) in A7r5 and pSMCs cells demonstrates a higher expression of Cx43 in pSMCs than in A7r5 cell, and the absence of Cx40 in pSMCs. The mean value of A7r5 cells, control, is presented as 1. Western blot analysis in (B) and densitometric analysis of Cx protein levels in (C) also showed the higher expression of Cx43 and the absence of Cx40 in pSMCs. 6B5N cells express the same amount of Cx43, but lower Cx40 compared to A7r5 cells. Densitometric data were normalized to A7r5 cells, separately for each connexin type.
Figure 5. Distribution patterns and interaction of Cx43 and Cx40 in A7r5, pSMCs and 6B5N cells. In A7r5 cells (A, upper row) Cx43 (green) was rarely localized at the site of cell–cell contact (arrows in A, upper row right). Most of the Cx43 was localized in the cytoplasm. PSMCs (A, middle row) showed punctate patterns of Cx43 immunoreactivity at the regions of cell–cell contact corresponding to gap junction plaques (nuclei in blue). In 6B5N cells (A, bottom row) distinct Cx43 immunoreactivity was detectable at the regions of cell–cell contact with fewer Cx43 in the cytoplasm compared to A7r5 cells. Scale bars, 50 μm. In (B) lysates of cell samples (A7r5, pSMCs, and 6B5N) were incubated either with specific antibodies against Cx40 (lanes IP Cx40) or Cx43 (lanes IP Cx43). Complexes were immunoprecipitated (IP) and analyzed by Western blot (WB) using Cx43 (B, upper panel) or Cx40 antibodies (B, lower panel). The input lanes represent the whole cell lysate before immunoprecipitation (positive controls). Immunoprecipitation with irrelevant antibodies (antibodies against NFκB-P65, lane IP P65) or in the absence of antibodies (lane no. Ab) represent negative controls. An interaction between Cx43 and Cx40 was observed in A7r5 and 6B5N cells, but not in pSMCs, since they do not express Cx40.
Intercellular communication in 6B5N cells
To determine whether cells expressing a higher Cx43:Cx40 expression ratio than A7r5 cells would exhibit increased cell–cell coupling, we used 6B5N cells. 6B5N cells are a clone of A7r5 cells that expresses a higher Cx43:Cx40 ratio: 0.67 compared to 0.37 in A7r5 cells (CitationBurt ET AL., 2001). This higher ratio is a result of decreased Cx40, but similar Cx43 expression levels to A7r5 cells as demonstrated in CitationBurt ET AL. (2001). To test whether Ca2 + waves propagate between 6B5N cells, we applied local mechanical stimulation as described for A7r5 and pSMCs. Stimulation evoked a [Ca2 +]i rise that propagated to neighboring cells (n = 26) (). Quantitative assessment of the average peak fluorescence amplitude of the Ca2 + rise in neighboring cells relative to the Ca2 + rise in the stimulated cell (cell 1) is summarized in . To show that this propagation was mediated through GJs, experiments were performed in the presence of CBX or octanol. Both GJ uncouplers inhibited the propagation, similarly to pSMCs (CBX: bottom row, n = 5; octanol: , bottom row, n = 5). Scrape-loading and dye transfer with LY experiments showed that coupling between 6B5N cells is higher compared to A7r5 cells, as expected from an earlier study (CitationBurt ET AL., 2001), but statistically not different from pSMCs (p = 0.71) ().
Cx43 and Cx40 expressions, measured as mRNA content and protein expression, were also evaluated. The 6B5N cells expressed lower protein levels of Cx40 and similar levels of Cx43 to A7r5 cells ( and C), as expected from an earlier study (CitationBurt ET AL., 2001). Immunostaining of 6B5N cells showed strong expression of Cx43 at the sites of cell–cell contact, but less strong than in pSMCs, and far less Cx43 was detected in the cytoplasm compared to A7r5 cells (, lower row, n = 6). Cx40 was also present mostly in the cytoplasm and, even with higher magnification (Supplementary Figure 1 available online at http://www.informahealthcare.com/doi/abs/10.3109/15419061.2012.690792), was barely observable at the sites of cell–cell contact. The same results were obtained using different antibodies against Cx43 and Cx40 (see Materials and Methods).
Interactions between Cx43 and Cx40 in A7r5 and 6B5N cells
Immunoprecipitation experiments were performed to investigate an association between Cx43 and Cx40 in A7r5 and 6B5N cells. A preparation of A7r5, 6B5N, or pSMCs was first incubated separately in the presence of anti-Cx40 or -Cx43 antibodies. The immune complexes were collected using a mixture of Protein G PLUS/Protein A-Agarose beads and analyzed by immunoblotting. Western blot incubated with Cx43 antibodies (, upper panel) showed that Cx43 interacts with Cx40 (IP Cx40 lanes) in the A7r5 and 6B5N cells, but not in the pSMCs, which do not express Cx40. Moreover, Cx43 was immunoprecipitated to a lower extent in 6B5N than in A7r5 cells due to decreased levels of Cx40 in the 6B5N cells. As positive controls, Western blot analysis revealed the presence of Cx43 in the three cell types when proteins were immunoprecipitated with Cx43 antibodies (, upper panel, IP Cx43 lanes). Western blots incubated with antibodies against Cx40, also demonstrated a close interaction between Cx43 and Cx40 which was not observed in pSMCs due to the absence of Cx40 in these cells (, lower panel). These results demonstrated that Cx40 interacts with Cx43 in both A7r5 and 6B5N cells, and revealed less Cx40–Cx43 interactions in 6B5N cells compared to A7r5 cells.
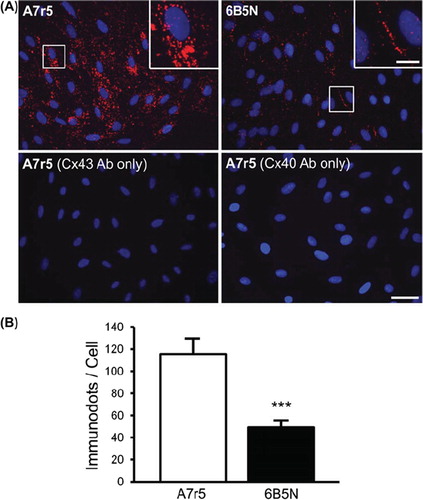
To investigate the subcellular localization and direct interactions between Cx43 and Cx40 in A7r5 and 6B5N cells, we performed proximity ligation assays using oligonucleotide-conjugated secondary antibodies, which, when located in close vicinity, allow an in situ reaction of polymerization. This technique is a sensitive method to detect protein interactions in biological samples (CitationAlonso ET AL., 2010a; CitationSoderberg ET AL., 2006). In A7r5 cells, proximity ligation assay demonstrated that Cx43 mainly interacts with Cx40 in the perinuclear region (, top left). The quantification of the staining in the two cell types revealed 2- to 3-fold less interactions in 6B5N compared to A7r5 cells (). In 6B5N cells, Cx43–Cx40 interactions are mostly located at the plasma membrane at the sites of cell–cell contact (, top right). The bottom row of represents negative controls where only one of the primary antibodies was added on the cells before the proximity ligation procedure.
Figure 6. Detection of interactions between Cx43 and Cx40 in A7r5 and 6B5N cells. For the visualization of the direct protein interaction between Cx43 and Cx40, the fixed cells were incubated in the presence of two primary antibodies directed against Cx43 and Cx40. Two secondary antibodies, to which oligonucleotides were attached, allowed the detection of the target proteins. As Cx43 is in proximity of Cx40, the attached oligonucleotides constitute a template to form a circular DNA molecule, which was amplified to form a bundle of DNA detected by a Texas-Red-labeled probe (red spots). Top row in (A) shows in situ ligation assay for Cx43 and Cx40 in A7r5 and 6B5N (nuclei in blue). Scale bar: 30 μm. The insets are zooms of the area in white square and indicate that Cx43–Cx40 interactions in A7r5 cells are mainly located in the cytosol whereas in 6B5N, Cx43 interacts with Cx40 mainly at the regions of cell–cell contact. Scale bar: 15 μm. The bottom row in (A) represents negative controls for in situ ligation assay performed by incubation with only one of the following antibodies: the Cx43 antibodies (left) or the Cx40 antibodies (right) (representative from 3 independent experiments). (B) Quantification of the number of Cx43–Cx40 interactions in each cell type illustrating that Cx43 is significantly less bound to Cx40 in 6B5N compared to A7r5.
Effects of connexin-mimetic peptides on gap junctional coupling
The Cx-mimetic peptide 43Gap 26 specifically blocks Cx43 in a concentration-dependent manner (CitationChaytor ET AL., 1997). Here we tested the effects of 43Gap 26 on gap junctional coupling with the intercellular diffusion of LY and the propagation of Ca2 + waves. Since 6B5N cells and pSMCs dye-coupling results were similar (), we performed the scrape-load LY transfer experiments on 6B5N cells at two different concentrations of 43Gap 26. The spread of LY significantly decreased when applying 43Gap 26 ( and B). The specificity of the effect of 43Gap 26 on dye-coupling was controlled using scrambled 43Gap 26. LY diffusion in the presence of scrambled 43Gap 26 was similar to control, which demonstrates the specificity of the effect of 43Gap 26.
Figure 7. Effects of connexin-mimetic peptide 43Gap 26 on gap junctional-coupling. (A) Scrape-loading and dye transfer of LY (green, nuclei in blue) in 6B5N cells in the presence of the Cx43 gap junction inhibitor 43Gap 26 and it's scrambled version. Scale bars, 100 μm. 43Gap 26 significantly decreased LY diffusion to neighboring cells. The scrambled 43Gap 26 was used as a negative control to test the specificity of the effect of 43Gap 26 (A and B). LY diffusion in the presence of scrambled 43Gap 26 was similar to control (p = 0.66). Experiments on the left panel in (C and E) are time-matched controls, whereas, the right panel shows experiments performed after 40 minutes incubation in buffer solution supplemented with 43Gap 26. 43Gap 26 significantly diminished the propagation of Ca2 + waves to neighboring cells in both pSMCs (C) and 6B5N cells (E). Scale bars, 25 μm. Change in fluorescence ratio (ΔF/F0) in control compared to 43Gap 26 treated cells are summarized in (D) for pSMCs and in (F) for 6B5N cells.
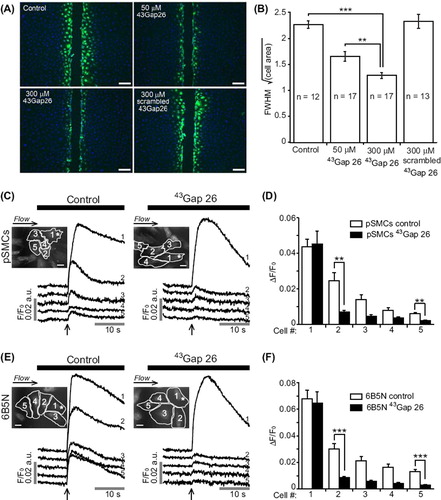
To test the hypothesis that the propagation of Ca2 + waves between pSMCs and 6B5N cells occurred through GJs composed of Cx43, we studied the effects of 43Gap 26 on Ca2 + wave propagation. Both pSMCs (n = 7) and 6B5N cells (n = 11) were incubated for 40 minutes in buffer solution supplemented with 300 μM 43Gap 26. In both cell types, 43Gap 26 inhibited the propagation ( and E). Data summary for mechanically-induced Ca2 + rise in pSMCs and 6B5N cells are shown in and F.
Discussion
The results of the present study show that primary cultured rat mesenteric SMCs do not express Cx40, and that mechanically-induced intercellular Ca2 + waves in pSMCs are mediated through Cx43 GJs. Comparison of results from cells co-expressing Cx43 and Cx40 demonstrates a direct correlation between higher Cx43:Cx40 expression ratios and successful propagation of Ca2 + waves, and suggests that co-expression of Cx43 with Cx40, depending on their relative expression levels, interferes with Ca2 + wave propagation between vascular smooth muscle cells.
A7r5 cells have been used as a SMC model in studies of calcium dynamics (CitationBlatter & Wier, 1992; CitationByron, 1996; CitationMoore ET AL., 1991; CitationRüegg ET AL., 1985) and intracellular calcium wave propagation (CitationBlatter & Wier, 1992), yet, intercellular Ca2 + wave propagation studies, to the best of our knowledge, have not been conducted on these cells. To induce an intercellular Ca2 + wave between A7r5 cells, we applied local mechanical stimulation of one cell and followed signal propagation to adjacent cells. However, A7r5 cells showed very weak intercellular Ca2 + signal propagation. Using primary cultured SMCs from rat mesenteric artery instead, local mechanical stimulation evoked an increase in [Ca2 +]i that propagated to neighboring cells ( and B). While it has been shown that connexin hemichannels can be stimulated by mechanical stimulation to release ATP, and ATP can induce Ca2 + release in neighboring cell (CitationGomes ET AL., 2005; CitationStout ET AL., 2002), our experiments with A7r5 cells and the presence of the counter flow demonstrates that Ca2 + wave propagation in our study were GJ mediated. The use of gap junction inhibitors also demonstrated that the propagation of intercellular Ca2 + waves was mediated by GJs. The decrease in Ca2 + amplitude in the presence of the uncouplers is likely due to their non-specific actions as it has been demonstrated in previous studies (CitationColeman ET AL., 2001; CitationTare ET AL., 2002; CitationVessey ET AL., 2004). This effect was not observed when using the connexin-mimetic peptide 43Gap 26. The difference in gap junction functionality between A7r5 cells and pSMCs could be explained by their different GJ channel composition. Since Cx43 and Cx40 had been previously shown to mediate Ca2 + waves in different cell types and regulate arteriolar vasomotion (CitationCharles ET AL., 1992; Citationde Wit ET AL., 2003; CitationPaemeleire ET AL., 2000; CitationTallini ET AL., 2007; CitationToma ET AL., 2008; CitationToyofuku ET AL., 1998), we focused on the comparison of Cx43 and Cx40 expression in A7r5 cells and pSMCs. Our main findings are that Cx43 expression level in pSMCs are ∼4-fold higher compared to A7r5 cells, and that Cx40 are not expressed in pSMCs. Lack of Cx40 expression in rat mesenteric pSMCs is in accordance with results obtained in guinea-pig mesenteric arterioles (CitationYamamoto ET AL., 2001), in the SMCs of the adult rat aorta (CitationVan Kempen & Jongsma, 1999) as well as mouse aorta (CitationAlonso ET AL., 2010b), but differs from the results of (CitationGustafsson ET AL., 2003) where immunoreactivity of Cx40 was detected in the media of small mesenteric arterioles. On the other hand, these studies agreed that Cx40 is predominantly expressed in endothelial cells. The variability of connexin expression in arteries is likely due to the fact that different species and vascular beds were studied. Our study was in vitro; it would be also interesting to see whether Cx43–Cx40 interactions function the same way in vivo.
Previous studies have shown that co-expression of Cx40 and Cx43, including in A7r5 cells, allows the formation of gap junction channels with mixed connexin composition, and that such junctions display functional properties different from junctions formed of a single connexin isoform (CitationBurt ET AL., 2001; CitationCottrell ET AL., 2001, Citation2002; CitationHeyman ET AL., 2009). In our study, however, immunostaining images () revealed that most of the Cx43 in A7r5 cells seemed to be trapped in the cytoplasm. Cx40 distribution was also concentrated in the cytoplasm. Cx43 in pSMCs demonstrated strong immunoreactivity of Cx43 at the sites of cell–cell contact indicating the formation of Cx43 gap junction plaques. Based on our experimental results, we hypothesized that expression of Cx40 in A7r5 cells may have interfered with cell-to-cell communication. To test this hypothesis, we aimed to use cells that express higher Cx43 than Cx40; hence, we used the 6B5N cell line, which is a clone of A7r5 cells that expresses a higher Cx43:Cx40 ratio (CitationBurt ET AL., 2001). In the 6B5N cells, the higher Cx43:Cx40 ratio was obtained by decreased Cx40 expression levels, with no difference in Cx43 expression levels compared to the parental A7r5 cells. In 6B5N cells, local mechanical stimulation induced intercellular Ca2 + wave propagation. 6B5N cells also exhibited better LY dye-coupling than A7r5 cells, consistent with previously published data (CitationBurt ET AL., 2001). The functional results obtained with 6B5N cells were comparable to those obtained with pSMCs. Immunostaining experiments showed that Cx43 in 6B5N cells was localized at the sites of cell–cell contact with few Cx43 in the cytoplasm. Therefore, based on the Cx expression and immunostaining images, it seems that there exists an inverse relationship between Cx40 expression and the presence of Cx43 at the cell surface; in the absence of Cx40 expression, as in pSMCs, Cx43 is exclusively present at the cell surface; in case of a medium expression of Cx40, as in 6B5N cells, Cx43 is present at the cell surface and in the cytoplasm; whereas, in case of a high expression of Cx40, as in A7r5 cells, Cx43 is mainly present in the cytoplasm. Our results of co-immunoprecipitation confirmed the interaction of Cx43 and Cx40 in A7r5 and 6B5N cells. These results also revealed less Cx40–Cx43 interactions in 6B5N cells compared to A7r5 cells.
Using the in situ ligation assay and immunoprecipitation procedure, we recently demonstrated an interaction between Cx40 and Cx37 as well as with eNOS at intercellular junctions of endothelial cells (CitationAlonso ET AL., 2010b). Using the same methods here, we demonstrated a direct interaction between Cx43 and Cx40 in A7r5 and 6B5N cells. With the in situ proximity ligation assay analysis, we further demonstrated that Cx40–Cx43 interactions are mainly located in the perinuclear regions of the cytoplasm in A7r5 cells, whereas the direct interactions between Cx43 and Cx40 are localized at the intercellular junctions of 6B5N cells. The difference in the subcellular localization of gap junction proteins associated with different levels of Cx40 confirmed that high levels of Cx40 expression interfere with the expression of Cx43 as observed in A7r5 cells. These results explain – at the molecular level – the very weak intercellular Ca2 + signal propagation and dye-coupling in A7r5 compared to 6B5N cells.
To prove the involvement of Cx43 in mediating intercellular Ca2 + waves in pSMCs and in 6B5N cells, we used short connexin-mimetic peptides homologous to the extracellular loop of Cx43 (43Gap 26) (CitationChaytor ET AL., 1997) designed to specifically inhibit Cx43. 43Gap 26 inhibited Ca2 + wave propagation in both pSMCs and 6B5N cells. Thus, the inhibitory action of 43Gap 26 demonstrated the involvement of Cx43 gap junction channels in the propagation of intercellular Ca2 + waves. Given that the scrambled 43Gap 26 were not tested on the propagation of Ca2 + waves, whether the effects of 43Gap 26 on these waves were only due to a specific inhibition of connexin channels remains to be fully validated. However, our results, together with the known specificity of 43Gap 26 on Cx43 inhibition (CitationChaytor ET AL., 1997) strongly suggest that this is the case. Studying the mechanisms underlying the propagation of Ca2 + waves in pSMCs had been presented in CitationHalidi ET AL. (2011), but the identification of the molecules that diffuse through GJs remain to be determined.
In summary, we have provided evidence for the first time that primary rat mesenteric smooth muscle cells do not express Cx40. We showed that intercellular Ca2 + waves in these cells are mediated by Cx43 gap junction channels. Co-expression of Cx43 and Cx40 may be a relevant fact in determining the efficiency of cell–cell communication. The significance of this observation is rather high when considering the potential contribution of gap junctions in general circulatory homeostasis and the regulation of vascular tone. Further studies are needed to explore the possible mechanisms by which Cx40 affect Cx43 trafficking.
Supplementary appendix
Download PDF (1.3 MB)Acknowledgments
We thank Dr. Lysianne Follonier Castella and Dr. François-Xavier Boittin for valuable suggestions and expert help. We are grateful to Dr. Aurélie Formey for help with the preparation of the primary culture, and Josiane Smith-Clerc for excellent technical assistance. This work was supported by the Swiss National Science Foundation, Grants FN 310000-114097 and 310300-127122 (J.-J. Meister), FN 31003A-138528/1 (J.-A. Haefliger) and National Institutes of Health grant RO1HL58732 (J. M. Burt). JAH was also supported by the Novartis Foundation.
Conflict of interest: The authors report no conflicts of interest. The authors alone are responsible for the content and writing of the paper.
References
- Alonso F, Boittin FX, Beny JL, Haefliger JA (2010a). Loss of connexin40 is associated with decreased endothelium-dependent relaxations and eNOS levels in the mouse aorta. Am J Physiol Heart Circ Physiol. 299: H1365–H1373.
- Alonso F, Krattinger N, Mazzolai L, Simon A, Waeber G, Meda P, Haefliger JA (2010b). An angiotensin II- and NF-kappaB-dependent mechanism increases connexin 43 in murine arteries targeted by renin-dependent hypertension. Cardiovasc Res. 87: 166–176.
- Berridge MJ (2008). Smooth muscle cell calcium activation mechanisms. J Physiol. 586: 5047–5061.
- Blatter LA, Wier WG (1992). Agonist-induced [Ca2 +]i waves and Ca(2 +)-induced Ca2 + release in mammalian vascular smooth muscle cells. Am J Physiol Heart Circ Physiol. 263: H576–H586.
- Burt JM, Fletcher AM, Steele TD, Wu Y, Cottrell GT, Kurjiaka DT (2001). Alteration of Cx43:Cx40 expression ratio in A7r5 cells. Am J Physiol Cell Physiol. 280: C500–C508.
- Byron KL (1996). Vasopressin stimulates Ca2 + spiking activity in A7r5 vascular smooth muscle cells via activation of phospholipase A2. Circ Res. 78: 813–820.
- Charles AC, Naus CC, Zhu D, Kidder GM, Dirksen ER, Sanderson MJ (1992). Intercellular calcium signaling via gap junctions in glioma cells. J Cell Biol. 118: 195–201.
- Chaytor AT, Evans WH, Griffith TM (1997). Peptides homologous to extracellular loop motifs of connexin 43 reversibly abolish rhythmic contractile activity in rabbit arteries. J Physiol. 503(Pt 1): 99–110.
- Christ GJ, Moreno AP, Melman A, Spray DC (1992). Gap junction-mediated intercellular diffusion of Ca2 + in cultured human corporal smooth muscle cells. Am J Physiol. 263: C373–C383.
- Coleman HA, Tare M, Parkington HC (2001). K + currents underlying the action of endothelium-derived hyperpolarizing factor in guinea-pig, rat and human blood vessels. J Physiol. 531: 359–373.
- Cottrell GT, Wu Y, Burt JM (2001). Functional characteristics of heteromeric Cx40–Cx43 gap junction channel formation. Cell Commun Adhes. 8: 193–197.
- Cottrell GT, Wu Y, Burt JM (2002). Cx40 and Cx43 expression ratio influences heteromeric/heterotypic gap junction channel properties. Am J Physiol Cell Physiol. 282: C1469–C1482.
- de Wit C, Roos F, Bolz SS, Pohl U (2003). Lack of vascular connexin 40 is associated with hypertension and irregular arteriolar vasomotion. Physiol Genom. 13: 169–177.
- Evans WH, De Vuyst E, Leybaert L (2006). The gap junction cellular internet: connexin hemichannels enter the signalling limelight. Biochem J. 397: 1–14.
- Follonier L, Schaub S, Meister JJ, Hinz B (2008). Myofibroblast communication is controlled by intercellular mechanical coupling. J Cell Sci. 121: 3305–3316.
- Formey A, Buscemi L, Boittin FX, Beny JL, Meister JJ (2011). Identification and functional response of interstitial Cajal-like cells from rat mesenteric artery. Cell Tissue Res. 343: 509–519.
- Goldberg GS, Valiunas V, Brink PR (2004). Selective permeability of gap junction channels. Biochim Biophys Acta. 1662: 96–101.
- Gomes P, Srinivas SP, Van Driessche W, Vereecke J, Himpens B (2005). ATP release through connexin hemichannels in corneal endothelial cells. Investig Ophthalmol Vis Sci. 46: 1208–1218.
- Gustafsson F, Mikkelsen HB, Arensbak B, Thuneberg L, Neve S, Jensen LJ, Holstein-Rathlou NH (2003). Expression of connexin 37, 40 and 43 in rat mesenteric arterioles and resistance arteries. Histochem Cell Biol. 119: 139–148.
- Halidi N, Boittin FX, Beny JL, Meister JJ (2011). Propagation of fast and slow intercellular Ca(2 +) waves in primary cultured arterial smooth muscle cells. Cell calcium. 50: 459–467.
- Harris AL (2007). Connexin channel permeability to cytoplasmic molecules. Prog Biophys Mol Biol. 94: 120–143.
- Heyman NS, Kurjiaka DT, Ek Vitorin JF, Burt JM (2009). Regulation of gap junctional charge selectivity in cells coexpressing connexin 40 and connexin 43. Am J Physiol Heart Circ Physiol. 297: H450–H459.
- Kanagaratnam P, Rothery S, Patel P, Severs NJ, Peters NS (2002). Relative expression of immunolocalized connexins 40 and 43 correlates with human atrial conduction properties. J Am Coll Cardiol. 39: 116–123.
- Kanaporis G, Mese G, Valiuniene L, White T, Brink P, Valiunas V (2008). Gap junction channels exhibit connexin-specific permeability to cyclic nucleotides. J Gen Physiol. 131: 293–305.
- Moore LK, Beyer EC, Burt JM (1991). Characterization of gap junction channels in A7r5 vascular smooth muscle cells. Am J Physiol Cell Physiol. 260: C975–C981.
- Oishi H, Budel S, Schuster A, Stergiopulos N, Meister JJ, Beny JL (2001). Cytosolic-free calcium in smooth-muscle and endothelial cells in an intact arterial wall from rat mesenteric artery in vitro. Cell Calcium. 30: 261–267.
- Paemeleire K, Martin PE, Coleman SL, Fogarty KE, Carrington WA, Leybaert L, Tuft RA, Evans WH, Sanderson MJ (2000). Intercellular calcium waves in HeLa cells expressing GFP-labeled connexin 43, 32, or 26. Mol Biol Cell. 11:1815–1827.
- Rüegg UT, Doyle VM, Zuber JF, Hof RP (1985). A smooth muscle cell line suitable for the study of voltage sensitive calcium channels. Biochem Biophys Res Commun. 130: 447–453.
- Sáez JC, Berthoud VM, Brañes MC, Martínez AD, Beyer EC (2003). Plasma membrane channels formed by connexins: their regulation and functions. Physiol Rev. 83: 1359–1400.
- Schuster A, Oishi H, Bény JL, Stergiopulos N, Meister JJ (2001). Simultaneous arterial calcium dynamics and diameter measurements: application to myoendothelial communication. Am J Physiol Heart Circ Physiol. 280: H1088–H1096.
- Segal SS, Damon DN, Duling BR (1989). Propagation of vasomotor responses coordinates arteriolar resistances. Am J Physiol Heart Circ Physiol. 256: H832–H837.
- Seppey D, Sauser R, Koenigsberger M, Bény JL, Meister JJ (2010). Intercellular calcium waves are associated with the propagation of vasomotion along arterial strips. Am J Physiol Heart Circ Physiol. 298: H488–H496.
- Soderberg O, Gullberg M, Jarvius M, Ridderstrale K, Leuchowius KJ, Jarvius J, Wester K, Hydbring P, Bahram F, Larsson LG, Landegren U (2006). Direct observation of individual endogenous protein complexes in situ by proximity ligation. Br J Pharmacol. 3: 995–1000.
- Stout CE, Costantin JL, Naus CC, Charles AC (2002). Intercellular calcium signaling in astrocytes via ATP release through connexin hemichannels. J Biol Chem. 277: 10482–10488.
- Tallini YN, Brekke JF, Shui B, Doran R, Hwang SM, Nakai J, Salama G, Segal SS, Kotlikoff MI (2007). Propagated endothelial Ca2 + waves and arteriolar dilation in vivo: measurements in Cx40BAC GCaMP2 transgenic mice. Circ Res. 101: 1300–1309.
- Tare M, Coleman HA, Parkington HC (2002). Glycyrrhetinic derivatives inhibit hyperpolarization in endothelial cells of guinea pig and rat arteries. Am J Physiol Heart Circ Physiol. 282: H335–H341.
- Toma I, Bansal E, Meer EJ, Kang JJ, Vargas SL, Peti-Peterdi J (2008). Connexin 40 and ATP-dependent intercellular calcium wave in renal glomerular endothelial cells. Am J Physiol Regul Integr Comp Physiol. 294: R1769–R1776.
- Toyofuku T, Yabuki M, Otsu K, Kuzuya T, Hori M, Tada M (1998). Intercellular calcium signaling via gap junction in connexin-43-transfected cells. J Biol Chem. 273: 1519–1528.
- Van Kempen MJA, Jongsma HJ (1999). Distribution of connexin37, connexin40 and connexin43 in the aorta and coronary artery of several mammals. Histochem Cell Biol. 112: 479–486.
- Vessey JP, Lalonde MR, Mizan HA, Welch NC, Kelly ME, Barnes S (2004). Carbenoxolone inhibition of voltage-gated Ca channels and synaptic transmission in the retina. J Neurophysiol. 92: 1252–1256.
- Yamamoto Y, Klemm MF, Edwards FR, Suzuki H (2001). Intercellular electrical communication among smooth muscle and endothelial cells in guinea-pig mesenteric arterioles. J Physiol. 535: 181–195.
- Yashiro Y, Duling BR (2003). Participation of intracellular Ca2 + stores in arteriolar conducted responses. Am J Physiol Heart Circ Physiol. 285: H65–H73.