Abstract
Interleukin-16 (IL-16) is a pro-inflammatory cytokine released by many types of cells found in the lungs, including normal airway and alveolar epithelial cells. Though a chemotactin for CD4+ cells and eosinophils, IL-16 also modulates their production of factors that influence inflammatory lung diseases, e.g., asthma and allergic rhinitis. To date, little is known about any potential autocrine-like regulatory effects of IL-16. Using a model human alveolar basal epithelial A549 cell line, the present study sought to assess lung epithelial cell responses to IL-16. Potential induced effects on cell growth/function were assessed using MTT reduction, lactate dehydrogenase release, and 5-bromo-2-deoxyuridine incorporation assays. As IL-16 (at locally high levels) can induce CD4+ cell death via apoptosis, this potential outcome among the A549 cells was also evaluated using TUNEL and changes in expression of caspase-3 and the pro-apoptotic and anti-apoptotic proteins of Bcl-2 family. The data here indicated that IL-16 inhibited A549 cell growth/function and this was associated with a marked increase in apoptosis characterized by DNA fragmentation, activation of caspase-3, and altered pro-apoptotic protein expression. Since lung epithelial cells lack the CD4 that may bind IL-16, it has been suggested that CD9 may act as an alternate receptor for this cytokine (i.e., an IL-16R). Thus, these studies also sought to determine the extent of CD9 expression on A549 cells and if any/all observed IL-16-induced changes were mediated by CD9. Flow cytometric analyses revealed the cells to be CD9+CD4−. However, neutralization of the purported IL-16R with anti-CD9 antibody could not block the cytotoxic/growth inhibiting effects of IL-16. The only exception appeared to be a mitigation of a chemotactic effect of IL-16; however, studies with an equal amount of non-specific antibody (of same isotype as the anti-CD9) revealed this effect to be artefactual. The neutralization study results thus suggest to us that as-yet undefined pathway(s) exist through which IL-16 may act to exert growth inhibiting/apoptosis-inducing effects on A549 cells, a cell line routinely used as a model for lung epithelial cells.
Keywords::
Introduction
It is well-known that exposure to airborne hazards causes lung inflammation. Inflammatory cytokines, released in response to many inhaled pollutants/toxicants by either resident or infiltrating cells, are known to be critical to the onset, progression, and/or aggravation of several lung diseases, including asthma and allergic rhinitis. Among the various cytokines is interleukin-16 (IL-16) formerly known as lymphocyte chemoattractant factor. IL-16 is released by many types of cells that reside in the lungs; these include both immune (e.g., mononuclear phagocytes [Elssner et al., Citation2004], CD4+ and CD8+ T-lymphocytes [Laberge et al., Citation1995; Wu et al., Citation1999], eosinophils [Lim et al., Citation1996], and mast cells [Rumsaeng et al., Citation1997]), and non-immune type cells (like fibroblasts [Sciaky et al., Citation2000] and epithelial cells [Arima et al., Citation1999; Little et al., Citation2001, Citation2003]). Among the latter type, both normal airway and alveolar epithelial cells have been demonstrated to produce IL-16 (Laberge et al., Citation1997; Cheng et al., Citation2001; Kim et al., Citation2007) in response to tobacco smoke and other airborne pollutants, such as urban particulate matter (Laan et al., Citation1999; Becker and Soukup, Citation2003; Andersson et al., Citation2004).
Though IL-16 acts primarily as a chemotactin for CD4+ cells and eosinophils, it also modulates these cells production of factors that influence inflammatory lung diseases, including asthma and allergic rhinitis (Deng and Shi, Citation2006; Akiyama et al., Citation2009). Examples of these include leukotriene C4 and IL-4 from eosinophils (Bandeira-Melo et al., Citation2002) and IL-5 from the T-lymphocytes of atopic subjects (Pinsonneault, et al., Citation2001). The effects on these two interleukins are in keeping with the well-documented role of IL-16 as an inhibitor of TH2-type responses in vivo and in in vitro studies (see De Bie et al., Citation2002; Wilson et al., Citation2004). Interestingly, IL-16 is a more effective chemoattractant for TH1 than for TH2 cells (Lynch et al., Citation2003); these differential effects suggest that a combination of preferential attraction of TH1 cells with an inhibition of TH2 cytokine production would lead to skewed TH1 responses in situ. This is consistent with the role that IL-16 appears to play during the pulmonary inflammation associated with asthmatic episodes. A further example of how IL-16 might potentially be able to influence inflammatory responses in situ is that it can induce CD4+ cell death (via apoptosis) in vitro when it is present at locally high levels (Zhang and Xu, Citation2002).
As noted above, IL-16 is a well-known CD4+ cell chemotactin; however, it has also been demonstrated that CD4 expression is not required for IL-16 to display its functional activity (Mathy et al., Citation2000). That bronchial epithelial cells do not constitutively express CD4 molecules, and that Yoshida et al. (Citation2001) showed that epithelial cells (specifically, BEAS-2B cells) respond to IL-16 stimulation by an unknown signal transduction pathway, suggests that as with various immune cells, airway and alveolar epithelial cells might potentially have their functions modulated by this cytokine during a host response to inhaled pollutants or during asthma/allergic rhinitis events. If this is the case, then there should be non-CD4-based mechanisms that are used by these cells for such responses to occur.
A recent study by Qi et al. (Citation2006) showed that the CD9 surface molecule might serve as a “receptor” for IL-16 (i.e., an IL-16R) to induce its effects on/in cells; however, their study focused only on mast cells. This was an unexpected function for this transmembrane four super-family (aka tetraspanin family) member. Until then, CD9 was known mainly as a cell surface glycoprotein which complexes with integrins and other transmembrane four proteins, and acted to modulate cell adhesion and migration (as well as trigger platelet activation and aggregation) (NCBI, Citation2009). CD9 is expressed at high levels on the surface of developing B-lymphocytes, platelets, eosinophils, basophils, and stimulated T-lymphocytes (Boucheix et al., Citation1991). Unfortunately, even now, there is little information about the expression of CD9 on lung epithelial cells. A lone paper by Atsuta et al. (Citation1997) indicated that CD9 was expressed on BEAS-2B cells; however, these Authors indicated that CD9 was one of 14 surface markers they identified on BEAS-2B cells that had not been previously documented as constitutively expressed by lung epithelial cells. If, in fact, airway and alveolar epithelial cells normally express CD9, this would support the hypothesis of Yoshida et al. (Citation2001) that concluded that BEAS-2B formation of IL-16 (among other endpoints)—in response to IL-16 itself—was likely a result of some novel autocrine mechanism involving IL-16-mediated signaling.
Thus, the aim of the in vitro study reported here was to evaluate whether IL-16 could alter the growth/function/apoptotic status of lung epithelial cells, specifically A549 cells (a carcinomic human alveolar basal epithelial cell line). Because these cells—like the BEAS-2B—have been shown to express CD9 (Massin et al., Citation2004), the studies also sought to determine whether any observed changes were mediated by CD9 acting as a “receptor” for IL-16 (i.e., an IL-16R).
Materials and methods
Cell culture and treatment reagents
A549 cells were purchased from American Type Culture Collection (Manassas, VA). Cells were grown in Dulbecco’s modified Eagle’s medium supplemented with 12% fetal bovine serum (FBS), 0.2% sodium bicarbonate, 1% antibiotic/antimycotic solution (Sigma, St Louis, MO). All cultures were maintained at 37°C under 5% CO2.
Recombinant human IL-16 (rhIL-16, R&D Systems, Minneapolis, MN) was prepared as a stock at 5 μg/ml in sterile phosphate-buffered saline (PBS, pH 7.2) containing 0.1% human serum albumin. This rhIL-16 has the same biological activity as natural IL-16 (Zhang et al., Citation1998; Nicoll et al., Citation1999). Mouse anti-human CD9 monoclonal antibody (mAb, IgG1 isotype; Clone M-L13, BD Pharmigen, San Diego, CA) was used as supplied by the manufacturer (i.e., at 400 µg/ml).
Experimental outline
Unless elsewise indicated, A549 cells were exposed (as monolayers) to 0.05, 0.50, or 5.00 μg rhIL-16/ml for 24 h. This timepoint was selected for use here based upon preliminary studies that showed each of these doses to be non-lethal over this timeframe (i.e., there were no significant increases in levels of dead cells as assessed by trypan blue exclusion). To determine any role of CD9 (acting as “IL-16R” here) in the outcomes measured in these experiments, some cells were pre-treated with anti-CD9 antibody (most commonly at 20 µg mAb/ml, 1 h, 4°C) prior to any rhIL-16 treatment. To confirm the specificity of any potential neutralizing effects on the various endpoints, in each experiment a third set of cells was pre-treated (1 h, 4°C) with 20 µg non-specific (NS) mAb/ml (i.e., mouse anti-human IgG [IgG1 isotype]) in place of the mAb prior any treatments with rhIL-16.
Except for in the chemotaxis study, only two doses (i.e., 0.4 or 20 μg/ml) of mAb was used for the neutralization steps in each of the various protocols below. Although the Authors recognize that the 20 μg/ml level is far above that used in earlier CD9 neutralization protocols by Yi et al. (Citation2006; up to 1 µg/ml) or Kim et al. (Citation1997; up to 2.5 µg/ml), it is only twice that used (i.e., 10 µg/ml) by Ko et al. (Citation2006) or by Ovalle et al. (Citation2007). Ultimately, this high dose of mAb was selected based upon the Authors’ desire to attain complete abrogation of any surface CD9 ability to interact with the exogenous rhIL-16 that was being provided.
Chemotaxis assay
A549 migration in response to rhIL-16 was studied using fluoroblock inserts (0.8 µm pore size; BD Falcon) placed in wells of a 24-well plate. For the assay, cells were pre-labeled with calcein AM (2 µg/ml in PBS; Molecular Probes, Carlsbad, CA) and then incubated with varying concentrations of anti-CD9 mAb (0, 5, 10, or 20 µg mAb/ml) or with NS IgG (20 µg/ml) in place of mAb CD9 for 1 h at 4°C. After the incubations (blocking steps), the cells were placed in the insert upper chamber and incubated for 3 h at 37°C in 5% CO2; the lower chamber in each well had received 5 µg rhIL-16/ml. In these particular experiments, 5 µg MCP-1/ml was used as a positive control in place of the IL-16. Cell migration was then quantified using a FLUOstar OPTIMA plate reader (BMG Labtech, Cary, NC); all results were expressed in terms of optical density (OD) at 494–517 nm. After the analyses, each filter was removed gently, washed with PBS, fixed with 3% formaldehyde, and migrated cell images captured (at 10× magnification) on a fluorescence microscope (at 490–520 nm). Results were expressed as intensity of fluorescence/field.
Analysis of cell growth using MTT
The MTT assay is based on a cell’s ability to reduce MTT (3-[4,5-dimethylthiazol-2-yl]-2,5-diphenyltetrazolium bromide) to blue insoluble formazan. Here, sets of A549 cells were plated (at 1 × 10⁴/well) in 96-well microtiter plates (from an MTT assay kit; Sigma) and allowed to adhere for 24 h. Thereafter, the cells were pre-treated with 0, 0.4, or 20 µg mAb/ml for 1 h at 4°C; additional sets of cells were treated with 20 µg NS IgG1/ml in place of the mAb. Following these pre-treatment steps, all cells were rinsed gently (3×) with PBS to remove non-adherent antibody and then treated with varying concentrations of rhIL-16 (0.05–5 µg/ml) for 24 h at 37°C in a 5% CO2 atmosphere. An MTT dye was added to each well for the last 4 h of the incubation. After addition of kit-supplied solubilizing reagent, the OD in each well was determined at 570 nm using the FLUOstar system. Background absorbance (medium alone) was subtracted from all measured values and the mean for each experiment was then calculated.
5-Bromo-2-deoxyuridine (BrdU)-labeling cell proliferation assay
A cell proliferation ELISA (BrdU kit; Chemicon International, Temecula, CA) was used (following manufacturer’s protocols) to assess BrdU incorporation during DNA synthesis. Briefly, after treatment as above with rhIL-16, cells were labeled with BrdU mAb (1:200 dilution from kit stock) for 2 h. The cells were then fixed, and their DNA denatured in fixative (30 min, room temperature [RT]). The cells were then incubated with horseradish peroxidase (HRP)-conjugated anti-BrdU mAb for 2 h at RT. After three washings with PBS, immune complexes present were detected by addition of TMB (3,3′,5,5′-tetramethylbenzidine)-peroxide substrate (1:2000 dilution from kit stock) and measuring absorbance at 405 nm in the FLUOstar system.
Measurement of LDH release
Lactate dehydrogenase (LDH) release was used as an indicator of membrane integrity among the treated/untreated A549 cells. Again, sets of A549 cells were plated (at 1 × 10⁴/well) in 96-well microtiter plates and allowed to adhere for 24 h. Thereafter, the cells were pretreated with 0, 0.4, or 20 µg mAb/ml for 1 h at 4°C; additional sets of cells were treated with 20 µg NS IgG1/ml in place of the mAb. Following these pre-treatment steps, all cells were gently washed (3×) with PBS to remove non-adherent antibody and then treated with varying concentrations of rhIL-16 (0.05–5 µg/ml) for 24 h at 37°C in a 5% CO2 atmosphere. After this 24-h treatment, cell-free supernatants were isolated from each well and corresponding LDH activity assessed using an LDH assay kit (Sigma), following the manufacturer’s instructions. With all recovered samples, LDH assay mixture (cofactor and LDH supplied in the kit) and an aliquot of a given supernatant were combined and incubated at RT for 20–30 min. The absorbance in the mixture was then measured at 490 nm in the FLUOstar system.
Caspase-3 analysis
An ELISA kit (R&D Systems) was used to measure active caspase-3. The cells (as monolayers in 24-well plates; ≈2.5 × 10⁵/well) were first pre-incubated (1 h at 4°C) with 0, 0.4, or 20 µg mAb/ml or with 20 µg NS IgG1/ml. Thereafter, all cells were rinsed gently (3×) with PBS to remove nonadherent antibody and then provided 0 or 5.00 µg rhIL-16/ml for 24 h. Some dedicated sets of non-mAb- or -IgG-treated cells received etoposide (10 µM; Sigma) and served as a positive control for inducible apoptosis in this cell line. After the 24-h incubations, all cells were rinsed with PBS and then incubated overnight (at RT) with extraction buffer bearing protease inhibitors leupeptin, pepstatin, aprotinin, and phenylmethanesulfonyl fluoride. The extract in each well was recovered and transferred to a well in a 96-well plate precoated with caspase-3-specific mAb. After 2 h at RT, the well was washed with PBS and caspase-3 conjugate (kit-provided streptavidin-HRP) was added. After a 1-h incubation (at RT), substrate (kit-provided TMB-peroxide mixture) was added; 30 min later (under dark conditions), the reaction was stopped by addition of 100 µl dilute hydrochloric acid. Absorbance in each well was then measured at 450 nm in the FLUOstar system.
Terminal transferase dUTP nick end-labeling (TUNEL)
Using a Cell Death Detection Kit (Roche, Mannheim, Germany), and following the manufacturer’s instructions, TUNEL staining was performed to measure cell death (apoptosis) in the treated A549 cells. This analysis applies an optimized terminal transferase (TdT) to label free 3′-OH ends on genomic DNA (indicative of strand-breaks in cell) with tetramethyl-rhodamine-dUTP in fixed permeabilized apoptotic cells. Here, the A549 cells were incubated 1 h with the TUNEL reaction mixture. Total TdT incorporation was then visualized via an Eclipse 8oi fluorescence microscope (Nikon Instruments, Melville, NY) at a wavelength of 580 nm.
Western blot analysis
Antibodies to Bad, Bax, and Bcl-2 proteins were obtained from Cell Signaling Technology Inc. (Danvers, MA). Cell lysis was carried out using radioimmunoprecipitation assay buffer (Santa Cruz Inc., Santa Cruz, CA) and sonication (1 × 10⁴ cells/treatment regimen) for 15 s. Each lysate was subsequently clarified by centrifugation at 12,000 x g (15 min, 4°C). Lysate proteins were then separated over 12% sodium dodecyl sulfate–polyacrylamide gel electrophoresis gels and electrophoretically-transferred to nitrocellulose membranes. The membranes were then blocked with 5% dry milk/TBS (Tris-buffered saline, pH 7.6) solution for 1 h and then incubated overnight at 4°C with antibodies against Bad, Bax, and/or Bcl-2, and against glyceraldehyde-3-phosphate dehydrogenase (GAPDH) (each at 1:1000 dilution). After the incubation, unbound primary antibodies were removed by four washes with cold TBS. For visualization, secondary fluorescent antibodies (1:1000 dilution; LI-COR Biosciences, Lincoln, NE) were then placed with the membranes for 1 h at RT. After washing off unbound antibody, all resultant bands present were visualized using a LI-COR infrared imaging system.
mRNA expression level by RT-PCR
Total RNA was extracted from treated and untreated cells using TRIZOL (Invitrogen, Carlsbad, CA). Reverse transcription–polymerase chain reaction (RT-PCR) was then carried out using a One-Step RT-PCR kit (iScrip; Bio-Rad, Inc., Hercules, CA), according to manufacturer’s instructions. Briefly, total RNA (≈10 ng) was added to each reaction containing RT-PCR mix and appropriate primers (20 pmole) in a 50 µl total volume. Reverse transcription was carried out for 30 min at 50°C, followed by a 15-min step at 95°C. Amplifications were done with 30 cycles. Each cycle included denaturation (94°C, 1 min), annealing (at appropriate temperature, 1 min), extension (72°C, 1 min), followed by a final extension (72°C, 10 min). Primers used for amplification from first-strand cDNAs are listed in . The number of cycles used was determined in preliminary studies to be within the exponential range of RT-PCR amplification. The ΔCt value was calculated with mRNA levels specific vs. corresponding levels of GAPDH. All the experiments were repeated at least twice.
Table 1. Primers used in mRNA analyses.
Flow cytometric analysis
To assess CD9 expression on A549 cells, aliquots (i.e., 1 × 10⁶) of cells were washed with PBS and resuspended in 0.1 ml of ice-cold PBS supplemented with 1% FBS; phycoerythrin (PE)-conjugated anti-CD9 mAb (clone eBioSn4, SN4 C3-3A2; BD BioSciences, San Jose, CA) was then added to the suspension (0.06 µg/106 cells). The cells were incubated for 1 h at 4°C and then washed and resuspended in 0.5 ml PBS. Expression analysis was then carried out using a BD LSR II analyzer (BD Biosciences).
Statistical analysis
Statistical evaluation of the results was performed with analysis of variance followed by the Tukey’s multiple comparisons test, with the significance level of P < 0.05.
Results
A549 expression of CD9 marker
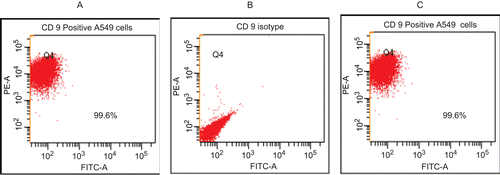
To evaluate if the generally observed effects in the studies here were related to the expression of CD9 (i.e., acting as a purported IL-16R), levels of expression of this marker were first performed. The expression analyses undertaken using the PE-anti-CD9 mAb indicated (via scattergrams; ) that the A549 cells were 99% CD9+.
Figure 1. Expression of CD9 on the surface of A549 cells. (A) Unstained cells. (B) Non-specific isotype-treated cells. (C) PE-labeled anti-CD9 mAb-stained cells. Values in each window are the percentages of all cells analyzed that express CD9. Representative scattergrams (from duplicate analyses/regimen) are shown. A total of 3000 events were counted in each analysis.
rhIL-16-induced chemotactic responses
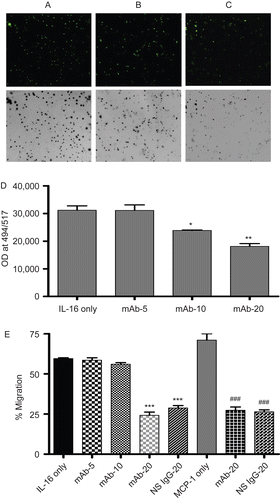
Migration assays were employed to assess A549 responses to the chemotactic effects of rhIL-16. These assays were performed with cells that were or were not pre-treated with anti-CD9 mAb in order to ascertain the extent to which the surface CD9 might have had in any observed IL-16-induced effects. Analyses of the migration by calcein AM-labeled cells revealed that unblocked cells migrated significantly in response to rhIL-16. Cells pre-incubated with anti-CD9 mAb displayed a significant interference in migration kinetics (). This effect was found to depend upon the concentration of anti-CD9 mAb employed (see ). However, to be certain that any effect was truly attributable solely to a blocking of CD9-IL-16 interactions, parallel experiments were performed using a NS antibody (from same host strain and of same isotype as the mAb, i.e., mouse IgG1) at the highest level of the mAb that was employed. These results () revealed that the “blocking” of the chemotactic effect of IL-16 was not CD9-specific and likely an artifact (i.e., possible due to formation of burdened/”sticky” cells). With the anti-CD9 mAb, chemotactic responses were inhibited by 24.4%; with NS IgG1, the inhibition was 29.5%.
To further confirm this latter phenomenon, studies were also performed wherein a different chemotactin was placed in the lower well of the insert (i.e., 5 µg/ml of MCP-1). Once again, A549 cells pre-treated with the anti-CD9 or the NS IgG1were both found to display significantly reduced chemotactic responses (). In this case, the chemotactic responses to the MCP-1 were inhibited by 26.8% after cells were pre-treated with the mAb (at 20 µg/ml); with the NS IgG1, the inhibition was 27.7%. These outcomes thus confirmed that the observed “blocking” effects noted in the IL-16 studies (see ) were artifacts and not related to any ability (or not) of the cell surface CD9 molecules to interact with the rhIL-16.
Figure 2. Chemotactic effects of rhIL-16 on A549 cells. Representative images (10× magnification) of migrated cells when 5 µg rhIL-16/ml was present in lower chamber: (A) A549 cells without pre-treatment; (B) pretreated with 10 µg anti-CD9 mAb/ml; or, (C) pre-treated 20 µg anti-CD9 mAb/ml. To facilitate demonstration of changes in cell numbers present in the fluorescence microscope view-field, the corresponding negative image is provided. (D) Quantification of migrated cells that had been pre-treated with varying levels (0, 5, 10, or 20 µg/ml; IL-16 only, mAb-5, mAb-10, and mAb-20 tags, respectively) of mAb rhIL-16 prior to placement in upper chamber; lower chamber held 5 µg rhIL-16/ml. (E) First five bars (left to right) Percentage: of migration among cells that had been pre-treated with varying concentrations of anti-CD9 mAb or with 20 µg NS IgG1/ml prior to placement in upper chamber; lower chamber held 5 µg rhIL-16/ml. Final three bars (left to right) Percentage: migration among cells that had been pre-treated with 20 µg mAb/ml or with 20 µg NS IgG1/ml prior to placement in upper chamber; lower chamber held 5 µg MCP-1/ml. X-axis designations (tags) in both sets of studies in (E) are as in (D). Data shown are the mean values from three samples per treatment. regimen. Value significantly different at *P < 0.05, **P < 0.01, or ***P < 0.001 compared to IL-16 only value and at ###P Value significantly different at *P < 0.05, **P < 0.01, or ***P < 0.001 compared to IL-16 only value ###P < 0.001 compared to MCP-1 only value.
Effects on cell growth/function
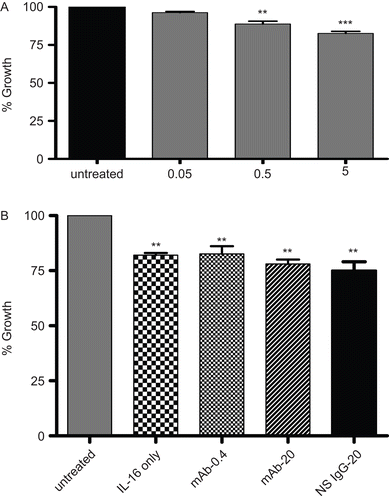
Any relationship between changes in A549 cell growth/function and treatment with rhIL-16 was assessed via an MTT assay. The results illustrate that rhIL-16 significantly inhibited formazan formation in a dose-related manner (); the relative rate of decrease in growth/function (i.e., compared to that associated with the untreated control cells) was 4.3 (± 2.5)%, 11.2 (± 3.2)%, and 17.3 (± 2.2)% as the doses increased from 0.05 to 0.50 to 5.00 µg rhIL-16/ml. Blocking of any cell surface CD9 (or even pre-treatment with NS IgG1) did not inhibit the effect of the highest IL-16 dose tested, as there still clearly was a strong inhibition of cell growth/function (). These outcomes suggested that the CD9 had a very limited-to-no role in the induction of this inhibitory effect by the rhIL-16.
Figure 3. Functionality/growth of A549 cells under different treatment condition detected using an MTT assay. Effects of the treatments are expressed as the percentage of the average control value. (A) Functionality/growth of A549 cells after treatment with various concentrations (0.05, 0.50, or 5.00 µg/ml) of rIL-16 for 24 h. (B) Functionality/growth among cells that had undergone pre-treatment with 0, 0.4, or 20 µg mAb CD9/ml or with 20 µg non-specific IgG1/ml) (IL-16 only, mAb-0.4, mAb-20, and NS IgG-20 tags, respectively) prior to a 5.00 µg rhIL-16/ml treatment for 24 h. Data shown are the mean (± SD) values from three samples per treatment regimen. Value significantly different at *P < 0.05, **P < 0.01, or ***P < 0.001 compared to IL-16-only value and at **P < 0.01 or ***P < 0.001 when compared to untreated cells’ value.
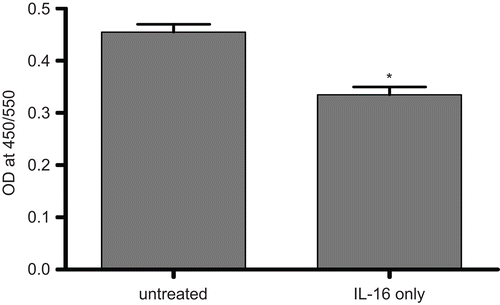
Any rhIL-16-mediated growth inhibition (i.e., as reflected by change in proliferation; using only IL-16 dose that caused maximal effect on MTT results) was also investigated via BrdU-labeling assays. This particular study was performed because while MTT is often used to assess proliferation, it may be more reflective of induced changes in cell respiration (i.e., mitochondrial activity) rather than proliferation per se. The results here show that treatment with 5.00 µg rhIL-16/ml caused significant inhibition of cell proliferation as compared to that by the control cells (). The level of decrement at this IL-16 dose was on par (i.e., 15–20%) with that seen with the MTT results, indicating that the effect of the IL-16 was on cell proliferation (though we cannot absolutely rule out any effects on mitochondrial function).
Figure 4. Cell proliferation potential of rhIL-16-treated A549 cells assessed by BrdU-labeling assay. Measures (expressed as the absorbance at 405 nm) made after treatment of cells with 5.00 µg rhIL-16/ml or vehicle (untreated control) for 24 h. Bars represent the mean optical density (OD) values (± SD) from two samples per treatment regimen. Value significantly different at *P < 0.05 when compared to untreated cells’ value.
Effects on membrane integrity
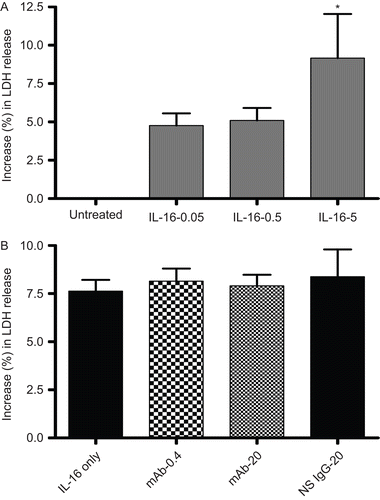
The results of assays of LDH release after exposure to rhIL-16 (0.05, 0.50, or 5.00 µg/ml) for 24 h are presented in . The relative increase in LDH release (i.e., compared to release associated with untreated cells) was only nominal with the 0.05 or 0.50 µg/ml levels, but significant at the 5.00 µg/ml level (). Blocking of any cell surface CD9 (or even pre-treatment with the NS IgG1) did not inhibit the effect of the highest IL-16 dose tested, as there still was a significant release of LDH (). As with the MTT assays, these outcomes indicated that CD9 had little-to-no role in induction of this particular effect by rhIL-16.
Figure 5. LDH release by rIL-16-treated A549 cells. (A) Percentage (%) increase in LDH release (relative to untreated control cells’ value; untreated cells’ value set at 0) after treatment with rIL-16 (0.05, 0.50, or 5.00 µg/ml) for 24 h. (B) Percentage (%) increase in LDH release (relative to untreated control cells’ value) among cells pre-treated with 0, 0.4, or 20 µg mAb CD9/ml or with 20 µg non-specific IgG1/ml) (IL-16 only, mAb-0.4, mAb-20, and NS IgG-20 tags, respectively) prior to a 5.00 µg rhIL-16/ml treatment for 24 h. Each result shown represents mean % increase in LDH release (± SD) of three independent experiments; each experiment was performed in triplicate.
Effects on caspase-3 activity
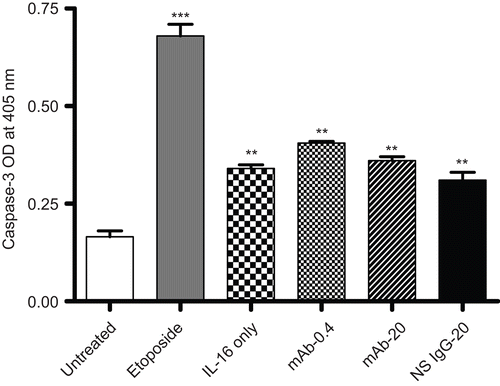
Caspase-3 levels in the A549 cells treated with rIL-16 for 24 h are presented in . As expected, treatment with etoposide led to a significant induction of caspase-3 in the cell line. The results also illustrate that caspase-3 levels within cells treated with 5.00 µg rIL-16/ml were significantly higher relative to levels in control cells; lower cytokine doses had nominal effects (data not shown). As before, the blocking of any cell surface CD9 (or even pre-treatment with the NS IgG1) did not inhibit the effect of the highest IL-16 dose tested, as there still was a substantive increase in caspase-3 levels in the cells. As noted above in the analyses of effects on cell migration, function, and membrane integrity, these outcomes also showed that CD9 had little-to-no role in the induction of caspase-3 by the rhIL-16.
Figure 6. Capsase-3 levels in rIL-16-treated A549 cells. Caspase-3 level in A549 cells pretreated with 0, 0.4, or 20 µg mAb CD9/ml or with 20 µg non-specific IgG1/ml) (IL-16 only, mAb-0.4, mAb-20, and NS IgG-20 tags, respectively) prior to a 5.00 µg rhIL-16/ml treatment for 24 h. To assess apoptosis inducibility in the cell line, a dedicated set of cells was treated with 10 µM etoposide in place of the rhIL-16 (i.e., positive control). Each bar represents the mean optical density (OD) values (±SD) from two samples per treatment regimen. Value significantly different at **P < 0.01 or ***P < 0.001 when compared to untreated cells’ value.
Effects on apoptosis (DNA fragmentation and expression of Bcl-2 family proteins)
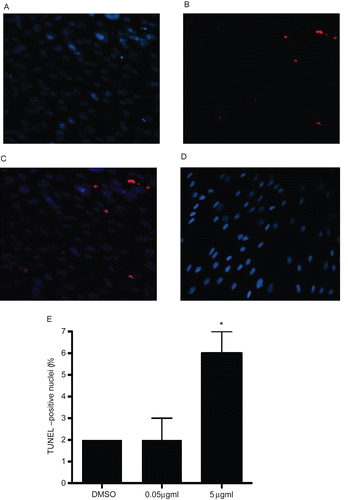
A TUNEL assay was employed to determine apoptotic DNA fragmentation in control and IL-16-treated cells (). There was a significant increase in TUNEL+ A549 cells after treatment with 5.00 µg rhIL-16/ml (). The mean value with treated cells was 6.0 (± 1.4)% of all cells analyzed as compared to 1.3 (± 0.7)% for control cells. Treatment of the cells with the much lower dose of rhIL-16 (i.e., 0.05 µg/ml) had no significant effect (data not shown).
Figure 7. TUNEL analysis of A549 cells treated with rhIL-16 for 24 h. (A) DAPI staining in 5.0 µg rhIL-16/ml-treated cells. (B) TUNEL-positive nuclei in 5.0 µg rhIL-16/ml-treated cells. (C) Merged images; arrows (chevrons) indicate TUNEL+ nuclei. (D) Control samples stained with DAPI and TUNEL (showing DAPI+ nuclei only; no signals were captured in case of TUNEL staining in control samples - thus, image not shown). (E) Percentages (%) of TUNEL+ cells among all control or rhIL-16-treated (0.5 or 5.0 µg/ml) A549 cells. The bars represent the mean TUNEL-positive cell percentage (± SD) from two samples per treatment regimen. Value significantly different at *P < 0.05 when compared to untreated cells’ value.
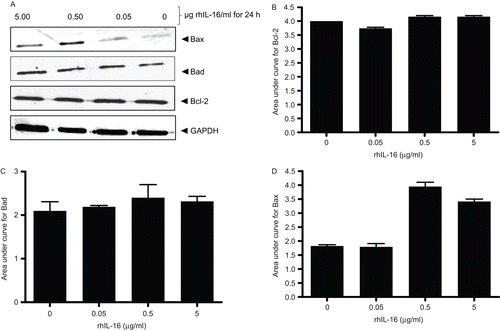
Relative expression level and subcellular localization of inhibitors (Bcl-2) and promoters (Bax and Bad) determine how cells respond to apoptotic stimuli. To examine effects of rhIL-16 on expression of Bad, Bax, and Bcl-2, A549 cells were treated with rhIL-16 for 24 h and expression then analyzed. The results indicated a dose-trend up-regulation of Bax expression (); however, the treatments did not cause any change in endogenous Bcl-2 or Bad levels ().
Figure 8. Expression levels of Bcl-2 family member proteins in rhIL-16-treated A549 cells. (A) Immunoblot shown is a representative blot from at least two generated per treatment regimen. (B–D) Bars reflect expression patterns of (B) Bcl-2, (C) Bad, and (D) Bax in control and in cells treated with the indicated doses of rhIL-16 for 24 h. Each bar represents the mean OD values (± SD)—reflective of specific protein’s expression—from two samples per treatment regimen.
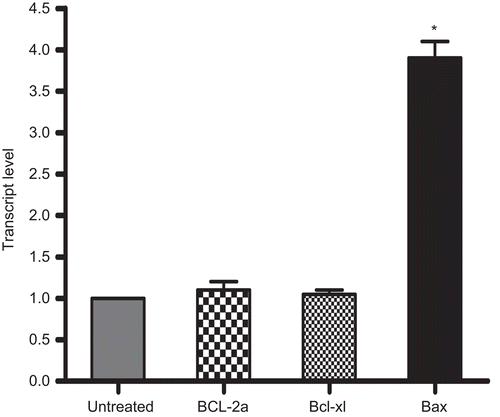
The mRNA expression analyses (by RT-PCR) revealed a 3.9-fold change in the transcript level of Bax in the 5.00 µg rhIL-16/ml-treated cells as compared to levels in control cells (). There was no change in the mRNA expression level of Bcl-2a or in Bcl-xl. Each of these sets of outcomes confirmed the protein expression analyses results reported above.
Figure 9. Comparison of Bcl-2a, Bcl-xl, and Bax mRNA expression levels in rhIL-16-treated as compared to those in untreated (control) A549 cells. Total RNA were extracted following a 24-h treatment with 5.0 µg rIL-16/ml or medium only, and mRNA were then amplified by RT-PCR using specific primers (see ). Results represent fold-change in each mRNA transcript relative to values associated with the untreated cells (set at a value of 1.0). All data were generated using the ΔCt method. Each bar represents the mean relative transcript levels (± SD) from two samples per treatment regimen. Value significantly different at *P < 0.05 when compared to untreated cells value.
Discussion
In the present study, A549 cell function/growth was decreased, and cell levels of caspase-3 and DNA fragmentation were increased, after a 24-h treatment with rhIL-16. As outlined in the reviews by Glass et al. (Citation2006) and Cruikshank and Little (Citation2008), depending on the activation state of the CD4+ cell and the presence/absence of antigen, IL-16 can either cause non-activated CD4+ cells to migrate to a given site and then triggered to proliferate in an antigen-independent manner (as a result of causing the cells to reset to G1 cell cycle phase) OR render the CD4+ cells unresponsive to antigen activation—likely due to CD3 no longer being able to associate with CD4 (that is now bound and cross-linked by the IL-16; Cruikshank et al., Citation1996). This bifurcated effect differs from the earlier-held viewpoint that, in the context of T-lymphocyte proliferation, IL-16 mainly primed the process; several Investigators determined that this priming effect was mediated by an induced upregulation of high-affinity IL-2 receptor-α (CD25) that caused these cells to proliferate rapidly when IL-2 was present (Parada et al., Citation1998; Wilson et al., Citation2004). Thus, the decrements in cell proliferation seen with the A549 cells are in keeping with a select minority of the reported effects of IL-16 on CD4+ T-lymphocytes. In fact, the results here are more in line with those of Zhang and Xu (Citation2002) who noted inhibitory effects on the growth/replication of Jurkat T-lymphoma cells when local concentrations of IL-16 were in the µM—mM range (the doses used in the current studies ranged from 3.8 to 0.38 µM).
The other key finding in that Jurkat study was an increase in apoptosis at the higher IL-16 doses tested. As there, increases in apoptosis-related endpoints (including increases in DNA fragmentation, in caspase-3 levels, and in select pro-apoptotic proteins) were seen here with the A549 epithelial cells. It is known that caspase-3 plays a critical role in a proteolytic cascade in apoptosis signal pathways, is commonly activated by numerous death signals, and cleaves a variety of critical cellular proteins (leading to damage among structural proteins) (Janicke et. al., Citation1998; Zhang et al., Citation1998; Sciaky et al., Citation2000). The noted changes in Bax protein and mRNA expression here provided evidence in support of the role of apoptosis-promoting Bax (Kuo et al., Citation2009) in IL-16-induced apoptosis in these cells. The induction of apoptosis in these cells also now helps to explain the concurrent increase in LDH release in the treated A549 cells. As noted by Kong et al. (Citation2006), losses of plasma membrane integrity can (and often do) arise, in part, from the involvement of caspases activated during apoptotic cascades. Regardless of the causative mechanism, the finding of apoptosis in the IL-16-treated A549 cells is novel; apart from the already-noted studies noting this outcome in lymphocytes, the literature yields no papers dealing with IL-16-induced apoptosis in other cell types.
Because IL-16 is best known as a CD4+ cell chemotactin, it would be expected that the above-noted effects induced in Jurkat cells were moderated by surface CD4 sites acting as IL-16 “receptors”. However, as bronchial epithelial cells do not constitutively express CD4, alternative mechanisms must exist for the A549 cells to respond in the manners they did here. Information gleaned from a series of studies allow us to potentially define a mechanism: (i) using monocytes from CD4 knockout mice, Mathy et al. (Citation2000) proved that CD4 expression was not required for IL-16 to induce its effects; (ii) Qi et al. (Citation2006) showed (in mast cells) that surface CD9 might serve as a “receptor” for IL-16 (i.e., an IL-16R); (iii) Yoshida et al. (Citation2001) noted that epithelial cells (as BEAS-2B cells) responded to IL-16; and (iv) Astuta et al. (Citation1997) found that CD9 was one of 14 markers identified on BEAS-2B cells that had not been previously documented as constitutively expressed by primary lung epithelial cells. Taken together, those studies suggested to us that airway/alveolar epithelial cells could have their functions modulated by IL-16 as a result of a novel (autocrine) mechanism involving IL-16-mediated signaling.
As expected, our results showed that—like BEAS-2B cells—A549 cells expressed CD9. Further, because Murayama et al. (Citation2004) reported that CD9 mediated apoptotic changes in cancer cells, our findings of induced apoptosis (and other IL-16-triggered responses) in the A549 cells lent additional support to our purported mechanism. However, in the studies using anti-CD9 mAb, it was clear that CD9 neutralization failed to stop IL-16-induced effects on caspase-3 activation and had no effect on the other endpoints assessed in these studies. Initially, the one exception to this trend appeared to be the significant modulation of inducible chemotaxis due to the anti-CD9 pre-treatment.
Unfortunately, this lone outcome might have had more to do with the great amount of antibody (Ab) provided to/present on the cells (i.e., 20 μg/ml). “Excessive” binding of an Ab (via its idiotypic [specific] or Fc [NS] regions) to a cell surface is already known to inhibit cell motility (Dahlgren and Elwing, Citation1983). The results of studies here using a NS antibody (of same host species and isotype as the mAb; mouse IgG1) in place of the anti-CD9 product—at the same highest dose of the mAb employed—revealed that the A549 cells appeared to be “overloaded”. A second study using both the mAb and the NS IgG1 to treat cells that were then exposed to a differing chemotactin (i.e., MCP-1) yielded similar “blocking” outcomes. Taken together, the results of these various neutralization studies lead us to conclude, for now, that these lung epithelial cells likely have other receptor(s) to mediate induction of the effects of IL-16.
In summary, our study showed that IL-16 (as rhIL-16) inhibited the growth of, induced chemotaxis by, and induced apoptotic mechanisms in, A549 cells. The studies also revealed that while A549 cells are clearly CD9+, the expressed markers (acting as purported “IL-16R”) were not apparently involved in any of the observed IL-16-mediated effects in these cells. These results strongly suggest to us that these commonly used model lung epithelial cells may have one/more alternate IL-16-binding receptors on their surface to mediate the effect measured here.
Acknowledgement
This project was supported by Tulane Cancer Center.
Declaration of interest
The authors report no conflicts of interest. The authors alone are responsible for the content and writing of the paper.
References
- Akiyama, K., Karaki, M., Kobayshi, R., Dobashi, H., Ishida, T. and Mori, N. 2009. IL-16 variability and modulation by antiallergic drugs in a murine experimental allergic rhinitis model. Int. Arch. Allergy Immunol. 149:315–322.
- Andersson, A., Qvarfordt, I., Laan, M., Sjostrand, M., Malmhall, C., Riise, G.C., Cardell, L.O. and Linden, A. 2004. Impact of tobacco smoke on interleukin-16 protein in human airways, lymphoid tissue and T-lymphocytes. Clin. Exp. Immunol. 138:75–82.
- Arima, M., Plitt, J., Stellato, C., Bickel, C., Motojima, S., Makino, S., Fukuda, T. and Schleimer, R.P. 1999. Expression of interleukin-16 by human epithelial cells. Inhibition by dexamethasone. Am. J. Respir. Cell Mol. Biol. 21:684–692.
- Atsuta, J., Sterbinsky, S.A., Plitt, J., Schwiebert, L.M., Bochner, B.S. and Schleimer, R.P. 1997. Phenotyping and cytokine regulation of the BEAS-2B human bronchial epithelial cell: Demonstration of inducible expression of the adhesion molecules VCAM-1 and ICAM-1. Am. J. Respir. Cell Mol. Biol. 17:571–582.
- Bandeira-Melo, C., Sugiyama, K., Woods, L.J., Phoofolo, M., Center, D.M., Cruikshank, W.W. and Weller, P.F. 2002. IL-16 promotes leukotriene C(4) and IL-4 release from human eosinophils via CD4- and autocrine CCR3-chemokine-mediated signaling. J. Immunol. 168:4756–4763.
- Becker, S. and Soukup, J. 2003. Coarse(PM(2.5-10)), fine(PM(2.5)), and ultrafine air pollution particles induce/increase immune costimulatory receptors on human blood-derived monocytes but not on alveolar macrophages. J. Toxicol. Environ. Health Part A. 66:847–859.
- Boucheix, C., Benoit, P., Frachet, P., Billard, M., Worthington, R.E., Gagnon, J. and Uzan, G. 1991. Molecular cloning of the CD9 antigen. A new family of cell surface proteins. J. Biol. Chem. 266:117–122.
- Cheng, G., Ueda, T., Eda, F., Arima, M., Yoshida, N. and Fukuda, T. 2001. A549 cells can express interleukin-16 and stimulate eosinophil chemotaxis. Am. J. Respir. Cell Mol. Biol. 25:212–218.
- Cruikshank, W.W., Lim, K., Theodore, A.C., Cook, J., Fine, G., Weller, P.F. and Center, D.M. 1996. IL-16 inhibition of CD3-dependent lymphocyte activation and proliferation. J. Immunol. 157:5240–5248.
- Cruikshank, W. and Little, F. 2008. lnterleukin-16: The ins and outs of regulating T-cell activation. Crit. Rev. Immunol. 28:467–483.
- Dahlgren, C. and Elwing, H. 1983. Inhibition of polymorphonuclear leucocyte locomotion by surface-bound antigen-antibody complexes. Immunology 49:329–336.
- De Bie, J.J., Jonker, E.H., Henricks, P.A., Hoevenaars, J., Little, F.F., Cruikshank, W.W., Nijkamp, F.P. and Van Oosterhout, A.J. 2002. Exogenous interleukin-16 inhibits antigen-induced airway hyper-reactivity, eosinophilia and TH2-type cytokine production in mice. Clin. Exp. Allergy. 32:1651–1658.
- Deng, J.M. and Shi, H.Z. 2006. Interleukin-16 in asthma. Chin. Med. J. 119:1017–1025.
- Elssner, A., Doseff, A.I., Duncan, M., Kotur, M. and Wewers, M.D. 2004. IL-16 is constitutively present in peripheral blood monocytes and spontaneously released during apoptosis. J. Immunol. 172:7721–7725.
- Lim, K.G., Wan, H.C., Bozza, P.T., Resnick, M.B., Wong, D.T., Cruikshank, W.W., Kornfeld, H., Center, D.M. and Weller, P.F. 1996. Human eosinophils elaborate the lymphocyte chemoattractants. IL-16 (lymphocyte chemoattractant factor) and RANTES. J. Immunol. 156:2566–2570.
- Glass, W.G., Sarisky, R.T. and Vecchio, A.M. 2006. Not-so-sweet sixteen: The role of IL-16 in infectious and immune-mediated inflammatory diseases. J. Interferon Cytokine Res. 26:511–520.
- Jänicke, R.U., Ng, P., Sprengart, M.L. and Porter, A.G. 1998. Caspase-3 is required for alpha-fodrin cleavage but dispensable for cleavage of other death substrates in apoptosis. J. Biol. Chem. 273:15540–15545.
- Kim, J.T., Gleich, G.J. and Kita, H. 1997. Roles of CD9 molecules in survival and activation of human eosinophils. J. Immunol. 159:926–933.
- Kim, J., Lee, H., Lee, Y., Oh, B.G., Cho, C., Kim, Y., Shin, M., Hong, M., Jung, S.K. and Bae, H. 2007. Inhibition effects of Moutan Cortex Radicis on secretion of eotaxin in A549 human epithelial cells and eosinophil migration. J. Ethnopharmacol. 114:186–193.
- Ko, E.M., Lee, I.Y., Cheon, I.S., Kim, J., Choi, J.S., Hwang, J.Y., Cho, J.S., Lee, D.H., Kang, D., Kim, S.H. and Choe, J. 2006. Monoclonal antibody to CD9 inhibits platelet-induced human endothelial cell proliferation. Mol. Cells 22:70–77.
- Kong, X., Ge, H., Hou, L., Shi, L. and Liu, Z. 2006. Induction of apoptosis in K562/ADM cells by gamma-linolenic acid involves lipid peroxidation and activation of caspase-3. Chem. Biol. Interact. 162:140–148.
- Kuo, H.M., Tsai, H.C., Lin, Y.L., Yang, J.S., Huang, A.C., Yang, M.D., Hsu, S.C., Chung, M.C., Gibson Wood, W. and Chung, J.G. 2009. Mitochondrial-dependent caspase activation pathway is involved in baicalein-induced apoptosis in human hepatoma J5 cells. Int. J. Oncol. 35:717–724.
- Laan, M., Qvarfordt, I., Riise, G.C., Andersson, B.A., Larsson, S. and Lindén, A. 1999. Increased levels of interleukin-16 in the airways of tobacco smokers: Relationship with peripheral blood T-lymphocytes. Thorax 54:911–916.
- Laberge, S., Cruikshank, W.W., Kornfeld, H. and Center, D.M. 1995. Histamine-induced secretion of lymphocyte chemoattractant factor from CD8+ T-cells is independent of transcription and translation. Evidence for constitutive protein synthesis and storage. J. Immunol. 155:2902–2910.
- Laberge, S., Ernst, P., Ghaffar, O., Cruikshank, W.W., Kornfeld, H., Center, D.M. and Hamid, Q. 1997. Increased expression of interleukin-16 in bronchial mucosa of subjects with atopic asthma. Am. J. Respir. Cell Mol. Biol. 17:193–202.
- Little, F.F., Cruikshank, W.W. and Center, D.M. 2001. Il-9 stimulates release of chemotactic factors from human bronchial epithelial cells. Am. J. Respir. Cell Mol. Biol. 25:347–352.
- Little, F.F., Lynch, E., Fine, G., Center, D.M. and Cruikshank, W.W. 2003. Tumor necrosis factor-alpha-induced synthesis of interleukin-16 in airway epithelial cells: Priming for serotonin stimulation. Am. J. Respir. Cell Mol. Biol. 28:354–362.
- Lynch, E.L., Little, F.F., Wilson, K.C., Center, D.M. and Cruikshank, W.W. 2003. Immunomodulatory cytokines in asthmatic inflammation. Cytokine Growth Factor Rev. 14:489–502.
- Massin, F., Rubinstein, E., Faure, G.C., Martinet, Y., Boucheix, C. and Béné, M.C. 2004. Tetraspan and beta-1 integrins expression pattern of the epithelial lung adenocarcinoma cell line A549 and its sensitivity to divalent cations. Cytometry B. Clin. Cytom. 60:31–36.
- Mathy, N.L., Bannert, N., Norley, S.G. and Kurth, R. 2000. Cutting edge: CD4 is not required for the functional activity of IL-16. J. Immunol. 164:4429–4432.
- Murayama, Y., Miyagawa, J., Oritani, K., Yoshida, H., Yamamoto, K., Kishida, O., Miyazaki, T., Tsutsui, S., Kiyohara, T., Miyazaki, Y., Higashiyama, S., Matsuzawa, Y. and Shinomura, Y. 2004. CD9-mediated activation of the p46 Shc isoform leads to apoptosis in cancer cells. J. Cell. Sci. 117:3379–3388.
- NCBI. 2009. CD9 molecule. National Center for Biotechnology Information/Entrez Gene; see http://www.ncbi.nlm.nih.gov/sites/entrez?Db=gene&Cmd=ShowDetailView&TermToSearch=928.
- Nicoll, J., Cruikshank, W.W., Brazer, W., Liu, Y., Center, D.M. and Kornfeld, H. 1999. Identification of domains in IL-16 critical for biological activity. J. Immunol. 163:1827–1832.
- Ovalle, S., Gutiérrez-López, M.D., Olmo, N., Turnay, J., Lizarbe, M.A., Majano, P., Molina-Jiménez, F., López-Cabrera, M., Yáñez-Mó, M., Sánchez-Madrid, F. and Cabañas, C. 2007. The tetraspanin CD9 inhibits the proliferation and tumorigenicity of human colon carcinoma cells. Int. J. Cancer. 121:2140–2152.
- Parada, N.A., Center, D.M., Kornfeld, H., Rodriguez, W.L., Cook, J., Vallen, M. and Cruikshank, W.W. 1998. Synergistic activation of CD4+ T-cells by IL-16 and IL-2. J. Immunol. 160:2115–2120.
- Pinsonneault, S., El Bassam, S., Mazer, B., Cruikshank, W.W. and Laberge, S. 2001. IL-16 inhibits IL-5 production by antigen-stimulated T-cells in atopic subjects. J. Allergy Clin. Immunol. 107:477–482.
- Qi, J.C., Wang, J., Mandadi, S., Tanaka, K., Roufogalis, B.D., Madigan, M.C., Lai, K., Yan, F., Chong, B.H., Stevens, R.L. and Krilis, S.A. 2006. Human and mouse mast cells use the tetraspanin CD9 as an alternate interleukin-16 receptor. Blood. 107:135–142.
- Rumsaeng, V., Cruikshank, W.W., Foster, B., Prussin, C., Kirshenbaum, A.S., Davis, T.A., Kornfeld, H., Center, D.M. and Metcalfe, D.D. 1997. Human mast cells produce the CD4+ T-lymphocyte chemoattractant factor, IL-16. J. Immunol. 159:2904–2910.
- Sciaky, D., Brazer, W., Center, D.M., Cruikshank, W.W. and Smith, T.J. 2000. Cultured human fibroblasts express constitutive IL-16 mRNA: Cytokine induction of active IL-16 protein synthesis through a caspase-3-dependent mechanism. J. Immunol. 164:3806–3814.
- Wilson, K.C., Center, D.M. and Cruikshank, W.W. 2004. The effect of interleukin-16 and its precursor on T-lymphocyte activation and growth. Growth Factors. 22:97–104.
- Wu, D.M., Zhang, Y., Parada, N.A., Kornfeld, H., Nicoll, J., Center, D.M. and Cruikshank, W.W. 1999. Processing and release of IL-16 from CD4+ but not CD8+ T-cells is activation dependent. J. Immunol. 162:1287–1293.
- Yi, T., Kim, H.J., Cho, J.Y., Woo, K.M., Ryoo, H.M., Kim, G.S. and Baek, J.H. 2006. Tetraspanin CD9 regulates osteoclastogenesis via regulation of p44/42 MAPK activity. Biochem. Biophys. Res. Commun. 347:178–184.
- Yoshida, N., Arima, M., Cheng, G., Eda, F., Hirata, H., Honda, K., Fukushima, F. and Fukuda, T. 2001. Interleukin (IL)-4/IL-9 and exogenous IL-16 induce IL-16 production by BEAS-2B cells, a bronchial epithelial cell line. Cell. Immunol. 207:75–80.
- Zhang, X.M. and Xu, Y.H. 2002. The associated regulators and signal pathway in rIL-16/CD4-mediated growth regulation in Jurkat cells. Cell Res. 12:363–372.
- Zhang, Y., Center, D.M., Wu, D.M., Cruikshank, W.W., Yuan, J., Andrews, D.W. and Kornfeld, H. 1998. Processing and activation of pro-interleukin-16 by caspase-3. J. Biol. Chem. 273:1144–1149.
