
Abstract
Immunotherapy is becoming an increasingly attractive therapeutic alternative for conventional cancer therapy. In recent years Foxp3+ regulatory T-cells (TR) were identified as the major obstacle to effective cancer immunotherapy. The abundance of these cells in peripheral blood is increased in patients with multiple types of cancer and their prevalence among tumor-infiltrating lymphocytes correlated with poor clinical prognosis. In contrast, removal or inactivation of TR cells led to enhanced anti-tumor immune response and better efficacy of cancer vaccines. This study reports that Bone Morphogenic Protein Receptor 1α (BMPR1α, Alk-3) is expressed by activated effector CD4+ and TR cells and modulates functions of both cell types. Bone Morphogenic Proteins (BMPs) belong to the transforming growth factor (TGF)-β family of cytokines that also include TGFβ and activins. BMPs play crucial roles in embryonic development, tissue differentiation and homeostasis, and development of cancer. It was demonstrated that BMPs and activins synergize with TGFβ to regulate thymic T-cell development, maintain TR cells, and control peripheral tolerance. Inactivation of BMPR1α in T-cells results in impaired thymic and peripheral generation of TR cells. BMPR1α-deficient activated T-cells produced a higher level of interferon (IFN)-γ than BMPR1α-sufficient T-cells. Moreover, transplanted B16 melanoma tumors grew smaller in mice lacking expression of BMPR1α in T-cells and tumors had few infiltrating TR cells and a higher proportion of CD8+ T-cells than wild-type mice.
Introduction
The immune system not only protects organisms from many types of cancer, but also shapes tumor immunogenicity (Vesely et al., Citation2011). This mutual relationship of the developing tumor and the immune system has been conceptualized as cancer immunoediting. Cancer immunoediting is viewed as a dynamic process where the immune system eliminates most immunogenic tumor cells and tumor cell survival depends on creating an environment that compromises the functions of the immune system. The process of altering the functions of the immune system relies, to a large extent, on the recruitment of cells of the innate and adaptive immune system which acquire immunosuppressive functions (Hanahan & Coussens, Citation2012).
Myeloid and dendritic cells and various sub-sets of regulatory T-cells are among the cell types that compromise adaptive immune responses and prevent eradication of tumors (Gabrilovich et al., Citation2012; Ma et al., Citation2012; Zou, Citation2006). The generation, maintenance, and functions of immune cells in the tumor environment depend on complex interactions between tumor infiltrating cells, neoplastic cancer cells, and tumor stroma. Unraveling those interactions may lead to novel cancer therapies, especially immunotherapies that rely on activation of effector cytotoxic and helper T-cells to eliminate tumors. Increased understanding of how adaptive T-cell functions are regulated in tumors has already led to effective cancer immunotherapies (Pardoll, Citation2012). It has also become apparent that not only cancer immunotherapy but also traditional cancer treatments, relying on surgical tumor removal, chemo-, and/or radiation therapy, depend on effective stimulation of the immune system to completely eradicate tumor cells (Arlen et al., Citation2009; Gray et al., Citation2009; Muranski & Restifo, Citation2009). Immune response against tumor antigens, that frequently are self-antigens, depends on overcoming mechanisms of peripheral tolerance and is often compromised by inefficient T-cell activation or anergy induction. In recent years, Foxp3+ regulatory T-cells (TR) that mediate immune tolerance by an active, and largely unknown, mechanism were identified as the major obstacle to effective cancer immunotherapy and their increased number in patients’ blood was correlated with poor prognosis (Curiel et al., Citation2004; Josefowicz et al., Citation2012; Nishikawa et al., Citation2005; Sakaguchi et al., Citation2001). The success of current immunotherapy protocols depends on designing new strategies to control the generation and suppressor function of TR cells (Quezada et al., Citation2010; Topalian et al., Citation2012).
To identify molecules that control suppressor functions of TR cells, we compared gene expression profiles of resting and activated conventional and TR cells. We found that Bone Morphogenic Protein Receptor 1α (BMPR1α, Alk-3) was up-regulated by activated conventional CD4+ and TR cells. Gene chip studies did not show expression of BMPR1β or BMPR2, two other BMP receptors, to be changed.
Bone Morphogenic Proteins (BMP) belong to the transforming growth factor (TGF)-β family of cytokines that also includes TGFβ and activins (Hinck, Citation2012; Poorgholi et al., Citation2012). BMP play crucial roles in embryonic development, tissue differentiation, and homeostasis and development of cancer (Guo & Wang, Citation2009). They regulate various biological processes including cell proliferation, differentiation, apoptosis, migration, and adhesion, and are involved in the development of multiple tissues and organs, including thymocytes (Graf et al., Citation2002). BMP are required for normal thymus development and BMPR1α expressed by thymocytes and CD4+ T-cells is essential for BMP2/4 signaling during thymic development and in the periphery (Licona-Limon & Soldevila, Citation2007; Sivertsen et al., Citation2007). In TR cells, signaling through BMPR1α synergizes with TGFβ to sustain TR cell phenotype and suppressor function (Fantini et al., Citation2004; Marie et al., Citation2005). BMP, as well as activins, enhance TGFβ-induced up-regulation of Foxp3 in conventional CD4+ T-cells and generation of adaptive TR cells (aTR) (Huber et al. Citation2009; Lu et al., Citation2010).
In these studies, we sought to find new molecules that could regulate suppressor function of TR cells. The data obtained showed that mice whose BMPR1α gene was removed in T-cells at the double-positive stage in the thymus (BMPR1αT− mice) produced less TR cells in the thymus and their remaining TR cells expressed lower levels of Foxp3. Further, we saw that BMPR1α-deficient T-cells produced more interferon (IFN)-γ when activated in vitro. Lastly, it was noted that transplantable melanoma tumors grew slower in BMPR1αT− mice, and these were largely devoid of TR cell infiltrates. In summary, these results suggested to us that BMPR1α controls activation of effector and TR cells and that blocking of its function may potentiate immune responses during cancer.
Materials and methods
Mice
Foxp3GFP reporter mice on the C57BL6 genetic background were generated in our laboratory (Kuczma et al., Citation2009b). Foxp3GFP reporter mice were crossed with CD4-cre (Taconic, Germantown, NY) and BMPR1αloxP (gift of Dr Thistlethwaite, UCSD, San Diego, CA) conditional knockout mice to produce mice where expression of BMPR1α was abrogated specifically in T-cells (BMPR1αT− mice) (Lee et al., Citation2001; Mishina et al., Citation2002). Full details of the study and all procedures performed on animals were approved by the Institutional Animal Care and Use Committee of the Georgia Regents University (approval #09-06-213) and complied with all state, federal, and NIH regulations.
All mice were maintained in specific pathogen-free facilities maintained at 29 °C with a 65% relative humidity and a 12-h light:dark cycle. All mice had ad libitum access to standard rodent chow and filtered water throughout the studies. In all cases, to obtain tissues/cells from the various hosts, CO2 asphyxiation was used as the method of euthanasia.
Cell purification, flow cytometry, and cell sorting
Single-cell suspensions were prepared from thymi, spleens, and lymph nodes by mechanical disruption and cells were stained with antibodies available commercially (eBioscience [San Diego, CA], BioLegend [San Diego, CA], or BD Biosciences [San Jose, CA]). Tumor-infiltrating lymphocytes (TIL) were prepared from tumor lesions by scrubbing tumor tissue into phosphate-buffered saline (PBS, pH 7.4) containing 0.1 M EDTA. B16 cell suspension (107 cells/ml) was then overlaid atop 5 ml of a Lympholyte-M (Cederlane, Burlington, NC) gradient and spun at 2300 × g for 20 min at 24 °C. The cells at the interphase were then collected and, after washing with Hanks’ Balanced Salt Solution (HBSS; Cellgro, Manassas, VA), 3 × 10⁵ cells were stained on ice in the dark for 30 min with monoclonal antibodies (0.02 µg each) for flow cytometry analysis and sorting. Cells were analyzed using a FACSCanto flow cytometer (Becton Dickinson, San Jose, CA) and associated FACSDiva software. Cells were also sorted on a MoFlo cell sorter (Cytomation, Fort Collins, CO). A minimum of 100 000 events per sample was acquired. Purity of sorted populations routinely exceeded 98.5%.
Proliferation assay and T-helper (TH) cell generation
Lymph node proliferation assays were performed with 3–5 × 10⁴ cells isolated from Foxp3GFP or BMPR1αT− mice. Cells were sorted using the MoFlo sorter and then cultured in complete Minimal Essential Medium (MEM; Cellgro) containing 10% fetal bovine serum (FBS, Hyclone, Rockford, IL), penicillin/streptomycin, and β-mercaptoethanol at 37 °C for 3 days in the wells of 96-well plates that had been coated overnight with anti-CD3 (10 µg/ml) and anti-CD28 (1 µg/ml) antibodies (each eBioscience, San Diego) using standard protocols (Kuczma et al., Citation2009b). Proliferation responses were subsequently measured by adding [3H]-thymidine (1 µCi/well; Moravek Biochemicals, Brea, CA) on day 3 of the 4-day culture. Cells were then harvested on glass fiber filters (Perkin Elmer, Waltham, MA) and incorporated [3H] assessed using a MicroBeta Liquid scintillation counter (Perkin-Elmer, Waltham, MA).
To induce TH1 differentiation, cells were stimulated as above in the presence of anti-IL-4 anti-body (10 µg/ml, eBioscience) and IL-12 (10 ng/ml, Peprotech, Rocky Hill, NJ). For TH2 differentiation, cells were stimulated in the presence of IL-4 (1000 U/ml, Peprotech), anti-IFNγ (10 µg/ml, eBioscience), and anti-IL-12 (10 µg/ml, eBioscience) antibodies. Finally, for TH17 priming, cells were stimulated in the presence of TGFβ (3 ng/ml) and IL-6 (20 ng/ml) (both Peprotech). The treated cells were cultured for 4 days.
Proliferation inhibition assay
Sorted CD4+Foxp3GFP− cells (5 × 10⁴/well) were incubated in a 96-well plate with irradiated splenocytes from T-cell-deficient mice (TCRα chain knockout mice) (5 × 10⁴/well, 3000 Rad) and soluble anti-CD3 (5 µg/ml). Sorted CD4+Foxp3GFP+ cells (2.5 × 10⁴/well) were added to each culture. After 3-day of culturing, proliferation among the cells was measured by adding 1 µCi [3H]-thymidine to each well and then processing the cultures as outlined above.
RT-PCR
RNA was isolated from sorted cells using an RNeasy Mini Kit (Qiagen, Valencia, CA) and reverse-transcribed using a Superscript kit (Invitrogen, Grand Island, NY) according to manufacturer instructions. Quantities of cDNA were normalized for β-actin. The primers used for amplification were: BMPR1α: fwd: GCCCAGATGATGCTATTAATAACAC, rev: GGATGCTGCCATCAAAGAACGGAC; BMP2: fwd: TTGAGGCTGCTCAGCATGTTTGGC, rev: TGGTGTCCAATAGTCTGGTCACAGG; BMP4: fwd: ACACTTCTACAGATGTTTG-GGCTGC, rev: ACCTCATTCTCTGGGATGCTGCTGAG; BMP7:fwd: ACCTCTTCTTGCTG-GACAGCCGCACC, rev: TTGGTGGCGTTCATGTAGGAGTTCAG; and β-actin: fwd: CTA-GGCACCAGGGTGTGATGGT, rev: CTCTTTGATGTCACGCACGATTTC. All primers were obtained from Invitrogen.
Cytokine detection
Cytokine production (specifically IFNγ) by CD4+ T-cells from wild-type Foxp3GFP reporter and BMPR1αT− mice was measured by using commercial ELISA kits (eBioscience), following manufacturer instructions. For this, 2 × 10⁵ cells were placed into 96-well plates and stimulated with anti-CD3 and anti-CD28 antibodies that were coating the well walls (as outlined above). Samples supernatants were collected after 30 h of culture and then assessed (in triplicate) for IFNγ. Level of sensitivity of the kit was 15 pg IFNγ/ml.
Tumors
The mouse melanoma cell line B16F1 was obtained from ATCC (Manassas, VA) and maintained in culture in complete MEM medium. To produce tumors, B16 melanoma cells (5 × 10⁴) were injected subcutaneously into the upper inside portion of both thighs of 6–8-week-old Foxp3GFP or BMPR1αT− mice. Tumor size was assessed every second day staring at Day 8 after injection; the animals were euthanized at Day 17 and tumors and lymph nodes from each were recovered for analyses.
Microarray analysis
TR and conventional CD4+ T-cells from scurfy mice (SfFoxp3GFP) and Foxp3GFP mice were analyzed in triplicate (Kuczma et al., Citation2009b). RNA was prepared from sorted cell sub-sets using the RNeasy kit (Qiagen). RNA was amplified using the TargetAmp kit (Epicentre, Madison, WI). The resulting cRNA was hybridized to Affymetrix GeneChip M430 2.0 Plus (Santa Clara, CA).
Microarray data were first normalized using RMA and subsequently analyzed using LIMMA (Bolstad et al., Citation2003; Smyth, Citation2004). We analyzed all arrays as a factorial experiment in which cell type (conventional of TR cell) was one factor and cell status (resting versus activated) was a second factor, along with the interaction of cell type and cell status. Genes differentially-expressed in activated conventional and TR cells were those found significant for the interaction, regardless of significance for the main effects. Genes with no significant interaction and no significant response to activation, but having a significant difference between conventional and TR cell, were those that are cell-type specific, regardless of activation status. Genes with no significant interaction and no significant difference between cell types, but having a significant difference between resting and activated cells, were those that responded to activation equally in both conventional and TR cells, with no differences between cell types. The advantage to LIMMA is that the B statistic (log posterior odds of differential expression) used in this analysis quantified evidence for the alternate hypothesis versus the evidence for the null hypothesis. Since B is on a log scale, a B of 0 indicated both the alternate and null hypotheses were equally likely. If the B statistics were positive, then the evidence supported the alternative hypothesis of some difference; a negative B supported the null hypothesis. The advantage of the B-statistic was that it accurately ranked the genes in order of likelihood of being differentially expressed. Choosing a cut-off for B, however, was just as challenging as using any other statistic. We called all genes with a B ≥ 1.5 significant, since the evidence for the alternative would no longer be considered weak. This choice of cut-off also seemed reasonable as the q values (expected false discovery rates) for those genes we called significant were ≈0.01.
Statistical analysis
The significance of differences between samples or groups of mice was determined using a paired one-tailed Student’s t-test. Differences between samples with p values ≤0.05 were considered significant.
Results
Identification of genes preferentially up-regulated in activated TR cells
TR cells have to be activated through the TCR in an antigen-specific way to suppress immune responses. We reasoned that T-cell activation, which changes expression of genes controlling proliferation and phenotypic markers, also incites a genetic program that directs acquisition of suppressor functions. To identify genes that control TR cell suppressor functions, we compared global gene expression profiles of resting and activated conventional CD4+ T-cells, in vitro generated adaptive regulatory T-cells (aTR) cells, and resting and activated natural TR (nTR) cells. Pure populations of resting CD4+CD44−CD62L+ Foxp3GFP− conventional and nTR Foxp3GFPhi cells were sorted on a flow cell sorter and RNA was isolated. To generate aTR cells, sorted naive CD4+ T-cells were stimulated with plate-bound anti-CD3/anti-CD28 antibodies in the presence of TGFβ and interleukin (IL)-2. After 4 days, aTR cells (cells that up-regulated GFP) were re-sorted and used for RNA isolation. To examine gene expression in activated conventional T-cells, a population of CD4+CD44+CD62L−Foxp3GFP− cells was sorted from Foxp3GFP scurfy mice with advanced autoimmune disease (Kuczma et al., Citation2009b). Sorted CD4+Foxp3GFPhi cells were stimulated in vitro with plate-bound anti-CD3/anti-CD28 antibodies and IL-2 for 4 days and used as activated TR cells. RNA was prepared from sorted cell sub-sets and gene expression was analyzed on Affymetrix GeneChip.
We analyzed resting and activated conventional and nTR cells as a factorial experiment in which cell status (resting versus activated) was one factor and cell type (conventional CD4+ versus nTR) was a second factor, along with the interaction of cell status and cell type. Genes whose response was activation-dependent were those found significant for the interaction, regardless of significance for the main effects. Genes with no significant interaction and no significant response to activation, but having a significant difference between cell types, are those that were cell type-specific, regardless of activation status. Genes with no significant interaction and no significant difference between resting and activated cells, but having a significant difference between TR and conventional CD4+ T-cells, were those that respond to activation equally in both cell types. Genes with statistically significant differences in expression levels were identified. In addition to a factorial analysis described above, we conducted a 3-way comparison of differentially-expressed genes in resting and activated conventional CD4+ T-cells and aTR cells. shows the result of the factorial and 3-way analyses and includes genes with >3-fold difference of expression. Venn diagrams show how many genes were differentially expressed depending on the cell populations, activation status, and possible interaction between experimental factors. Differentially-expressed genes are listed in Supplemental Data Set 1.
Figure 1. Transcriptional profile of resting and activated conventional (Tconv) and TR CD4+ T-cells. (a) Venn diagram of genes differentially-expressed in activated versus resting cells and TR versus Tconv cells. Shaded circle includes genes showing an interaction effect, suggesting that expression of genes in Tconv and TR cells depends on activation status and cell type. Plots inside the Venn diagram show examples of possible gene expression profiles in each section of the diagram. ‘+’ denotes Foxp3GFP+ (TR cells), ‘−’ denotes Foxp3GFP− (Tconv cells), ‘Act’ denotes activated and ‘Rest’ denotes resting T-cells. (b) Venn diagram of genes differentially-expressed in adaptive aTR and resting and activated Tconv cells. Right upper circle = genes differentially-expressed between activated and resting Tconv cells; lower circle = genes differentially-expressed between aTR and resting Tconv cells; left upper circle = genes differentially-expressed between activated Tconv and aTR cells.
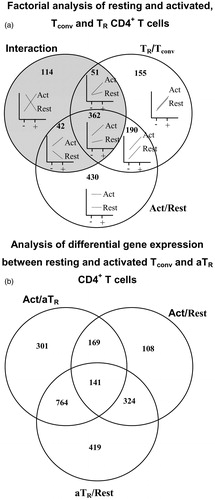
The number of differentially expressed genes (>3-fold) between activated nTR and aTR cells was 617. Factorial analysis () shows that 155 genes were differentially expressed between conventional and nTR cells, regardless of activation status. Expression of 190 genes changed in the same manner between conventional and nTR cells when they were activated and for 362 genes, expression depended on cell type (shows interaction between cell type and status). Expression of 430 genes was different between activated and resting cells, regardless of cell type (conventional and TR). Comparison of gene expression in resting, activated, and aTR cells identified 419 genes differentially-expressed between resting and aTR cells that were not differentially-expressed when activated and aTR cells were compared, and when activated and resting T-cells were compared (). This set of genes was combined with genes identified in the factorial analysis. One of the genes, i.e. BMPR1α, was selected for further analysis based on the reports indicating the importance of BMPs in controlling cellular differentiation.
Expression pattern of BMPR1α and its ligands in peripheral T-cells
To corroborate microarray data, we investigated BMPR1α expression in resting and in vitro activated conventional and TR cells using RT-PCR (). In normal, healthy mice low levels of BMPR1α are found only in nTR cells expressing a high level of Foxp3. This sub-set of TR cells was earlier found to have a stable suppressor phenotype (Kuczma et al., Citation2009a). BMPR1α is up-regulated upon in vitro activation in helper CD4+ T-cells, but not in cytotoxic cells, and is further up-regulated in nTR cells and T-cells converted to become aTR cells. To determine which T-cell populations expressed BMPR1α in mice undergoing immune responses, Foxp3GFP reporter mice were immunized with Staphylococcal enterotoxin B. Analysis of T-cell subsets sorted from the experimental mice showed that the BMPR1α expression pattern was consistent with CD4+ T-cell subsets activated in vitro. Low-level BMPR1α was expressed in activated helper T-cells and much higher levels in TR cells. BMPR1α was also expressed in a population of activated human CD4+ T-cells, especially in the presence of TGFβ. In conclusion, the expression pattern of BMPR1α suggested to us that its main function was to regulate functions of activated TR cells and generation of aTR cells.
Figure 2. BMPR1α expression in T-cell sub-sets. (a) BMPR1α expression in resting conventional CD4+ T-cells (Tc), TR cells expressing low (TR Fp3lo) and high (TR Fp3hi) levels of Foxp3, cells activated with anti-CD3/anti-CD28 Ab (actTc), adaptive TR cells (aTR), and activated TR cells expressing low (actTR Fp3lo) and high (actTR Fp3hi) level of Foxp3. (b) BMPR1α expression in vivo in resting CD8+ T-cells (Tc), activated CD8+ T-cells (actTc), and in activated CD8+ T-cells isolated from tumor draining lymph nodes (DrTc). Positive control (+Ctrl) is BMPR1α expression in RM-1 cells. (c) BMPR1α expression in CD4+ T-cells activated in vivo by injecting Foxp3GFP mice with SEB. RT-PCR analysis was done on activated CD4+CD44+CD62L−Foxp3GFP− (actTc), naive CD4+CD44−CD62L+Foxp3GFP− T-cells (Tc), and TR cells expressing low (actTR Fp3lo) and high (actTR Fp3hi) levels of Foxp3. (d) Expression of BMPR1α ligands BMP2 and BMP7 in T-cells activated to generate TH1, TH2, and TH17 cells and in in vitro activated TR cells expressing low and high levels of Foxp3.
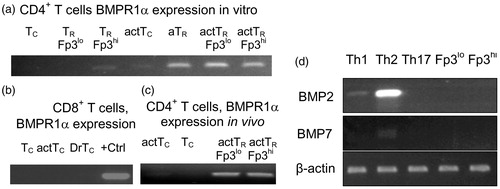
BMPs are involved in regulating cellular differentiation and functions by establishing local gradients. Therefore, we examined if activated T-cells could produce BMP that could be involved in autocrine signaling loops. We saw that BMPR1α ligands, i.e. BMP2, 4, and 7, were not produced by naive T-cells (). Low levels of BMP2 were produced by CD4+ T-cells activated to become T-helper (TH)-1 cells and high levels produced by cells activated to become TH2 cells. Low levels of BMP7 were produced by CD4+ T-cells activated to become TH2 cells. We did not detect BMP4 in activated CD4+ T-cells. These results suggested that expression of BMPs strongly depended on activation status of helper T-cells.
BMPR1α was necessary for thymic generation of TR cells, but not conventional T-cells
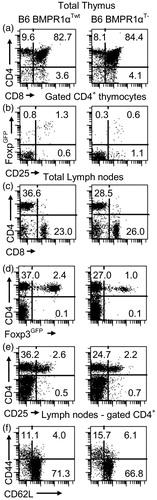
To further evaluate the possible role of BMPR1α in T-cells, we generated mice with a T-cell-specific deletion of this gene. BMPR1α conditional knockout mice, prepared by flanking the kinase domain of the receptor with loxP sites (BMPR1αloxP mouse), were crossed to CD4-cre mice expressing cre recombinase in T-cells, starting at the stage of double positive thymocytes (Lee et al., Citation2001; Mishina et al., Citation2002). In addition, we introduced Foxp3GFP reporter transgene into CD4-cre/BMPR1αloxP/loxP mice to tag TR cells with the GFP (Kuczma et al., Citation2009b). Mice transgenic for CD4-cre and Foxp3GFP and homozygous for BMPR1αloxP/loxP allele (BMPR1αT− mice) had normal numbers/proportions of double- and single-positive thymocytes and normal or only slightly lower numbers of conventional peripheral CD4+ and CD8+ T-cells (Supplemental Data Set 2). In contrast to conventional T-cells, thymic generation of TR cells was impaired and BMPR1αT− mice had only a small population of peripheral TR cells (). BMPR1αT− mice had a moderately expanded population of activated/memory T-cells.
Figure 3. Characterization of BMPR1αT− mice. Panels in the left column are normal Foxp3GFP mice on a C57BL6 genetic background (BMPR1αTwt) and in the right column are BMPR1αT− mice. (a, c) CD4 and CD8 expression on thymocytes and lymph node cells. (b) CD25 and Foxp3 expression on gated CD4+ thymocytes. (d, e) Analysis of CD4 and Foxp3 or CD25 expression on lymph node cells. (f) Expression of activation markers CD44 and CD62L on gated CD4+ lymph node cells. Cells ware stained with indicated antibodies and numbers show percentage of cells in each quadrant of dot-plot. A representative experiment of three (each experiment used 2–3 mice) each is shown.
Lack of BMPR1α expression affected proliferation/functions of peripheral conventional and TR cells
To test how BMPR1α deficiency affects peripheral, mature T-cells we sorted naive CD4+ T-cells from BMPR1αT− mice and stimulated them in vitro. The results indicated that BMPR1α-deficient T-cells proliferated equally or slightly better than cells expressing BMPR1α ().
Figure 4. Proliferation and IFNγ production by CD4+ T-cells from BMPR1αTwt (WT, rare dots) and BMPR1αT− (KO, dense dots) mice. (a) Sorted naive CD4+ T-cells were incubated in a 96-well plate without (Columns 1, 2) or with (Columns 3, 4) plate-bound anti-CD3/anti-CD28 antibodies for 4 days and proliferation was measured via [3H]-thymidine incorporation. (b) IFNγ production (ELISA) by conventional CD4+ T-cells stimulated in vitro with plate-bound anti-CD3/anti-CD28 antibodies. All experiments were repeated four times. Columns represent mean values (± SD). Samples were compared using a Student’s t-test. *Statistically significant differences between samples.
![Figure 4. Proliferation and IFNγ production by CD4+ T-cells from BMPR1αTwt (WT, rare dots) and BMPR1αT− (KO, dense dots) mice. (a) Sorted naive CD4+ T-cells were incubated in a 96-well plate without (Columns 1, 2) or with (Columns 3, 4) plate-bound anti-CD3/anti-CD28 antibodies for 4 days and proliferation was measured via [3H]-thymidine incorporation. (b) IFNγ production (ELISA) by conventional CD4+ T-cells stimulated in vitro with plate-bound anti-CD3/anti-CD28 antibodies. All experiments were repeated four times. Columns represent mean values (± SD). Samples were compared using a Student’s t-test. *Statistically significant differences between samples.](/cms/asset/006373e7-033f-422d-b2b9-8db2fb625423/iimt_a_864736_f0004_b.jpg)
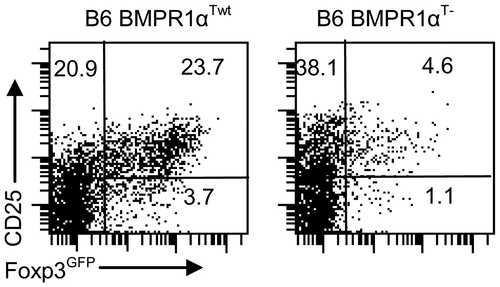
Expression of BMPR1α in activated cells indicates that it may regulate generation of effector CD4+ T-cells. In fact, when T-cells were activated, BMPR1α-deficient T-cells produced more IFNγ (). In contrast, when cells that were BMPR1α deficient were stimulated in the presence of TGFβ and IL-2, the generation of aTR cells was impaired (). This result demonstrated that lack of signaling through the BMPR1α receptor differentially affected T-cell activation, promoting effector TH1 cells and inhibiting generation of aTR cells.
Figure 5. Naive sorted CD4+ T-cells from BMPR1αT− mice do not efficiently convert into aTR cells when stimulated with anti-CD3/anti-CD28 antibodies in the presence of TGFβ (3 ng/ml) and IL-2 (50 U/ml) for 3 days. The experiment was repeated at least three times.
To test how Foxp3+ T-cells from BMPR1αT− mice control T-cells activation, a proliferation inhibition assay was performed. As can be seen, TR cells isolated from BMPR1αT− mice were less effective in controlling proliferation of responder T-cells than corresponding cells from wild-type mice (). Using responder cells from BMPR1α-deficient and -sufficient mice, it was demonstrated that decreased inhibition of cell proliferation depended on reduced TR suppression and not on resistance of BMPR1α-deficient responder cells to TR cell-mediated suppression. Thus, these experiments revealed that BMPR1α signaling differentially affected proliferation of effector cells and regulated CD4+ T-cell activation by promoting TR cell generation.
Figure 6. Proliferation inhibition assay. CD4+Foxp3GFP− responder cells (Resp) (4 × 10⁴/well) and TR cells (2 × 10⁴/well) from BMPR1αTwt (WT) or BMPR1αT− (KO) mice cells were stimulated with soluble anti-CD3 antibody (5 µg/ml) in the presence of irradiated splenocytes (5 × 10⁴/well, 3000 Rad). After culturing cells for 3 days, 1 µCi [3H]-thymidine/well was added and proliferation then measured. The percentage proliferation was calculated by comparing proliferation readings from a well with responder cells only to that from a well containing both responder and TR cells. The plot shows a representative experiment (of four). Columns represent mean values (±SD). Samples were compared using s Student’s t-test. *Values between samples of WT and KO mice marked were significantly different at p ≤ 0.05.
![Figure 6. Proliferation inhibition assay. CD4+Foxp3GFP− responder cells (Resp) (4 × 10⁴/well) and TR cells (2 × 10⁴/well) from BMPR1αTwt (WT) or BMPR1αT− (KO) mice cells were stimulated with soluble anti-CD3 antibody (5 µg/ml) in the presence of irradiated splenocytes (5 × 10⁴/well, 3000 Rad). After culturing cells for 3 days, 1 µCi [3H]-thymidine/well was added and proliferation then measured. The percentage proliferation was calculated by comparing proliferation readings from a well with responder cells only to that from a well containing both responder and TR cells. The plot shows a representative experiment (of four). Columns represent mean values (±SD). Samples were compared using s Student’s t-test. *Values between samples of WT and KO mice marked were significantly different at p ≤ 0.05.](/cms/asset/ca63d494-fc52-4935-b5f8-545f05a8d036/iimt_a_864736_f0006_b.jpg)
BMPR1α expression modulated immune responses in tumor-bearing mice
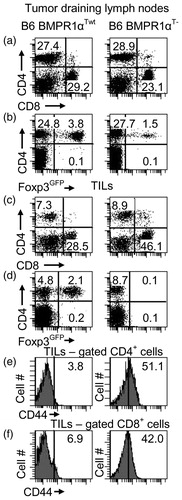
Data obtained so far, i.e., reduced numbers of TR cells and biased production of TH1 cells, led us to examine how expression of BMPR1α modulated immune responses during/to cancer. Specifically, we investigated tumor growth in BMPR1αT− mice inoculated with B16 melanoma cells. We noted that melanoma tumors grew slower in BMPR1αT− mice compared to wild-type counterparts (). Tumor infiltrates in BMPR1αT− mice had higher proportions of CD8+ T-cells and more T-cells with up-regulated CD44 expression (). In addition, the infiltrates in BMPR1αT− mice were devoid of TR cells that were still present in the draining lymph nodes of the same mice. This finding suggested that BMPR1α might regulate generation and/or migration of TR cells into tumors. Since CD8+ T-cells do not express BMPR1α, it is likely the better expansion of these cells into the tumor tissue and the higher activation marker expression resulted from a lack of inhibition by TR cells and not a lack of direct influence of BMPs (data not shown).
Figure 7. Size of B16 tumors growing in BMPR1αTwt (•) and BMPR1αT− (—) mice inoculated with B16 melanoma cells (5 × 10⁴ cells, subcutaneously). Nine mice were analyzed in each series. Two measurements [mm] of each tumor (at the largest dimensions, perpendicular to each other) were taken and multiplied (y-axis). The duration of tumor growth is shown on the x-axis. The plot shows average values (±SD) for each timepoint. Differences in tumor sizes between BMPR1αTwt and BMPR1αT− mice were statistically significant for all time-points (p ≤ 0.05). One experiment of two is shown.
![Figure 7. Size of B16 tumors growing in BMPR1αTwt (•) and BMPR1αT− (—) mice inoculated with B16 melanoma cells (5 × 10⁴ cells, subcutaneously). Nine mice were analyzed in each series. Two measurements [mm] of each tumor (at the largest dimensions, perpendicular to each other) were taken and multiplied (y-axis). The duration of tumor growth is shown on the x-axis. The plot shows average values (±SD) for each timepoint. Differences in tumor sizes between BMPR1αTwt and BMPR1αT− mice were statistically significant for all time-points (p ≤ 0.05). One experiment of two is shown.](/cms/asset/805c6e2f-e898-469e-b9c4-ed940295f906/iimt_a_864736_f0007_b.jpg)
Figure 8. T-cell populations. T-cell levels in (a–d) tumor draining lymph nodes and (e, f) tumors of tumor-bearing BMPR1αTwt (left column) and BMPR1αT− (right column) mice. (a) CD4 and CD8 T-cell populations in tumor draining lymph nodes. (b) Foxp3 expression on CD4+ T-cells in tumor draining lymph nodes. (c) CD4 and CD8 T-cell populations in tumor-infiltrating cells. (d) Foxp3 expression on CD4+ T-cells in tumors. (e, f) CD44 expression on gated CD4+ and CD8+ T-cells in tumors. The plot shows a representative experiment (of three).
Discussion
TR cells were found to inhibit effector cells in many cancers including melanoma, and depletion of TR cells slowed down tumor growth (Jones et al., Citation2004; Tanaka et al., Citation2002; Viguier et al., Citation2004). To devise strategies to modify TR suppressor function, we compared global gene expression profiles of naive and activated conventional T-cells, aTR cells, and both resting and activated nTR cells. The goal was to identify molecules expressed in activated TR cells and also involved in TR cell suppressor functions that could represent targets for anti-tumor therapy. We found that ≈300 genes were differentially expressed between activated conventional and TR cells, making this gene set a potential target for selective manipulation of only one cell type. One of these genes was BMPR1α, a receptor for BMP 2, 4, and 7. BMP are multi-functional regulatory proteins that belong to the TGFβ superfamily and control a diverse array of normal cellular and physiological processes including growth arrest, apoptosis, and cell differentiation (Chen et al., Citation2004). BMPs are involved in embryogenesis, angiogenesis, and cancer, and have been investigated for their use as potential therapeutics (He et al., Citation2004; Guo & Wang, Citation2009; Senta et al., Citation2009). BMPs are produced by many cell types, including tumor stromal cells, neoplastic cells, and various cells of the innate and adaptive immune system. Dysregulation of BMP signaling leads to developmental defects and has been seen in multiple cancers including juvenile polyposis, melanoma, and prostate cancer (Doak et al., Citation2007; Rothhammer et al., Citation2005; Shola et al., Citation2012). In the immune system, BMP signaling is involved in development of the thymus and T-cells (Bleul & Boehm, Citation2005; Hager-Theodorides et al. Citation2002).
BMPs bind to the extracellular domain of BMP Type I receptors that are serine/threonine kinase receptors (also called Alk1, Alk2, Alk3, or BMPR1α and Alk6 or BMPR1β). Type I receptors interact with Type II receptors (BMPR2) or activin receptors (ActR-IIA or ActR-IIB) to form heteromeric receptor-ligand complexes. Ligand binding to Type I receptors leads to transphosphorylation by Type II receptors, receptor oligomerization, and signal transduction. Activated BMPRI, in turn, phosphorylate transcription factor Smads 1, 5, and 8, promoting their translocation to the nucleus where they form a complex with Smad4 and regulate gene expression via interactions with multiple transcription factors. In many cell types, signaling pathways initiated by ligand binding to BMPR1α intersect with multiple other pathways including those important for TR cell generation and function (like Wnt, Akt/mTOR, Notch); however, the extent of these interactions in T-cells is not well known (Itasaki & Hoppler, Citation2010; Poorgholi et al., Citation2012; Tian et al., Citation2005). In mature T-cells, inhibition of signaling through BMP was found to produce complex effects that included inhibition of TH17 cell differentiation and IL-2 production (Yoshioka et al., Citation2012). BMP and activins augment TR cells generation, acting synergistically with TGFβ (Huber et al., Citation2009; Itasaki & Hoppler, Citation2010; Lu et al., Citation2010).
Using phenotypic and functional analyses, the role of BMP and BMPR1α in T-cell ontogeny and in regulating functions of mature T-cells was further defined. Further, using a novel conditional knockout mouse model, it was shown that inhibition of BMPR1α in double-positive thymocytes selectively inhibited TR cell development in the thymus. While development of conventional T-cells in BMPR1αT− mice was not affected, the functional status of activated cells changed, since only activated cells express BMPR1α and become sensitive to BMPs. Peripheral CD4+ T-cells from BMPR1αT− mice preferentially generated TH1 effector cells and only poorly differentiated into aTR cells. This last result is consistent with a report showing synergy between TGFβ and BMP2/4 (two ligands of BMPR1α) in cells up-regulating Foxp3 and producing aTR cells (Lu et al., Citation2010). Considering that BMPR1α is expressed in CD4+ T-cells on antigen stimulation, one may postulate this molecule is involved in lineage choices between generating a suppressor versus a helper T-cell. This might be relevant in tumors where many cell types produce BMP. Among T-cells, TH2 cells -- generally considered detrimental for effective immune responses during/to cancer -- were found to produce the highest levels of BMP. Thus, BMPR1α might be an element of the immunosuppressory signaling circuit that operates in tumors (Biggs & Eiselein, Citation2001; Muranski & Restifo, Citation2009). In conclusion, this and previous reports support the role of BMPR1α in regulating a balance between immune responses and their suppression. Collectively, our data show that blocking BMPR1α will skew immune response towards cell populations favored for effective anti-tumor response.
While development of TR cells in BMPR1αT− mice was impaired, these mice did not suffer acute autoimmune diseases; this indicated at least some TR cell function was pre-served. Proliferation inhibition assays prepared using various combinations of TR and responder cells demonstrated that, while BMPR1α-deficient TR cells have decreased suppressor capacity, BMPR1α-deficient effector CD4+ T-cells remained susceptible to inhibition by TR cells. This finding suggests that, by eliminating signaling through the BMPR1α in early stages of CD4+ T-cell activation, no aberrant effector cells are produced which could escape immune regulation.
To examine what was the significance of eliminating BMPR1α for an immune response to/during cancer, we investigated tumor growth in BMPR1αT− mice. B16 melanoma tumors grew slower in BMPR1αT− mice and tumor infiltrating CD4+ and CD8+ T-cells had higher expression of activation marker CD44. A surprising result was the very low proportion or lack of Foxp3GFP+ T-cells in tumor infiltrate. This suggested that BMPR1α controlled migration of TR cells into tumors and/or expansion of these cells. Signaling circuits in T-cells downstream of BMPR1α are currently not known, but BMPR1α may control expression of cytokine receptors that mediate recruitment and migration of hematopoietic cells into tumors (Curiel et al., Citation2004). Smad transcription factors were found to interact with factors of the forkhead family that control expression of CD62L and CCR7 that regulate T-cell homing (Arden, Citation2004; Kerdiles et al., Citation2009). Alternatively, BMPR1α may regulate Foxp3 expression in TR cells. We have identified multiple Smad1/5/8 binding sites in the promoter and enhancer regions of the Foxp3 gene. One of these sites is adjacent to Smad 2/3 site in the CNS2 region of the enhancer that is responsible for the stabilization of Foxp3 expression in TR cells (Tone et al., Citation2008; Zheng et al., Citation2010).
The expression pattern and the role of BMPR1α suggest that this molecule may be targeted to skew immune response towards effector T-cell sub-sets known to inhibit tumor growth. The potential risk associated such modulation of immune system for therapy of cancer is development of autoimmunity. The best studied autoimmune reactions occurred in humans and experimental mice treated for melanoma, but the symptoms were rather mild, i.e., vitiligo, and limited to tumor cell precursors, melanocytes (Engelhard et al., Citation2002; Overwijk et al., Citation1999). The limited insight into BMPR1α function makes it difficult to assess the potential of severe/generalized autoimmunity as a result of targeting this molecule. Since the BMPR1α is not expressed in resting T-cells, inhibiting its signaling would be limited to activated T-cells and possible immunosuppression would not be general and reversible; however, the possibility of adverse effects needs to be considered in the design of any form of immune therapy.
Conclusions
Large-scale gene expression analysis of naive and activated conventional and TR cells has made it possible to identify genes expressed specifically in TR cells upon activation. This set of genes controls suppressor functions of TR cells that depend on stimulation through the TCR. One gene, BMPR1α, was shown to control the thymic development of TR cells and conversion of conventional CD4+ T-cells into aTR cells. The pattern of BMPR1α expression revealed it was up-regulated in response to TCR stimulation and, in conventional T-cells, inhibited generation of TH1 cells and promoted TR cell generation. In conclusion, this gene may be important in regulating bias during an immune response to cancer. This interpretation was supported by the finding of slower growth of B16 melanoma tumors in BMPR1αT− mice.
Declaration of interest
The authors report no conflicts of interest. The authors alone are responsible for the content and writing of the paper.
Supplementary Material
Download PDF (437.6 KB)Acknowledgements
We thank L. Ignatowicz and members of his laboratory for reading the manuscript and helpful discussions and Jeanene Pihkala for cell sorting. This research was funded by NIH grant R21 AI097600 to P.K.
References
- Arden, K. C. 2004. FoxO: Linking new signaling pathways. Mol. Cell 14:416–418
- Arlen, P. M., Mohebtash, M., Madan, R. A., and Gulley, J. L. 2009. Promising novel immunotherapies and combinations for prostate cancer. Future Oncol. 5:187–196
- Biggs, M. W., and Eiselein, J. E. 2001. Suppression of immune surveillance in melanoma. Med. Hypotheses 56:648–652
- Bleul, C. C., and Boehm, T. 2005. BMP signaling is required for normal thymus development. J. Immunol. 175:5213–5221
- Bolstad, B. M., Irizarry, R. A., Astrand, M., and Speed, T. P. 2003. A comparison of normalization methods for high density oligonucleotide array data based on variance and bias. Bioinformatics 19:185–193
- Chen, D., Zhao, M., and Mundy, G. R. 2004. Bone morphogenetic proteins. Growth Factors 22:233–241
- Curiel, T. J., Coukos, G., Zou, L., et al. 2004. Specific recruitment of regulatory T-cells in ovarian carcinoma fosters immune privilege and predicts reduced survival. Nat. Med. 10:942–949
- Doak, S. H., Jenkins, S. A., Hurle, R. A., et al. 2007. Bone morphogenic factor gene dosage abnormalities in prostatic intra-epithelial neoplasia and prostate cancer. Cancer Genet. Cytogenet. 176:161–165
- Engelhard, V. H., Bullock, T. N., Colella, T. A., et al. 2002. Antigens derived from melanocyte differentiation proteins: Self-tolerance, autoimmunity, and use for cancer immunotherapy. Immunol. Rev. 188:136–146
- Fantini, M. C., Becker, C., Monteleone, G., et al. 2004. Cutting edge: TGFβ induces a regulatory phenotype in CD4+CD25− T-cells through Foxp3 induction and down-regulation of Smad7. J. Immunol. 172:5149–5153
- Gabrilovich, D. I., Ostrand-Rosenberg, S., and Bronte, V. 2012. Coordinated regulation of myeloid cells by tumors. Nat. Rev. Immunol. 12:253–268
- Graf, D., Nethisinghe, S., Palmer, D. B., et al. 2002. The developmentally-regulated expression of twisted gastrulation reveals a role for bone morpho-genetic proteins in the control of T-cell development. J. Exp. Med. 196:163–171
- Gray, A., van de la Luz Garcia-Hernandez, W. M., Kanodia, S., et al. 2009. Prostate cancer immunotherapy yields superior long-term survival in TRAMP mice when administered at an early stage of carcinogenesis prior to the establishment of tumor-associated immunosuppression at later stages. Vaccine 27:G52–G59
- Guo, X., and Wang, X. F. 2009. Signaling cross-talk between TGFβ/BMP and other pathways. Cell Res. 19:71–88
- Hager-Theodorides, A. L., Outram, S. V., Shah, D. K., et al. 2002. Bone morphogenetic protein 2/4 signaling regulates early thymocyte differentiation. J. Immunol. 169:5496–5504
- Hanahan, D., and Coussens, L. M. 2012. Accessories to the crime: Functions of cells recruited to the tumor microenvironment. Cancer Cell 21:309–322
- He, X. C., Zhang, J., Tong, W. G., et al. 2004. BMP signaling inhibits intestinal stem cell self-renewal through suppression of Wnt-beta-catenin signaling. Nat. Genet. 36:1117–1121
- Hinck, A. P. 2012. Structural studies of the TGFβs and their receptors - insights into evolution of the TGFβ superfamily. FEBS Lett. 586:1860–1870
- Huber, S., Stahl, F. R., Schrader, J., et al. 2009. Activin a promotes the TGFβ-induced conversion of CD4+CD25− T-cells into Foxp3+-induced regulatory T-cells. J. Immunol. 182:4633–4640
- Itasaki, N., and Hoppler, S. 2010. Cross-talk between Wnt and bone morphogenic protein signaling: A turbulent relationship. Dev. Dyn. 239:16–33
- Jones, E., Golgher, D., Simon, A. K., et al. 2004. The influence of CD25+ cells on the generation of immunity to tumor cell lines in mice. Novartis Found. Symp. 256:149–152
- Josefowicz, S. Z., Lu, L. F., and Rudensky, A. Y. 2012. Regulatory T-cells: Mechanisms of differentiation and function. Ann. Rev. Immunol. 30:531–564
- Kerdiles, Y. M., Beisner, D. R., Tinoco, R., et al. 2009. Foxo1 links homing and survival of naive T-cells by regulating L-selectin, CCR7, and IL-7 receptor. Nat. Immunol. 10:176–184
- Kuczma, M., Pawlikowska, I., Kopij, M., et al. 2009a. TCR repertoire and Foxp3 expression define functionally distinct subsets of CD4+ regulatory T-cells. J. Immunol. 183:3118–3129
- Kuczma, M., Podolsky, R., Garge, N., et al. 2009b. Foxp3-deficient regulatory T-cells do not revert into conventional effector CD4+ T-cells but constitute a unique cell subset. J. Immunol. 183:3731–3741
- Lee, P. P., Fitzpatrick, D. R., Beard, C., et al. 2001. A critical role for Dnmt1 and DNA methylation in T-cell development, function, and survival. Immunity 15:763–774
- Licona-Limon, P., and Soldevila, G. 2007. Role of TGFβ superfamily during T-cell development: New insights. Immunol. Lett. 109:1–12
- Lu, L., Ma, J., Wang, X., et al. 2010. Synergistic effect of TGFβ superfamily members on the induction of Foxp3+ Treg. Eur. J. Immunol. 40:142–152
- Ma, Y., Shurin, G. V., Gutkin, D. W., and Shurin, M. R. 2012. Tumor-associated regulatory dendritic cells. Semin. Cancer Biol. 22:298–306
- Marie, J. C., Letterio, J. J., Gavin, M., and Rudensky, A. Y. 2005. TGFβ1 maintains suppressor function and Foxp3 expression in CD4+CD25+ regulatory T-cells. J. Exp. Med. 201:1061–1067
- Mishina, Y., Hanks, M. C., Miura, S., et al. 2002. Generation of Bmpr/Alk3 conditional knockout mice. Genesis 32:69–72
- Muranski, P., and Restifo, N. P. 2009. Adoptive immunotherapy of cancer using CD4+ T-cells. Curr. Opin. Immunol. 21:200–208
- Nishikawa, H., Jager, E., Ritter, G., et al. 2005. CD4+CD25+ regulatory T-cells control induction of antigen-specific CD4+ helper T-cell responses in cancer patients. Blood 106:1008–1011
- Overwijk, W. W., Lee, D. S., Surman, D. R., et al. 1999. Vaccination with a recombinant vaccinia virus encoding a “self” antigen induces autoimmune vitiligo and tumor cell destruction in mice: Requirement for CD4+ T-lymphocytes. Proc. Natl. Acad. Sci. USA. 96:2982–2987
- Pardoll, D. M. 2012. Immunology beats cancer: A blueprint for successful translation. Nat. Immunol. 13:1129–1132
- Poorgholi, B. M., Krause, C., Guzman, A., and Knaus, P. 2012. Comprehensive analysis of TGFβ and BMP receptor interactomes. Eur. J. Cell Biol. 91:287–293
- Quezada, S. A., Simpson, T. R., Peggs, K. S., et al. 2010. Tumor-reactive CD4+ T-cells develop cytotoxic activity and eradicate large established melanoma after transfer into lymphopenic hosts. J. Exp. Med. 207:637–650
- Rothhammer, T., Poser, I., Soncin, F., et al. 2005. Bone morphogenic proteins are over-expressed in malignant melanoma and promote cell invasion and migration. Cancer Res. 65:448–456
- Sakaguchi, S., Sakaguchi, N., Shimizu, J., et al. 2001. Immunologic tolerance maintained by CD25+CD4+ regulatory T-cells: Their common role in controlling autoimmunity, tumor immunity, and transplantation tolerance. Immunol. Rev. 182:18–32
- Senta, H., Park, H., Bergeron, E., et al. 2009. Cell responses to bone morphogenetic proteins and peptides derived from them: Biomedical applications and limitations. Cytokine Growth Factor Rev. 20:213–222
- Shola, D. T., Wang, H., Wahdan-Alaswad, R., and Danielpour, D. 2012. Hic-5 controls BMP4 responses in prostate cancer cells through interacting with Smads 1, 5 and 8. Oncogene 31:2480–2490
- Sivertsen, E. A., Huse, K., Hystad, M. E., et al. 2007. Inhibitory effects and target genes of bone morphogenetic protein 6 in Jurkat TAg cells. Eur. J. Immunol. 37:2937–2948
- Smyth, G. K. 2004. Linear models and Empirical Bayes methods for assessing differential expression in microarray experiments. Stat. Appl. Genet. Mol. Biol. 3:Article3
- Tanaka, H., Tanaka, J., Kjaergaard, J., and Shu, S. 2002. Depletion of CD4+CD25+ regulatory cells augments the generation of specific immune T-cells in tumor-draining lymph nodes. J. Immunother. 25:207–217
- Tian, Q., He, X. C., Hood, L., and Li, L. 2005. Bridging the BMP and Wnt pathways by PI3 kinase/Akt and 14-3-3zeta. Cell Cycle 4:215–216
- Tone, Y., Furuuchi, K., Kojima, Y., et al. 2008. Smad3 and NFAT cooperate to induce Foxp3 expression through its enhancer. Nat. Immunol. 9:194–202
- Topalian, S. L., Drake, C. G., and Pardoll, D. M. 2012. Targeting the PD-1/B7-H1(PD-L1) pathway to activate anti-tumor immunity. Curr. Opin. Immunol. 24:207–212
- Vesely, M. D., Kershaw, M. H., Schreiber, R. D., and Smyth, M. J. 2011. Natural innate and adaptive immunity to cancer. Ann. Rev. Immunol. 29:235–271
- Viguier, M., Lemaitre, F., Verola, O., et al. 2004. Foxp3 expressing CD4+CD25high regulatory T-cells are over-represented in human metastatic melanoma lymph nodes and inhibit the function of infiltrating T-cells. J. Immunol. 173:1444–1453
- Yoshioka, Y., Ono, M., Osaki, M., et al. 2012. Differential effects of inhibition of bone morphogenic protein (BMP) signalling on T-cell activation and differen-tiation. Eur. J. Immunol. 42:749–759
- Zheng, Y., Josefowicz, S., Chaudhry, A., et al. 2010. Role of conserved non-coding DNA elements in the Foxp3 gene in regulatory T-cell fate. Nature 463:808–812
- Zou, W. 2006. Regulatory T-cells, tumor immunity, and immunotherapy. Nat. Rev. Immunol. 6:295–307