
Abstract
A full elucidation of events occurring inside the cancer microenvironment is fundamental for the optimization of more effective therapies. In the present study, the cross-talk between cancer and immune cells was examined by employing mice deficient (KO) in interferon regulatory factor (IRF)-8, a transcription factor essential for induction of competent immune responses. The in vivo results showed that IRF-8 KO mice were highly permissive to B16.F10 melanoma growth and metastasis due to failure of their immune cells to exert proper immunosurveillance. These events were found to be dependent on soluble factors released by cells of the immune system capable of shaping the malignant phenotype of melanoma cells. An on-chip model was then generated to further explore the reciprocal interactions between the B16.F10 and immune cells. B16.F10 and immune cells were co-cultured in a microfluidic device composed of three culturing chambers suitably inter-connected by an array of microchannels; mutual interactions were then followed using time-lapse microscopy. It was observed that WT immune cells migrated through the microchannels towards the B16.F10 cells, establishing tight interactions that in turn limited tumor spread. In contrast, IRF-8 KO immune cells poorly interacted with the melanoma cells, resulting in a more invasive behavior of the B16.F10 cells. These results suggest that IRF-8 expression plays a key role in the cross-talk between melanoma and immune cells, and under-score the value of cell-on-chip approaches as useful in vitro tools to reconstruct complex in vivo microenvironments on a microscale level to explore cell interactions such as those occurring within a cancer immunoenvironment.
Introduction
Cancer progression represents a complex multi-step event culminating in the generation and spreading of metastases. Growing literature has yielded evidence that the immuneenvironment of a tumor undoubtedly constitutes a major line of defense against its progression (Hanahan & Weinberg, Citation2011; Schiavoni et al., Citation2013). Even though great advances have been made in this context, elucidation of precise interactions between different members of the cancer cells’ microenvironment remains an object of intense investigation. The development and gradual implementation of appropriate technologies such as nanotechnology-based microfluidics coupled to microscopy have given rise to encouraging studies on the multi-faceted composition of “cancer microenvironments” (Ma et al., Citation2013).
Interferon regulatory factor 8 (IRF-8) is a transcription factor endowed with an ability to modulate immune responses by its indirect control of key immune populations and functions, alone or in synergy with distinct STAT proteins (Holtschke et al., Citation1996; Gabriele & Ozato, Citation2007; Gabriele et al., Citation1999). While mice devoid of IRF-8 (IRF-8 KO) display selective reductions in the number and functionality of macrophages and of some DC populations, they also display an expansion of myeloid populations with suppressive functions (Holtschke et al., Citation1996; Mattei et al., Citation2006; Schiavoni et al., Citation2002, Citation2004; Waight et al., Citation2013). In addition, IRF-8 is directly involved in the modulation of cancer progression, acting as a tumor suppressor in hematological and solid malignancies (Abrams, Citation2010; Tamura & Ozato, Citation2002). Despite this important dual role for IRF-8 in anti-tumor responses, whether this modulation of cancer progression occurs as a result of possible interactions between cancer and immune cells is still under investigation.
In the present report, we investigated the role of IRF-8 in cross-talk between melanoma and immune cells in a tumor microenvironment using a multidisciplinary approach. By using IRF-8 KO mice transplanted with B16.F10 melanoma, we were able to discern if these animals “provided” conditions that were more supportive for tumor growth and metastatic spread in comparison to what exists in WT mice. We were also able to ascertain if IRF-8 was important for the release of systemic soluble factors that had a significant role in regulating intra-tumoral immune cell infiltration as well as in shaping the phenotype of the melanoma cells. To better define the effective interactions between melanoma and immune cells, a microfluidic system was used to follow in real time (“under the microscope”) such cross-talk between the two cell types. It was expected that the findings would provide conclusive evidence of the key role of IRF-8 as a regulator of melanoma and immune cell cross-talk, in part through the release of soluble factors in the tumor microenvironment. In addition, when coupled with the use of a cell-on-chip platform, the latter could represent a valuable tool to investigate multiple aspects of the cross-talk between immune system cells and this and other types of cancer cells.
Materials and methods
Cell lines
The B16.F10 murine melanoma cell line was purchased from American Type Culture Collection-LGC (CRl-6475, ATCC-LGC, Milan, Italy). The cells were routinely tested for morphology, growth, and an absence of mycoplasma. Cells were passaged no more than three times after thawing. Where indicated, cultured cells were used for experiments when they attained sub-confluence status, at which point they were labeled with the PKH67 green fluorescent cell tracker (Sigma-Aldrich, Milan, Italy) according to manufacturer protocols.
Mice and in vivo treatments
IRF-8 KO mice were generated as described (Holtschke et al., Citation1996) and backcrossed on a C57BL/6 background. All C57BL/6 IRF-8 KO and wild-type (WT) mice were housed in the animal facility at the Istituto Superiore di Sanità (Rome, Italy) and handled according to local Ethical Committee guidelines. The pathogen-free facilities were maintained at 21 °C with a 50% relative humidity and a 12-h light:dark cycle. All mice had ad libitum access to filtered water and standard rodent chow throughout the study. All animal studies were approved under the Italian Legislative Decree 116/92 guidelines based on European Directive 86/609/EEC.
For the studies here, B16.F10 cells (re-suspended in ice-cold phosphate-buffered saline [PBS, pH 7.4]) were injected subcutaneously (SC; 0.8 × 10⁶ per 200 µl injection volume) into female mice in each group when they were 7-weeks-old. For induction of experimental pulmonary metastasis, other sets of female mice were injected intravenously (IV) with 1.5 × 10⁶ B16.F10 cells and then euthanized (by cervical dislocation) 5 days later to permit enumeration of lung metastatic foci.
Isolation of splenocytes from mice
WT and IRF-8 KO mice were euthanized and their spleens excised and placed in PBS (pH 7.4). Single cell suspensions were then prepared by passing each organ through a 70-µm pore mesh (BD Falcon, San Jose, CA). The resultant suspension was then treated with lysis buffer (16 mM Tris-HCl, 153 mM NH4Cl) to lyse red blood cells (3 min, room temperature) and then washed (by centrifugation) several times with Iscove’s Modified Dulbecco’s Medium (IMDM; Lonza, Allendale, NJ). Following the final wash, the cells were re-suspended in IMDM and counted. Where indicated, some of these cells were labeled with the PKH26 red fluorescent cell tracker (Sigma), following manufacturer instructions, and then extensively washed with PBS.
Analysis of immune cell infiltrate in melanoma
Immune cells infiltrating the tumor bulk were detected by flow cytometry. Briefly, melanoma explants were isolated from the mice and subjected to collagenase digestion/EDTA treatment (Mattei et al., Citation2012). The suspension was then treated with lysing solution to remove any red blood cells present and the resultant material then stained with primary (and then secondary antibodies) to identify appropriate intra-tumoral cell sub-sets (e.g. T-cells, cDC, pDC, and MDSC). Details of the cell preparation/staining, the antibodies used, and the protocols for flow cytometry are the same as described in our previous work (Mattei et al., Citation2012).
Quantitative reverse transcription-PCR
Total RNA was extracted from tumor tissues using TRIzol reagent (Invitrogen, Monza, Italy). Messenger RNA was reverse transcribed by means of a Verso cDNA Kit (Thermo Scientific, Waltham, MA). Quantitative reverse transcription–PCR (qRT-PCR) was performed using a Sensimix Plus SYBR Kit containing fluorescent SYBR Green dye (Quantace, Watford, UK). Conditions of the real-time PCR reaction and the list of primers used are described in detail elsewhere (Mattei et al., Citation2012).
Design of microfluidic device
Microfluidic devices were designed to allow chemical and physical contacts between adherent (tumor) and non-adherent (spleen cells) populations. Two main culture chambers (a melanoma and a spleen cell compartment) were connected via narrow capillary migration micro-channels (12-µm wide × 500-µm long × 10-µm high). Culture compartments cross-sectional dimensions were 1-mm (width) × 100-µm (height). The microfluidic co-culture platforms were fabricated in PDMS (poly-dimethyl siloxane; Silgard 184; Dow Chemical, Detroit, MI), a bio-compatible optically transparent silicone elastomer, using standard soft lithographic techniques. Details of the fabrication protocols of these systems were described previously (Businaro et al., Citation2013). Access reservoirs were created using a suite of 8-mm dermal biopsy punch tools (Kai Medical, Honolulu, HI) and the final molded PDMS bonded to a glass microscope slide. Prior to cell loading, each device was sterilized under UV light in a laminar flow hood for 30 min and then filled with IMDM + 10% fetal calf serum (FCS; Lonza) and incubated for 1 h at 37 °C to equilibrate the system. For experiments, the medium was gently aspirated via the fluidic inlets and replaced with 2 × 10⁶ splenocytes and/or 5 × 10⁴ B16.F10 cells, each in 200 µl IMDM/10% FCS medium.
Microscopy and image analysis
Phase contrast/visible microphotographs of the cells within the devices were taken using an EVOS FL Cell Imaging System (Life Technologies) or a Juli Smart Fluorescence Cell Analyzer (Bulldog Bio, Rochester, NY). When appropriate, fluorescence microphotographs were generated with the EVOS scope equipped with built-in imaging software to create image over-lays. Extravasation analyses were performed using ImageJ software (http://rsbweb.nih.gov.ij/). Briefly, an ROI plug-in was used to measure the maximum distance reached by the tumor cells (with respect to microchannel borders) inside the splenocyte chamber (Businaro et al., Citation2013).
Time-lapse recordings were performed by means of the Juli scope. Because of its reduced size, this microscope was easily inserted into standard 37 °C incubators, making it suitable for use in studies that require long-term incubations of live cells. Microphotographs were generated every 2 min for 24 h twice, for a total of 48 h. Tracking analysis was done using ImageJ software and its Manual Tracking plug-in. The raw tracking data generated were analyzed with Chemotaxis and Migration Tool software (Ibidi, Martinsried, Germany); this software was also used to generate tracking plots. The microchannel filling factor was calculated using ImageJ software coupled to the ROI plug-in for every microphotograph obtained during the time-lapse recording.
Statistical analysis
Levels of significance for comparisons between the samples/groups were determined using a Student’s t-test; p values ≤0.05 were considered statistically significant.
Results
IRF-8 mice display a higher susceptibility to melanoma compared to WT counterparts
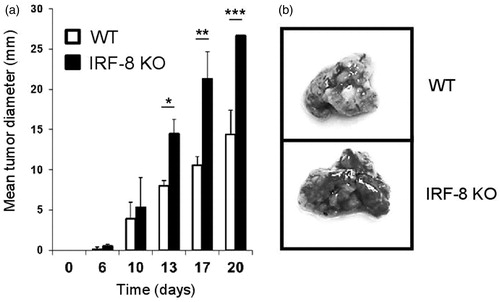
To demonstrate the differential growth ability of melanoma in WT and IRF-8 KO hosts, the mice were injected SC with B16.F10 cells. A marked growth rate of the tumors was noted in the IRF-8-deficient mice (relative to that seen in WT mice). Indeed, as early as 13 days post-injection, there were significant differences in growth rate (). To further investigate if these differences could also be observed in terms of metastatic potential, B16.F10 cells were injected IV and the extent of foci formation in the lungs of the WT and IRF-8 KO mice then monitored. A markedly higher level of metastasization was seen in the lungs of the IRF-8 KO mice than in those of WT hosts (). Overall, these findings demonstrated a significantly higher propensity of IRF-8 KO mice to support melanoma growth.
Figure 1. Melanoma growth and metastases in IRF-8 KO and WT mice. (a) WT and IRF-8 KO mice were injected SC with 0.8 × 10⁶ B16.F10 melanoma cells and tumor size measured thereafter. Bars represent mean tumor diameter (± SD). One representative experiment of seven is shown. *p < 0.05, **p < 0.01, ***p < 0.001. (b) WT and IRF-8 KO mice were injected IV with B16.F10 cells (1.5 × 10⁶) and euthanized 5 days later for enumeration of lung metastatic foci. Photographs of representative isolated lungs show foci (indicated by dark areas inside lung tissue).
Immune cell infiltration is impaired in melanoma grown in IRF-8 KO mice
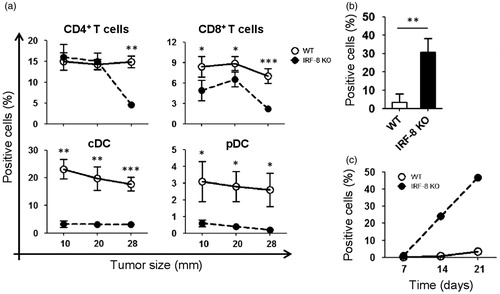
To evaluate the extent of immune cell infiltration in the melanomas of tumor-bearing WT and IRF-8 KO mice, intra-tumoral frequencies of different immune cell sub-sets (at various melanoma growth stages) were assessed using flow cytometry. CD4+ T-lymphocytes were seen to be present (infiltrated) at significantly higher levels in the tumors in WT mice as compared to in the IRF-8 KO hosts, but only at late stages (i.e. when reached an average diameter of 28 mm; ). In contrast, CD8+ T-lymphocytes infiltration of the sites was significantly higher in the WT hosts even at early stages (i.e. 10 mm). Of note, cDC and pDC (conventional and plasmacytoid dendritic cells, respectively) displayed a markedly higher infiltration into the melanomas of the WT mice than in the IRF-8 KO mice, at all stages of tumor growth (). Conversely, the infiltration rate of myeloid-derived suppressor cells (MDSC) was markedly pronounced in tumors isolated from IRF-8 KO mice compared to that seen in WT hosts (); this occurred even at an early tumor growth stage (i.e. 10 mm). Interestingly, the percentage MDSC in tumor-bearing IRF-8 KO mice clearly increased over time (), but not in the tumors that grew in the WT hosts.
Figure 2. Trafficking of T-lymphocytes, DC, and MDSC in melanoma lesions during tumor progression. Melanoma lesions from WT and IRF-8−/− mice were excised at various stages of growth. (a) Flow cytometric analysis of infiltrating T-lymphocytes gated on total (CD45+CD11c−) leukocytes as CD4+ and CD8+ T-lymphocytes, respectively. Each circle depicts mean percentage value of various infiltrating immune cell populations among total CD45+ cells in each indicated size group (n = 18 mice) ± SD. (b) Melanoma-bearing IRF-8−/− and WT mice were examined at an early tumor size (12-mm diameter). Flow cytometric analysis of MDSC in tumor bulks was then performed. Histograms show MDSC cells as CD11b+Gr1+CD124/IL-4R+ gated. Histograms depict mean percent positive cells among all CD45+ leukocytes. One representative experiment of three is shown. (c) Melanoma-bearing IRF-8−/− and WT mice were sacrificed at Days 7, 14, and 21 post-injection and MDSC from their spleens were analyzed by flow cytometry. Each circle depicts mean percentage values of various infiltrating immune cell populations (among total CD45+ cells) in each indicated size group. One representative experiment of two is shown. *p < 0.05, **p < 0.01, ***p < 0.001.
Melanoma grown in IRF-8 KO mice display a markedly decreased IRF-8 expression
The findings about intra-tumoral immune cell infiltration reflected very different profiles in the two types of hosts. To ascertain whether the IRF-8 deficiency could be important in the context of the melanoma microenvironment, intra-tumoral IRF-8 mRNA expression in lesions recovered from the WT and IRF-8 KO mice was assessed at the three progression stages. Interestingly, IRF-8 expression was completely abrogated in the deficient animals at each tumor size (). Conversely, intra-tumoral expression in WT mouse tumors was initially markedly pronounced at the 10 mm size, but gradually decreased as the tumor grew.
Figure 3. IRF-8 expression in IRF-8-melanoma lesions. (a) IRF-8 mRNA expression in melanoma isolated from WT and IRF-8 KO mice at indicated tumor sizes. Circles represent mean expression values normalized to β-actin in each group (18 mice) ± SD. One representative experiment of three is shown. (b) IRF-8 mRNA expression in sorted CD45+ and CD45− fractions from melanoma-bearing mice at medium stage (20-mm mean diameter). Vertical scatter plots represent mRNA expression values normalized to β-actin. Vertical lines with bars in each group depict the mean mRNA expression ± SD. One representative experiment of three is shown. (c) Spleen cells of melanoma-bearing or naïve WT and IRF-8 KO mice (n = 6) were co-cultured with B16.F10 cells in a 0.4-µm pore size trans-well culture system. After 24 h, the melanoma cells were collected, total RNA was isolated, and qRT-PCR for IRF-8 mRNA was performed. Horizontal scatter plots represent mRNA expression values normalized to β-actin. Horizontal lines with bars in each group depict the mean mRNA expression ± SD. One representative experiment of two is shown. *p < 0.05, **p < 0.01, ***p < 0.001.
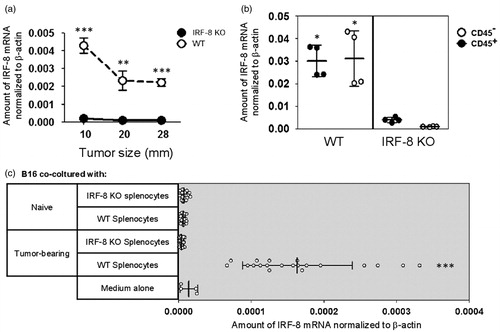
Although the findings unequivocally suggest a key role for IRF-8 inside the melanoma microenvironment, it was important to determine whether the contribution of this expression arose from the stromal component (i.e. the B16.F10 cells) or from infiltrating immune cells. Intra-tumoral levels of IRF-8 were determined after sorting the tumor cellular constituents using a CD45 marker antibody. As expected, lower IRF-8 expression was seen in melanomas that grew in the IRF-8 KO mice than in those that evolved in WT hosts (). Interestingly, both immune cell and stromal fraction of the bulk almost equally contributed to the IRF-8 increase in the WT mice ().
Splenocytes from melanoma-bearing mice produce soluble mediators that regulate IRF-8 expression in B16.F10 cells
A possibility that intra-tumoral expression of IRF-8 within the melanoma microenvironment could have a direct role in controlling the expression of soluble mediators important for the extent of immune cell infiltration was then evaluated. To test this, WT or IRF-8 KO splenocytes from naïve and tumor-bearing mice (Day 19 post-injection) were co-cultured in trans-well plates containing B16.F10 cells. IRF-8 mRNA expression in the melanoma cells was then assessed 24 h later. The results indicated only splenocytes from tumor-bearing WT mice could markedly up-regulate IRF-8 mRNA expression in the B16.F10 cells (compared to what was seen with B16.F10 cells exposed to media alone or IRF-8 KO splenocytes; ). In contrast, no IRF-8 mRNA increase was induced by splenocytes from any tumor-free mice. Taken together, these findings prove that soluble factors produced and released by splenocytes effectively drove IRF-8 expression in the melanoma cells, suggesting to us a possible cross-talk between melanoma cells and infiltrating immune cells in the microenvironment of the cancer.
WT and IRF-8 KO splenocytes display a divergent migratory outline to melanoma cells
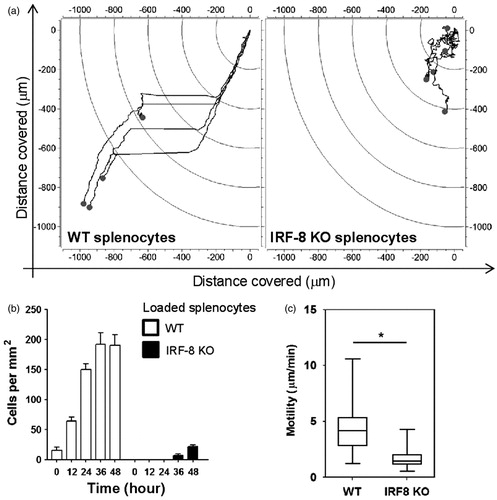
To investigate the cross-talk between B16.F10 cells and WT or IRF-8 KO splenocytes, a PDMS microfluidic chip (generated by our group to follow in real time mutual interactions between the two cell populations) was employed. The device was composed of four microchannel arrays inter-connected by three 1000-µm-size chambers. The chambers and arrays constituted the points where all measures of cross-talk between cancer and immune cells were taken (). Time-lapse recordings were performed after co-loading WT or IRF-8 KO splenocytes with B16.F10 cells in the device. Microphotographs taken every 2 min (for two successive time intervals of 24 and 48 h) were then generated. Interestingly, the results strongly indicated a different migratory profile of the WT spleen cells with respect to that by IRF-8 KO mouse cells when each type was co-loaded with the melanoma cells. Indeed, migration plots clearly indicate a high displacement rate for WT but not IRF-8 KO splenocytes (). This result is in accordance with the higher cell counts and speed rate seen with WT host spleen cells compared to that noted with cells from IRF-8 KO mice ().
Figure 4. Schematic of PDMS device used for microfluidic studies of melanoma–spleen cell cross-talk. (a) Three-dimensional representation of device. Arrows depict loading wells. Black arrows, B16.F10 wells; white arrows, medium wells; grey arrows, spleen cell wells. (b) Two-dimensional drawing of device. Top panel shows indicated structural components of microfluidic device. The two cell-loading chambers are connected to the central end-closed chambers by four microchannel arrays. Lower panels depict geometry of microchannel arrays, with indicated measurement values. The space between each microchannel is 33 µm; each and all indicated chambers are characterized by the same size shown for the central chamber.
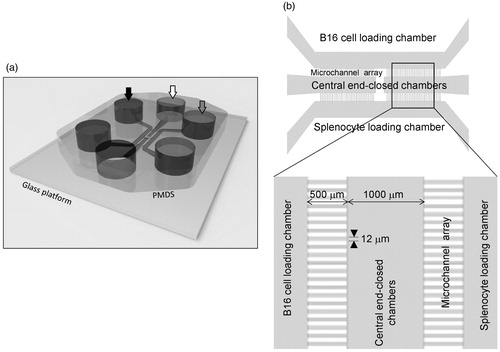
Figure 5. WT and IRF-8 splenocyte migratory profiles towards melanoma chamber after 48 h. (a) Analysis of time-lapse recordings of devices containing B16.F10 cells co-loaded with indicated spleen cells. Charts plot representative trajectories of WT (n = 4) or IRF-8 KO (n = 5) splenocytes within the in the 24–48 h interval. Each line inside plots depicts a single trajectory and each circle represents the final position of a single cell with respect to the initial “zero point” position. (b) Counts of WT and IRF-8 KO spleen cells that migrated towards B16.F10 chamber in the device. Bars represent mean number cells per mm2 (± SD) at indicated time points. (c) Box & Whiskers plot depicting motility of WT (n = 45) or IRF-8 KO (n = 41) spleen cells in the 24–48 h interval. Upper and lower horizontal lines of boxes represent upper and lower quartiles, respectively. The horizontal line in boxes represents median speed values. Upper and lower whiskers represent maximum and minimum speed values, respectively. *p < 0.05. Data are from one representative experiment out of three.
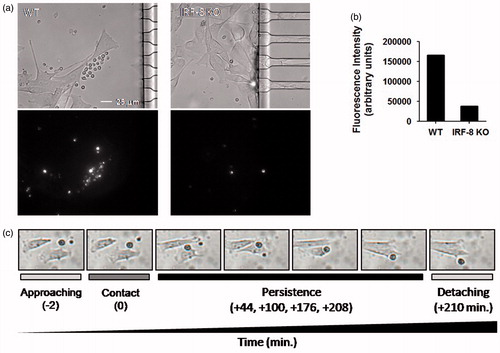
To confirm the findings of a growing cell count number in devices loaded with WT splenocytes, the same experiment above was performed with spleen cells labeled with red fluorochrome and unlabeled B16.F10 cells. As expected, the data showed an increase in fluorescence intensity in the melanoma compartment of devices co-loaded with melanoma cells when splenocytes from the WT, but not IRF-KO, mice were used (). Of note, the time-lapse recordings allowed an estimate to be made of the interaction times between each single spleen cell that migrated to the melanoma compartment. In this regard, a representative point-to-point time-lapse recording illustrated that WT splenocytes, but not IRF-8 KO cells, effectively made contact and interacted for a certain time interval with the melanoma cells (). These interactions persisted appropriately after splenocyte–melanoma cell contact (as shown by a representative set of frames for WT splenocytes first approaching and then contacting a B16.F10 cell). This persistence period was longer with splenocytes from WT mice than with cells from IRF-8 KO mice ( and data not shown). These data clearly evidence close durable and functional interaction ability by WT, but not IRF-8 KO, spleen cells with the melanoma cells in this microfluidic platform. This system has also proven potentially useful for point-to-point assessments of cancer-immune cell interactions.
Figure 6. WT and IRF-8 splenocyte interaction ability with melanoma cells in first 48 h. (a) Fibroblastoid B16.F10 cells interacting with splenocytes (small circular cells). Upper panels depict phase-contrast microphotographs; lower panels indicate fluorescence microphotographs of labeled splenocytes. (b) Quantification of fluorescence at 48 h of the splenocytes in devices as shown in (a). Histograms depict total fluorescence intensity of labeled splenocytes of the indicated phenotype. (c) Microphotographs showing time-course of B16-WT splenocyte interactions. Time points and interaction phases occurring are indicated below each microphotograph. Numbers in parentheses depict time-course before and after contact phase.
Divergent behavior of B16.F10 cells in response to WT and IRF-8 KO host immune cells
Because of the tight prolonged interaction between WT splenocytes and B16.F10 cells, the migratory behavior of the cancer cells inside the microchannel array was also assessed. This could be an important issue in defining the cross-talk between melanoma cells and splenocytes. Time-lapse recordings provided evidence of a clear behavioral difference in terms of migratory extent of the B16.F10 cells when in the presence of WT or IRF-8 KO host splenocytes. A point-to-point calculation of the area covered by the B16.F10 cells indicated a differing ability of these cells to reach and migrate inside the microchannels in response to the two defined types of spleen cells (). The percentage of area covered by B16.F10 cells in the microchannel array gradually increased in response to WT splenocytes, but not IRF-8 KO cells, even at early times after co-loading in the chip ().
Figure 7. Migratory properties of melanoma cells inside microchannels after 48 h. (a) B16.F10 invasion rate in devices loaded with indicated spleen cells. The plot represents the ratio between the area occupied by B16.F10 cells in each microchannel versus total microchannel area (filling factor). Interpolation curves were obtained by linear regression analysis for the devices loaded with the indicated cells. (b) Detail of microchannel areas of microphotographs used for time-lapse tracking analysis shown in (a). The little black open boxes inside each microchannel indicate migrating B16.F10 cells that had been loaded with the WT or IRF-8 KO mouse splenocytes, at the given time points. (c) Motility of B16.F10 cells when loaded with indicated splenocytes (Box & Whiskers plot). Upper and lower horizontal lines in boxes represent upper and lower quartiles, respectively. Horizontal lines in boxes represent median speed values. Upper and lower whiskers represent maximum and minimum speed values, respectively. (d) Maximum migration distances covered by cancer cells in microchannels from devices loaded with indicated spleen cells. Bars represent mean maximum distance reached by B16.F10 cells in microchannels (± SD). The three values below the graph depict overall distance calculated by adding each single microchannel distance relative to each indicated group (WT, IRF-8 KO, Ctr). Ctr, device loaded with B16.F10 cells alone. Amount of microchannels per group is equal to 31. (e) Detailed schematization of the distance covered by the melanoma cells inside each microchannel. The heat map depicts a global visualization of distance covered by the melanoma cells in each of the 31 microchannels with respect to the three indicated types of splenocytes loaded. Dark and light colors depict higher and lower distances traveled, respectively. ***p < 0.001.
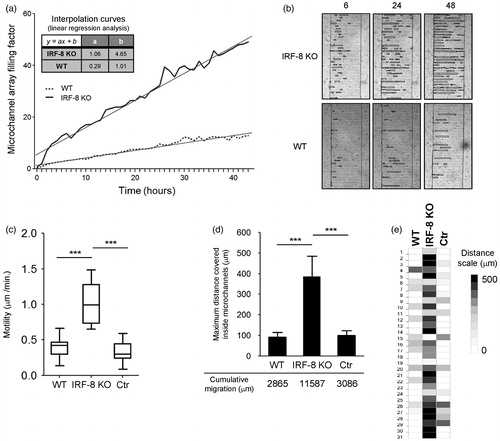
Interpolation curves were calculated for each microchannel array; the data showed that, when B16.F10 cells were initially co-loaded with the IRF-8 KO mouse splenocytes, they reached a full replenishment percentage after 90 h. Regarding the device loaded with IRF-8 KO host splenocytes, at the same time point the array achieved a filling rate of only 27% (). As expected, the motility of B16.F10 cells was significantly higher when they were co-loaded with the IRF-8 KO cells, compared to the migration speed observed when the melanoma cells were co-present with WT mice spleen cells (). Consistent with these findings, evidence was also obtained that showed that the melanoma cells covered greater distances when co-loaded with the IRF-8 KO mouse immune cells in the array. Conversely, the cancer cells migrated less when co-loaded with the splenocytes of WT mice (). This also paralleled the augmented cumulative migration extent for the B16.F10 cells in response to the IRF-8 KO spleen cells, compared to the cumulative distance covered by the same cancer cells when co-present with the WT host splenocytes (; 11 587 µm versus 2865 µm, respectively).
A heat map representing the overall migration profiles of each single microchannel in the array was also generated. Here, each heat map box represents the maximum migratory extent that occurred in each single microchannel per experimental condition. Again, the maximum distance covered did assume the higher values when the melanoma cells were initially co-loaded with IRF-8 KO host splenocytes (). Strikingly, these results demonstrated that melanoma cells displayed a marked migratory extent in the presence of splenocytes with impaired immune responses, such as those lacking IRF-8 expression, rather than with competent WT mouse cells.
Diverse invasiveness features of melanoma cells in the microfluidic chip
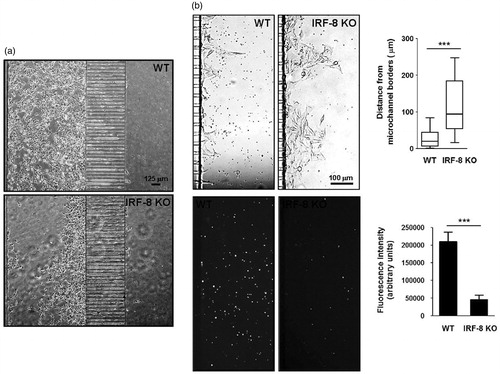
To investigate whether the presence of immunosuppressed splenocytes could affect the aggressiveness of the melanoma cells, the behavior of the cancer cells in response to WT or IRF-8 KO host spleen cells was monitored after 96 and 120 h of co-presence in the micro-devices. It was seen that the B16.F10 cells responded in markedly different fashions in the two-cell systems at these time points. Indeed, the cells appeared to possess a wider migratory ability in the presence of IRF-8 KO mouse splenocytes with respect to that seen with WT host cells. The B16.F10 cells also displayed an “aggressive” phenotype, i.e. a propensity to migrate towards (and occupy) the microchannel between the two compartments in the array (). Moreover, the melanoma cells showed a strong ability to form extravasation areas near the end of the microchannels in response to the IRF-8 KO, but not WT, mouse splenocytes (). The distance reached by the melanoma cells from microchannel borders was generally much higher when the cells were co-loaded with the IRF-8 KO mouse splenocytes compared to that in the presence of WT host cells (). Interestingly, there was also evidence (i.e. fluorescence intensity of labeled cells) of a major presence of WT immune cells in the splenocyte compartment in comparison to what was seen with the IRF-8 KO mouse splenocyte population (). These findings suggest that the mutual cross-talk between melanoma and spleen cells may also be extended to the “on-chip” monitoring of aggressiveness parameters, like an ability of the B16.F10 cells to generate extravasation. Such observations might be associated with the metastatic potential of these types of cells.
Figure 8. Invasive ability of melanoma cells in response to immune cells at late time points. (a) B16.F10 cell tropism in response to splenocytes. Phase contrast microphotographs show behavior of cells in devices loaded with indicated splenocytes (after 96 h). (b) Extravasation extent of B16.F10 cells. Upper microphotographs depict B16.F10 cells extravasating from microchannels in devices loaded with spleen cells (after 120 h). Upper-right Box & Whiskers plot indicates extravasation extent. Upper and lower horizontal lines of boxes represent upper and lower quartiles, respectively. Horizontal lines in boxes represent median speed values. Upper and lower whiskers represent maximum and minimum speed values, respectively. Lower panels illustrate red fluorescence from the same images of labeled WT and IRF-8 KO mouse splenocytes, migrating towards cancer cells. Lower-right plot shows fluorescence intensity of indicated splenocytes (after 120 h). Bars represent the mean fluorescence ± SD. ***p < 0.001.
Discussion
Although roles of immune responses in tumor progression have been extensively reported, many aspects about the relationships between effector and target cells in the tumor microenvironment are still unsolved (Fridman et al., Citation2012; Pages et al., Citation2010; Schiavoni et al., Citation2013). In this paper, we report on a multi-disciplinary study aimed at elucidating mechanisms involved in cross-talk between cancer cells and immune system cells. These studies investigated the cross-talk using two inter-dependent approaches, each focused on determining these interactions, i.e. in vivo models and a novel microfluidic cell-on-chip strategy. In addition, as a growing number of reports have suggested an important role for IRF-8 in immunity (Aliberti et al., Citation2003; Mattei et al., Citation2006; Rocca et al., Citation2013; Schiavoni et al., Citation2002, Citation2004; Tsujimura et al., Citation2003), and considering that IRF-8 KO mice are endowed with a functionally impaired immune response, this allowed the current studies to also examine the possibility that IRF-8 could have a role in the immune responses against cancer and also potentially in any cross-talk between the target and effector cells. Accordingly, the current study utilized an IRF-8 KO in vivo model to provide evidence this transcription factor was key to ensuring an effective immune response against melanoma progression.
The in vivo experiments showed that IRF-8 KO melanoma-injected mice permit much more tumor growth rate and metastasization extent than do WT counterparts. Interestingly, this first set of results revealed the existence of an effective IRF-8-dependent cross-talk between the splenocytes and B16.F10 cells. Indeed, the minor infiltration by anti-tumor immune cells into the tumor microenvironment of the IRF-8 KO tumor-bearing mice strongly suggested IRF-8 could regulate, at least in part, the ability of immune cells to interact with cancer cells in a tumor bed. Accordingly, the immune infiltrate of lesions that grew in WT, but not IRF-8 KO, mice were mainly composed by CD4+ and CD8+ T-lymphocytes, as well as cDC and pDC. In contrast, MDSC were present at a higher frequency in IRF-8 KO tumor-bearing mice. These cells have been identified as important indicators of conditions that favor tumor growth (Danilin et al., Citation2012; Gabrilovich et al., Citation2012). Interestingly, IRF-8 was recently shown to be directly involved in MDSC development (Waight et al., Citation2013); these findings are of extreme relevance, as they provide support for a possibility that IRF-8 might orchestrate chemokine–chemokine receptor patterns in the tumor microenvironment and so modulate immune cell infiltration. Thus, intra-tumoral immune cell infiltration is an event partly controlled by IRF-8, and this contributes to the ability of the melanoma microenvironment to expand in the presence of an impaired immune system.
The observation that IRF-8 expression was suppressed in tumors growing in IRF-8 KO hosts, even at early progression stages, suggested a role for this factor in modulating the expansion speed and aggressiveness of the melanoma. Further, these findings implied that this IRF-8-dependent cross-talk between infiltrating immune cells and stromal/B16 cells in the tumor bed may have led to an IRF-8-dependent microenvironment. In this case, the immune cells would fall under control of the factor and consequently modify their chemokine expression patterns in the milieu (Mattei et al., Citation2012). These data, therefore, also suggest to us that IRF-8 could act as a melanoma tumor suppressor gene and an important factor capable of orchestrating the cancer microenvironment and immune cell infiltration. Lastly, the in vivo results here also support the hypothesis that one/more soluble factor(s) may be crucial for sustaining an IRF-8-driven cross-talk at a tumor site. In this regard, recent literature showed that interleukin (IL)-27, a cytokine with anti-tumor and anti-angiogenic activity (Shimizu et al., Citation2006), was selectively secreted by spleen cells upon up-regulation of IRF-8 expression in B16.F10 cells after a 24 h co-culture with WT, but not IRF-8 KO, mouse splenocytes (Mattei et al., Citation2012).
The cancer microenvironment is a complex milieu in which resident cancer cells establish complex interactions with immune system cells. In solid tumors like melanoma, a cross-talk is initiated and maintained by cancer cells in the tumor bed and infiltrating immune cells. Even though these phenomena have been documented (Dvorak et al., Citation2011; Fridman et al., Citation2012; Galon et al., Citation2007; Hanahan & Weinberg, Citation2011; Pages et al., Citation2010; Schiavoni et al., Citation2013; Shurin et al., Citation2006), the monitoring of such a complex network in real-time is novel. Moreover, available technologies are difficult, time-expensive, and mainly based to cell-labeling methods that do not allow one to perform real-time visualization of cross-talk-based interactions between cancer and immune cells. In this context, the microfluidic chip technology developed here may represent a potent tool to explore such intricate dynamics in a microfluidic environment. The present paper also demonstrated the usefulness of this cell-on-chip approach to investigate the cross-talk between melanoma and immune cells.
In the present experiments, a simple microfluidic structure consisting of three wide parallel fluidic channels connected by a set of four arrays of short and narrow capillary migration channels was utilized. Splenocytes derived by WT or IRF-8 KO mice were loaded into one of the outer fluidic channels, and B16.F10 cells into the other. In this setting, both melanoma and immune cells could mutually migrate through the whole system. The results revealed that the mutual interactions between splenocytes and B16.F10 cells were markedly different depending on the WT or IRF-8 KO nature of the spleen cells. Indeed, WT and IRF-8 KO splenocytes appeared to possess markedly different migratory abilities—when co-loaded with the melanoma cells in the microfluidic device. In particular, WT splenocytes migrated towards the melanoma compartment by completely crossing the microchannels, while IRF-8 KO cells were unable to move forward. Further, WT immune cells had a higher migratory velocity than the IRF-8 KO host cells. Such behavioral parameters are in line with the in vivo results showing an impaired immunosurveillance by IRF-8 KO mice against melanoma. Interestingly, these results correlate with the observation that WT, but not IRF-KO, mouse splenocytes interact for longer times with the target cells upon crossing the channel array.
On the other hand, the B16.F10 cells displayed a different behavior in response to WT versus IRF-8 KO immune cells. In fact, the B16.F10 cells displayed greater propensity to invade the microchannels in the presence of IRF-8 KO splenocytes rather than when co-cultured with the WT cells. The greater expansion rates observed in microchannels when B16.F10 cells were co-loaded with IRF-8 KO mouse splenocytes may help explain, in part, the faster melanoma growth seen in IRF-8 KO mice. Indeed, this array finding also appears to reflect on the metastatic potential of the melanoma cells once they were injected into the IRF-8 KO mice, i.e. lung metastasis were more frequent than in the lungs of WT counterparts. Thus, the microfluidic experiments revealed the rise of an active cross-talk between immune and melanoma cells. In addition, this cross-talk appears to be strictly controlled by IRF-8 transcription factor and was paralleled by a secretion of soluble factors, i.e. IL-27.
Conclusions
The results of these studies provide evidence for the key role of the IRF-8 KO mouse as a model for use in in vivo studies to examine the multi-faceted roles of immunosurveillance against cancer. Indeed, by using in vivo approaches coupled to a microfluidic system, it is now possible to investigate some key aspects of the cross-talk that appears to occur between immune and cancer cells. Such observations have to-date been otherwise unachievable with only use of in vivo strategies. Lastly, we also conclude that cell-on-chip systems may be seen as a useful pre-clinical tool of benefit for a better definition of more specific anti-tumor strategies.
Declaration of interest
This study was supported by the Italian Association of Research against Cancer (AIRC) project no. 11610 to LG and by AIRC project no. 10720 to FB. The authors report no conflicts of interest. The authors alone are responsible for the content and writing of the paper.
Acknowledgements
The authors thank Anna Maria Pacca and Teresa D’Urso for their helpful technical assistance in mice breeding.
References
- Abrams, S. I. 2010. A multi-functional role of interferon regulatory factor-8 in solid tumor and myeloid cell biology. Immunol Res. 46:59–71
- Aliberti, J., Schulz, O., Pennington, D. J., et al. 2003. Essential role for ICSBP in the in vivo development of murine CD8alpha+ dendritic cells. Blood 101:305–310
- Businaro, L., De Ninno, A., Schiavoni, G., et al. 2013. Cross-talk between cancer and immune cells: Exploring complex dynamics in a microfluidic environment. Lab. Chip 13:229–239
- Danilin, S., Merkel, A. R., Johnson, J. R., et al. 2012. Myeloid-derived suppressor cells expand during breast cancer progression and promote tumor-induced bone destruction. Oncoimmunology 1:1484–1494
- Dvorak, H. F., Weaver, V. M., Tlsty, T. D., and Bergers, G. 2011. Tumor microenvironment and progression. J. Surg. Oncol. 103:468–474
- Fridman, W. H., Pages, F., Sautes-Fridman, C., and Galon, J. 2012. The immune contexture in human tumors: Impact on clinical outcome. Nat. Rev. Cancer 12:298–306
- Gabriele, L., and Ozato, K. 2007. The role of the interferon regulatory factor (IRF) family in dendritic cell development and function. Cytokine Growth Factor Rev. 18:503–510
- Gabriele, L., Phung, J., Fukumoto, J., et al. 1999. Regulation of apoptosis in myeloid cells by interferon consensus sequence-binding protein. J. Exp. Med. 190:411–421
- Gabrilovich, D. I., Ostrand-Rosenberg, S., and Bronte, V. 2012. Coordinated regulation of myeloid cells by tumors. Nat. Rev. Immunol. 12:253–268
- Galon, J., Fridman, W. H., and Pages, F. 2007. The adaptive immunologic microenvironment in colorectal cancer: A novel perspective. Cancer Res. 67:1883–1886
- Hanahan, D., and Weinberg, R. A. 2011. Hallmarks of cancer: The next generation. Cell 144:646–674
- Holtschke, T., Lohler, J., Kanno, Y., et al. 1996. Immunodeficiency and chronic myelogenous leukemia-like syndrome in mice with a targeted mutation of the ICSBP gene. Cell 87:307–317
- Ma, H., Xu, H., and Qin, J. 2013. Biomimetic tumor microenvironment on a microfluidic platform. Biomicrofluidics 7:11501–11514
- Mattei, F., Schiavoni, G., Borghi, P., et al. 2006. ICSBP/IRF-8 differentially regulates antigen uptake during dendritic-cell development and affects antigen presentation to CD4+ T-cells. Blood 108:609–617
- Mattei, F., Schiavoni, G., Sestili, P., et al. 2012. IRF-8 controls melanoma progression by regulating the cross-talk between cancer and immune cells within the tumor microenvironment. Neoplasia 14:1223–1235
- Pages, F., Galon, J., Dieu-Nosjean, M. C., et al. 2010. Immune infiltration in human tumors: A prognostic factor that should not be ignored. Oncogene 29:1093–1102
- Rocca, S., Schiavoni, G., Sali, M., et al. 2013. Interferon regulatory factor 8-deficiency determines massive neutrophil recruitment but T-cell defect in fast-growing granulomas during tuberculosis. PLoS One 8:e62751
- Schiavoni, G., Gabriele, L., and Mattei, F. 2013. The tumor microenvironment: A pitch for multiple players. Front. Oncol. 3:90–105
- Schiavoni, G., Mattei, F., Borghi, P., et al. 2004. ICSBP is critically involved in normal development and trafficking of Langerhans cells and dermal dendritic cells. Blood 103:2221–2228
- Schiavoni, G., Mattei, F., Sestili, P., et al. 2002. ICSBP is essential for development of mouse Type I IFN-producing cells and for generation and activation of CD8alpha+ dendritic cells. J. Exp. Med. 196:1415–1425
- Shimizu, M., Shimamura, M., Owaki, T., et al. 2006. Anti-angiogenic and anti-tumor activities of IL-27. J. Immunol. 176:7317–7324
- Shurin, M. R., Shurin, G. V., Lokshin, A., et al. 2006. Intra-tumoral cytokines/chemokines/growth factors and tumor infiltrating dendritic cells: Friends or enemies? Cancer Metast. Rev. 25:333–356
- Tamura, T., and Ozato, K. 2002. ICSBP/IRF-8: Its regulatory roles in the development of myeloid cells. J. Interferon Cytokine Res. 22:145–152
- Tsujimura, H., Tamura, T., Gongora, C., et al. 2003. ICSBP/IRF-8 retrovirus transduction rescues dendritic cell development in vitro. Blood 101:961–969
- Waight, J. D., Netherby, C., Hensen, M. L., et al. 2013. Myeloid-derived suppressor cell development is regulated by a STAT/IRF-8 axis. J. Clin. Invest. 123:4464–4478