
Abstract
ORAI1 is the pore-forming component of calcium release-activated calcium (CRAC) channels. CRAC channels are the primary route for calcium ion (Ca2+) entry into T-cells following antigen stimulation. This Ca2+ entry induces proliferation and cytokine production through activation of calcineurin and the nuclear factor of activated T-cells (NFAT) transcription factor along with subsequent cytokine-related genes. It was hypothesized that the in vivo inhibition of T-cell function by blocking ORAI1 or calcineurin would lead to similar functional consequences. To test this hypothesis the activity of 2C1.1, a fully human anti-ORAI1 monoclonal antibody, and cyclosporin A (CsA) were tested in vivo for their suppressive effect on T-cell-derived cytokine production and a T-cell-dependent antibody response (TDAR) using sheep red blood cells (SRBC) in cynomolgus monkeys. Despite showing similar inhibition of ex vivo interleukin (IL)-2 production by stimulated T-cells, both molecules exhibited different pharmacologic effects on the SRBC antibody response. CsA blocked the development of SRBC-specific antibodies, while 2C1.1 failed to inhibit the antigen-specific antibody response. These surprising observations suggest that full inhibition of the CRAC channel is required to inhibit a functional immune response, consistent with findings from human patients with loss of function mutations in ORAI1.
Introduction
Calcium is an important second messenger for the regulation of cell differentiation, gene transcription, and effector functions of lymphocytes (Feske, Citation2007; Putney, Citation1986). The main pathway that induces an increase in intracellular Ca2+ levels in lymphocytes is mediated through store-operated calcium (SOC) influx and calcium release-activated calcium (CRAC) channels (Lewis, Citation2001; Oh-Hora, Citation2009; Oh-Hora & Rao, Citation2008; Parekh & Putney, Citation2005). The CRAC channel is made up of two essential components, stromal interaction molecule 1 (STIM1) and ORAI1. STIM1 is localized in the endoplasmic reticulum (ER), and is responsible for sensing the decrease in Ca2+ concentrations in ER (Liou et al., Citation2005; Roos et al., Citation2005; Zhang et al., Citation2005). ORAI1 is the pore-forming component localized in the plasma membrane (Prakriya et al., Citation2006; Vig et al., Citation2006; Yeromin et al., Citation2006).
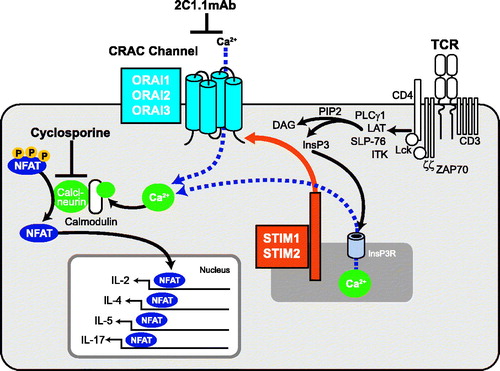
Although the initiation of a store operated calcium signaling cascade varies depending on the specific cell type in question, the main intracellular signaling events that induce an increase in intracellular Ca2+ concentrations are shared by all T-cell subsets of the immune system (). During a T-cell-mediated immune response, antigen binding to the T-cell receptor (TCR) leads to phospholipase Cγ1 (PLCγ1) activation. PLCγ1, in turn, hydrolyzes phosphatidylinositol-3,4-bisphosphate (PIP2) into diacylglycerol (DAG) and inositol-1,4,5-triphosphate (InsP3). InsP3 then binds to the InsP3 receptor on the ER, resulting in ER Ca2+ store depletion. This depletion subsequently opens store-operated CRAC channels, resulting in a sustained cytoplasmic Ca2+ influx (Feske et al., Citation2003; Feske, Citation2007). As a result of Ca2+ entry through CRAC channels, several Ca2+-dependent signaling proteins and their target transcription factors are activated, including calcineurin and its target nuclear factor of activated T-cells (NFAT). Dephosphorylation of NFAT by calcineurin leads to NFAT translocation into the nucleus and transcription of IL-2, IL-4, IL-5, and IL-17 in addition to other genes involved in T-cell function (de Boer et al., Citation1999; Feske et al., Citation2003; Liu et al., Citation2004).
Figure 1. The CRAC channel and T-cell signaling. The figure depicts the relationship between CRAC channel, ORAI1, and cytokine expression in T-cells. The agents used in this study, 2C1.1 and cyclosporin A, are also shown.
Given the key role of the Ca2+ signaling pathway in activation of T-cells and downstream cytokine mediated events, targets in this pathway are of great interest for the development of immunosuppressive drugs. Cyclosporin A (CsA), a small molecule inhibitor of calcineurin, has a well-established clinical efficacy in organ transplantation as well as in the treatment of several autoimmune diseases, although its safety profile limits its use in most autoimmune patients (Lissner & Siegmund, Citation2013; Naesens et al., Citation2009; Vercauteren et al., Citation1998). The CRAC channel is also of interest for pharmacologic modulation because mutations are seen in genes responsible for CRAC channel function in a subset of severe combined immunodeficiency (SCID) human patients. These mutations are in either ORAI1 or STIM1, and lead to either expression of non-functional ORAI1 or the absence of ORAI1 or STIM1 protein (Feske et al., Citation2001, Citation2005, Citation2006, Citation2010; McCarl et al., Citation2009). These SCID patients have a clinical phenotype that is characterized by immunodeficiency, congenital myopathy, and anhydrotic ectodermal dysplasia (Feske et al., Citation2010; McCarl et al., Citation2009). ORAI1-deficient patients fail to mount antigen-specific antibody responses in response to vaccination with diphtheria and pertussis or infection with Candida, which is assumed to be a secondary defect caused by loss of T-cell activation (Feske, Citation2009). Patients with STIM1 deficiency interestingly also present with autoimmunity and lymphoproliferative disease, which have been attributed to effects on regulatory T (Treg) cells in addition to effector T-cells (Picard et al., Citation2009).
The T-dependent antibody response (TDAR) represents an in vivo model for immune function beyond proximal effects on cytokine production in T-cells. Although the in vitro activity of 2C1.1 on calcium flux and cytokine production in human cells has been demonstrated, it was not clear how inhibition of ORAI1 would compare to effects of a compound that inhibits calcineurin in an integrated immune response. The effect of CsA and other inhibitors of T-cell signaling have been reported in the cynomolgus monkey TDAR using a variety of immunogens and have shown very good dose-dependent efficacy (Piccotti et al., Citation2005; Srinivas et al., Citation1996). While CsA shows good activity in vivo and can fully block T-cell responses in vitro, it was less clear how the 2C1.1 antibody, a partial inhibitor of CRAC channel function, would perform. 2C1.1, a fully human anti-ORAI1 monoclonal antibody (mAb), was previously characterized (Lin et al., Citation2013). 2C1.1 is a potent and partial antagonist of CRAC function in Ca2+ flux and electrophysiology assays. 2C1.1 is also a potent inhibitor of stimulated cytokine production in human whole blood and Jurkat cells. The binding epitope for 2C1.1, mapped to the second extra-cellular loop of ORAI1, is conserved between human and cynomolgus monkey, as previously reported.
In this paper, the activity of 2C1.1 was compared to CsA on both stimulated cytokine secretion and sheep red blood cell (SRBC)-mediated TDAR in cynomolgus monkeys.
Materials and methods
Test and control articles
Cyclosporin A Oral Solution USP MODIFIED (Teva Pharmaceuticals, North Wales, PA) was obtained from a local pharmacy. The dosing solution contained 100 mg CsA/mL in deionized water with 11.9% [v/v] alcohol. Vehicle to be administered to control animals consisted of deionized water with 11.9% [v/v] alcohol. The human monoclonal anti-hORAI1 (clone 2C1.1) and control antibody (anti-DNP) dose solutions contained 10 mM sodium acetate (pH 5.0) plus 9% sucrose buffer. “A5SU”. 2C1.1 was prepared at Amgen; its generation and characterization of its binding to human and cynomolgus monkey ORAI1 and functional properties have been previously reported (Lin et al., Citation2013).
SRBC preparation
Sheep Red Blood Cell (Lampire Biological Laboratories, Pipersville, PA) solution (5 ml) was mixed with 45 ml phosphate-buffered saline (PBS, pH 7.4) and centrifuged for 10 min at 915 RCF. The resultant supernatant was removed and the cell pellet suspended in PBS. This process was repeated three times. The final cell concentration was then adjusted to 2 × 10⁹/ml in PBS prior to in vivo dose administration.
Animals
Cynomolgus macaques (Macaca fascicularis) of Chinese commercial origin (male, 3–8-years-of-age) were cared for in accordance to the Guide for the Care and Use of Laboratory Animals, 8th Edition (National Research Council, Citation2011). The in vivo studies were performed under pre-defined study protocols approved by the Institutional Animal Care and Use Committee. Animals were socially housed at an indoor AAALAC/internationally-accredited facility in species-specific housing. All animals were fed a certified pelleted primate diet (PMI #5048, Richmond, IN) daily in amounts appropriate for age and size, and each had ad libitum access to water (municipality tap water processed through a reverse osmosis filter and passed through UV light treatment) via an automatic watering system. The animals were maintained on a 12:12 h light:dark cycle in rooms maintained at 64–84°F, with 30–70% relative humidity, and each had access to enrichment opportunities. All animals were tested and found to be negative for simian retrovirus.
In vivo study design
A total of 32 naïve male cynomolgus monkeys (weighing 3.0–6.2 kg) were randomly assigned to each of four treatment groups (n = 8/group), i.e. CsA, vehicle, anti-DNP mAb, and anti-ORAI1 mAb after pre-screening for their ex vivo stimulated cytokine response and surface ORAI1 staining by FACS (detailed in supplemental results section). The experimental timeline is shown in . The dose used for CsA was selected based on published regimes in cynomolgus monkey kidney transplant models and was designed to maintain a trough concentration of 100 ng/ml (Gregory et al., Citation2004; Schuurman et al., Citation2001). The dose for 2C1.1 was selected based on a previously conducted PK study where occupancy of 2C1.1 was monitored.
Figure 2. Experimental timeline. Each PD analysis timepoint is indicated relative to dosing and SRBC administration.
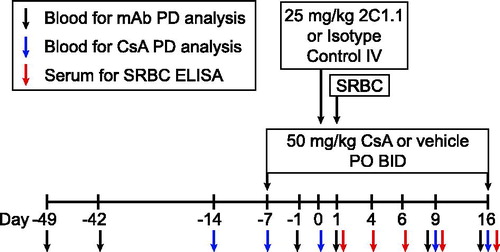
Cynomolgus monkeys in the CsA and vehicle treatment groups each received either 50 mg/kg CsA or vehicle twice a day via oral gavage (10 h apart) from study protocol days −7 to 16. The human monoclonal anti-DNP and anti-ORAI1 (clone 2C1.1) treatment groups received 25 mg/kg single dose of the appropriate mAb by intravenous (IV) bolus injection on study protocol day 0. This dose was shown in a previous PK/PD study (data not shown) in the cynomolgus monkey to provide full target occupancy by 2C1.1 for the desired timeframe. Monkeys from all four treatments groups were immunized with a single IV bolus injection of 109 SRBC/kg on study protocol day 1. Thus, on study day 1, SRBC were administered 1–2 h after the morning dose of CsA or vehicle, and 24 h following the anti-DNP or anti-ORAI1 mAb dose.
Blood collection for PK, stimulated cytokine production and target occupancy, ELISA, and clinical chemistry analysis
All blood samples were collected by venipuncture. Blood for all stimulated cytokine production, target occupancy, clinical chemistry, and CsA PK analyses were collected in sodium heparin vacutainer tubes. Blood for antibody PK and anti-SRBC ELISA assays were collected in serum separator tubes.
Stimulated cytokine production and target occupancy analysis samples (3.5 ml each) were collected on Days −14, −7, 0, 9, and 16 for the CsA or vehicle groups, and Days −49, −42, −1, 1, 9, and 16 for the antibody groups. These timepoints were selected to obtain baseline values prior to dosing for each animal and to monitor the course of SRBC specific IgM and IgG. The collected samples were shipped overnight on ice following each day’s collection.
PK analysis samples for the CsA treatment group (0.5 ml each) were collected in sodium heparin tubes on study protocol days 0 (at 0, 0.5, 2, 4, 8, and 12 h), 1 (0 h), 9 (0 h), and 16 (at 0, 0.5, 2, 4, 8, and 12 h). PK analysis samples for the antibody treatment groups were collected on Days 0 (at 0.5, 4, and 12 h), 1 (0 h), 4 (0 h), 9 (0 h), and 16 (0 h). Blood was allowed to clot at room temperature for ≈1 h and serum was harvested immediately thereafter and stored at or below −60 °C until analysis.
Blood samples for clinical chemistry were collected and the serum harvested on study protocol days −14, −7, and 16 for the CsA and vehicle groups, and days −49, −42, and 16 for the antibody groups. Blood samples for the anti-SRBC ELISA were also collected and harvested for serum on study protocol days 1, 4, 6, 9, and 16. All samples were kept at or below −60 °C until analysis.
Measurement of serum mAb 2C1.1
The concentration of total serum anti-ORAI1 mAb 2C1.1 was determined using an Enzyme-Linked Immunosorbent Assay (ELISA). The ELISA utilized a 96-well half-area micro-titer white plate (Corning, Tewksbury, MA) coated with an anti-human Fc to capture the total 2C1.1 mAb in serum samples. The assay plates were prepared by adding 2 µg/ml of anti-human Fc (clone 1.35.1) in PBS and blocked with I-Block™ (Applied Biosystems, Carlsbad, CA). Fifty microliters of serum (from each PK timepoint sample or standards), diluted 1:20 with PBS containing 1 M NaCl, 0.5% Tween-20, and 1% BSA buffer (leaving a 5% final serum concentration), was then added to the plates and the samples incubated for 1.5 h at room temperature. After washing the plates, 50 µl anti-human Fc (clone 21.1)-horseradish peroxidase (HRP) conjugate (at 100 ng/ml, prepared in I-Block™ with 5% BSA) was added to each well. The plates were then washed, and 50 µl Pico substrate (Thermo Fisher Scientific, Waltham, MA) was added to each well. The chemiluminescent signal from the reaction of the Pico substrate with HRP-tagged conjugate in each well was measured on a SpectraMax 384Plus Luminometer (Molecular Devices, Sunnyvale, CA). The concentration of free ORAI mAb 2C1.1 was also determined in the serum samples and was similar to total 2C1.1 concentrations. Therefore, only total concentrations are reported.
Measurement of plasma CsA
Plasma CsA concentrations were determined by an MRM based LC-MS/MS Bioanalytical method. Plasma (25 µl) from each time-point was combined with acetonitrile (ACN, 125 µl) containing 200 ng/ml of internal standard, vortex mixed, and centrifuged at 4000 × g for 5 min. Standard curve samples were prepared by spiking non-dosed plasma with known concentrations of CsA (11 concentrations from 0.5–5000 ng/ml) and processed using the same extraction procedure. LC separations were carried out on a UHPLC system (Prominence; Shimadzu Inc., Columbia, MD) using a Synergi Polar-RP column (4 µm, 50 × 2.0 mm; Phenomenex Inc., Torrance, CA) maintained at ambient temperature. The mobile phase consisted of 95% H2O/5% acetonitrile/0.1% formic acid (Solvent A) and 5% H2O/95% acetonitrile/0.1% formic acid (Solvent B). The following solvent gradient conditions were employed at a 0.8 ml/min flow rate: 0.0–0.3 min, 20% B; 0.3–1.0 min, 20–100% B; 1.0–1.5 min, 100% B; 1.5–1.6 min, 100–20% B. Under these solvent gradient conditions, CsA eluted at 1.27 min.
Analyte detection was accomplished with an MRM method in positive ion mode on a triple quadrupole mass spectrometer (API4000; AB Sciex, Foster City, CA) equipped with a turbospray ion source. Nitrogen was used as the nebulizer and auxiliary gas. The CsA MRM transition was m/z 1202 → m/z 100. MS instrument parameters were as follows: source temperature, 450 °C; curtain gas, 10 (arbitrary units); ion spray voltage, 4.5 kV; ion source gas 1, 30 (arbitrary units); ion source gas 2, 0 (arbitrary units); entrance potential, 10 V; declustering potential, 166 V; collision energy, 107 V; collision cell exit potential, 8 V. The lower and upper limits of quantitation for CsA were 1 and 5000 ng/ml, respectively. Peak areas were integrated using the Analyst software program (Version 1.5.1; AB Sciex); the results tables were exported and sample concentrations calculated from a standard curve fitted by a weighted (1/x2) linear regression in Watson software (version 7.4; Thermo Fisher Scientific).
Ex vivo whole blood stimulated cytokine production assay
2C1.1 and CsA were evaluated for their ability to inhibit cytokine production in response to PMA and ionomycin in an ex vivo whole blood setting, using blood from dosed animals. In brief, blood from each animal was stimulated with PMA/ionomycin with or without the addition of 2C1.1 (0.5 µM) or CsA (10 µM). This saturating concentration of 2C1.1 or CsA was added in vitro to determine the maximum achievable inhibition of each cytokine by each drug.
In a 96-well polystyrene flat bottom microtiter tissue culture plate, 100 µl blood/well was pre-incubated with 2C1.1, CsA, or media for 1 h prior to addition of PMA/ionomycin (Sigma, St. Louis, MO). All reagents were prepared in RPMI 1640 (Invitrogen, Carlsbad, CA) +10% human AB serum (Gemini Bio-Products, Woodland, CA) +1X PSG (penicillin, streptomycin, glutamine mixture; Invitrogen). The final concentration of whole blood was 50%. The final concentrations of 2C1.1, CsA, PMA, and ionomycin were, respectively, 0.5 µM, 10 µM, 25 ng/ml, and 1 µg/ml. These values were selected during assay development to give maximal response. After 24 h at 37 °C, supernatants were collected for cytokine analysis.
Interleukin (IL)-2, -4, -5, and -17 levels in the supernatants were determined using an electrochemiluminescent immunoassay from Meso Scale Discovery (MSD; Gaithersburg, MD). MSD Multi-Spot custom plates were pre-coated with human IL-2, -4, -5, and -17 capture anti-bodies. The plates were then blocked by addition of 150 µl MSD HSC assay diluent, incubated for 2 h at room temperature, and then each well washed three times (200 µl/wash) with PBS containing 0.05% Tween-20. Once the plates were prepared, 25 µl of supernatants was added to the wells and the plates incubated for 1 h at room temperature with rigorous shaking. A cocktail of human IL-2, -4, -5, and -17 detection antibodies was diluted to 1 µg/ml in MSD Ab diluent, and 25 µl was added to all test wells on the plates. Plates were then incubated for 1 h at room temperature (protected from light) with rigorous shaking. The plates were then washed with PBS, before 150 µl 2X MSD Read Buffer T (diluted with deionized water) was added to each well. Electro-chemiluminescence was immediately measured using an MSD SECTOR HTS Imager.
The percentage of inhibition (POI) directly related to each drug treatment was calculated relative to the average pre-dose cytokine measurements using the formula POI = [1 − (x/y)]*100, where x is the post-dose cytokine measurement, and y is the average of the pre-dose cytokine measurements from blood stimulated with PMA/ionomycin. Alternatively, the POI relative to the maximum achievable cytokine inhibition was calculated using the same formula, except the cytokine measurement from blood stimulated with PMA/ionomycin with the addition of 2C1.1 or CsA was subtracted from x and y.
Determination of ORAI1 target occupancy on cynomolgus monkey T-cells
The occupancy for ORAI1 on cynomolgus monkey T-cells following in vivo treatment with 2C1.1 was measured by flow cytometry. Blood was collected into sodium heparin vacutainer tubes, and shipped overnight on ice. In a 96-well microtiter plate, 40 µl blood was pre-incubated with 500 nM of unlabeled 2C1.1 or PBS/0.5% BSA for 1 h at room temperature. Alexa Fluor 647-labeled 2C1.1 and phycoerythrin (PE)-labeled anti-CD3 (clone SP34-2, BD Biosciences, San Jose, CA) were then added to both samples, and the plates incubated for 30 min at room temperature protected from light. PharmLyse (BD Biosciences) was then added to the blood and the plate again incubated for 15 min at room temperature to lyse red blood cells. The samples were then centrifuged at 1400 rpm for 5 min, the supernatants were discarded, and the remaining cells washed twice with PBS/0.5% BSA before undergoing flow cytometric analysis.
Measurement of SRBC-specific IgM/IgG
Anti-SRBC IgM and IgG levels in serum were determined using an ELISA specific for SRBC antigen. This ELISA method utilized a Corning 96-well half-area microtiter white plate coated with SRBC antigen to capture SRBC-specific IgM and IgG in the monkey serum samples. The assay plates were prepared by adding 12 µg SRBC antigen/ml PBS, and then incubating overnight at 4 °C, before being washed. The wells were then blocked with I-Block™ reagent overnight at 4 °C and then again washed. Once the plates were prepared, 50 µl diluted serum samples (diluted 40, 160, 640, and 2560× in I-Block™ reagent containing 5% BSA) was added to dedicated wells and the plates incubated for 1.5 h at room temperature. The plates were then washed, 50 µl of 100 ng/mL goat anti-monkey IgM-HRP or IgG-HRP conjugate (Rockland, Gilbertsville, PA) prepared in I-Block™ reagent with 5% BSA was added, and the wells and the plates then incubated for 1.5 h at ambient temperature. The plates were then washed, and 50 µl Pico substrate was added to each well. Chemiluminescent signal was then measured in the Spectra-Max 384Plus Luminometer.
Statistical analysis
Primary immune responses (IgG and IgM levels) to SRBC were evaluated statistically with one experiment intended to study the effect of CsA on primary immune responses and the other experiment intended to study the effect of 2C1.1 on primary immune response. Each experiment had 16 animals allocated equally to the treatment group and its corresponding control group (vehicle control for CsA and the isotype control for 2C1.1)
All statistical analyses were performed in SAS version 9.2 on a Windows Vista operating system. The IgG and IgM responses were log-transformed before the statistical analyses and the results were back-transformed before reporting. p Values <0.05 were considered statistically significant.
For each experiment and each type of primary immune response, a by-timepoint one-way analysis of variance (ANOVA) model was applied to the log transformed primary immune responses. Levene’s test was applied to evaluate the equal variance assumption of each ANOVA model. When Levene’s test failed for an ANOVA model, a one-way ANOVA model assuming unequal variance across the two groups was then applied.
Results
A whole blood PMA/ionomycin assay and whole blood target occupancy assay were used to measure the pharmacodynamic (PD) effects of each therapeutic agent for the duration of the study. Addition of PMA (an activator of protein kinase C) and ionomycin (an ionophore) to whole blood leads to cytokine induction. A whole blood target occupancy assay was developed to monitor the degree of antibody binding of the receptor over time. By measuring the cytokine levels in response to PMA/ionomycin stimulation, and measuring the level of target occupancy, we were able to determine the PD effects of CsA and the ORAI1 mAb. These measurements were performed according to the timeline in .
Pharmacokinetics of CsA and 2C1.1
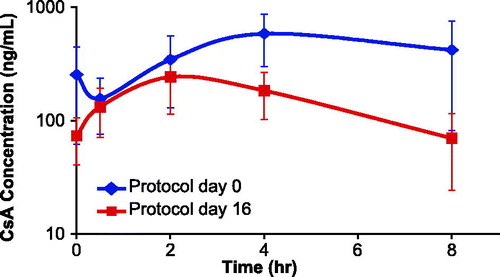
Plasma CsA pharmacokinetic (PK) profiles on protocol Days 0 and 16 are displayed in ; individual subject plasma concentrations are detailed in . Overall, CsA PK displayed significant inter-subject variability; CsA concentrations were sufficiently high to maintain maximal inhibition of the stimulated IL-2 throughout the course of the study, although inhibition of other cytokine responses was variable after Day 0.
Figure 3. Average CsA plasma concentration (ng/ml) in male Cynomolgus monkeys following repeat oral dose administration. Animals in the CsA group were administered 50 mg/kg PO twice daily from study protocol day −7 to +16. Concentrations were measured following the AM doses on protocol days 0 and 16. Error bars display one standard deviation from the mean plasma concentration. The blue squares represent values from Day 0 of sampling, while the red squares show results from Day 16 samples.
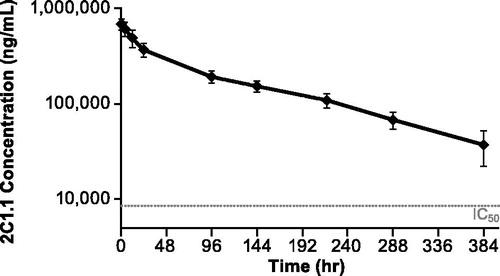
Serum 2C1.1 mAb PK profiles are shown in . The 2C1.1 serum concentrations were almost identical at each timepoint, as would be anticipated for a membrane bound receptor target. At its lowest concentration (≈36 000 ng/m; at 384 h post-dose), the 2C1.1 levels were 4.3-fold over the IC50 for an in vitro ICRAC assay. The extrapolated serum concentration of the IC50 for that assay is shown as a dotted line on . ORAI1 is a key component of the CRAC channel, as shown in , and the electrophysiology assay measures conductance of the CRAC channel (ICRAC) (Lin et al., Citation2013). In addition, the 2C1.1 concentrations achieved during this study drove full occupancy of ORAI1 on T-cells throughout the study (see below). Maximal inhibition of each of the ex vivo measurements in the PMA/ionomycin-induced cytokine release assay was observed in the cynomolgus monkey blood at the concentrations achieved.
Figure 4. Average 2C1.1 mAb serum concentration (ng/ml) in male cynomolgus monkeys following a single IV dose. Animals in the 2C1.1 group were administered a single IV 25 mg/kg bolus dose on study protocol day 0. Error bars display one standard deviation from the mean plasma concentrations. The dotted line represents the IC50 concentration on iCRAC, as reported in Lin et al. (Citation2013).
CsA treatment inhibits cytokine production ex vivo in stimulated whole blood
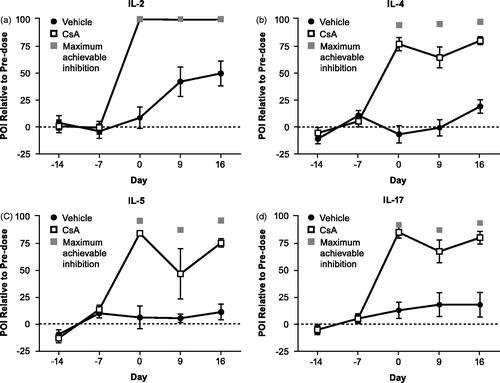
Treatment with CsA at 50 mg/kg BID resulted in reduction of IL-2, IL-4, IL-5, and IL-17 cytokine production from PMA/ionomycin stimulation of whole blood starting on Day 0 and continuing through the end of study on Day 16 (). There was complete inhibition of IL-2 production, and partial but significant inhibition of IL-4, IL-5, and IL-17 production. The vehicle control had no effect on IL-4 and IL-5 production over this same time period. Some inhibition of IL-2, and to a lesser extent IL-17, was observed in the vehicle-dosed animals on Days 9 and 16. The reason for this observation is unclear, and this effect was seen in only a subset of vehicle-treated animals.
The ex vivo whole blood assay was also utilized as a pharmacodynamic measurement of target coverage. At each timepoint, blood was spiked with 10 µM CsA prior to stimulation with PMA/ionomycin to determine the maximum achievable inhibition (complete target coverage), using IL-2 as the primary endpoint. CsA treatment achieved 100% maximal inhibition of the ex vivo IL-2 response on Days 0, 9, and 16 (). CsA treatment achieved 82 [± 10]%, 68 [± 25]%, and 82 [± 9]% maximal inhibition of the ex vivo IL-4 response on Days 0, 9, and 16, respectively (), with similar inhibition achieved for IL-5 () and IL-17 (). Vehicle treatment caused 43–50% and 13–21% maximal inhibition of the ex vivo IL-2 and IL-17 responses, respectively, but had no effect on the IL-4 and IL-5 responses (). Based on these ex vivo IL-2 measurements, it was concluded CsA completely covered Ca2+ induced IL-2 production for the duration of the study.
Figure 5. Pharmacodynamic effects of CsA or vehicle on ex vivo PMA + ionomycin-induced cytokines. Cynomolgus monkeys (n = 8/group) were dosed with 50 mg/kg BID CsA or vehicle from day −7 to +16. Blood was collected pre-dose (Days −14 and −7) and post-dose (Days 0, 9, and 16), and stimulated with PMA + ionomycin for 24 h. Supernatants were measured for IL-2, IL-4, IL-5, and IL-17. CsA treatment blocked ex vivo production of PMA + ionomycin-induced (a) IL-2, (b) IL-4, (c) IL-5, and (d) IL-17. Error bars display the standard error of the mean. The gray squares on Days 0, 9, and 16 for each cytokine represent the maximum achievable inhibition, which was determined by spiking in a 10 µM saturating concentration of CsA in vitro.
2C1.1 treatment inhibits ex vivo stimulated whole blood
Treatment with a single 25 mg/kg IV dose of 2C1.1 inhibited IL-2, -4, -5, and -17 production from PMA/ionomycin-induced whole blood starting on Day 1 and continuing through the end of study on Day 16. Extent of inhibition varied between cytokines. The greatest inhibition was seen with IL-2 and was similar to the level of inhibition achieved with CsA. The least inhibition was observed with IL-5. 2C1.1 treatment inhibited 90 [± 7]%, 88 [± 10]%, and 70 [± 45]% of the ex vivo IL-2 production on Days 1, 9, and 16, respectively (). 2C1.1 treatment inhibited 60%, 27–38%, and 34-42% of the ex vivo IL-4, IL-5, and IL-17 production, respectively, on Days 1–16 (). Anti-DNP-IgG2 control had no effect on PMA/ionomycin-induced cytokine production. The levels of cytokine inhibition in cynomolgus monkeys treated with 2C1.1 were not as great as those observed with CsA with the exception of IL-2. This result was consistent based on the pre-screening data with 2C1.1; however, it is not clear why IL-2 regulation by NFAT would be more sensitive to CRAC inhibition compared to NFAT regulation of the other cytokines measured.
Figure 6. Effects of 2C1.1 or DNP-IgG2 on ex vivo PMA + ionomycin-induced cytokines. Cynomolgus monkeys (n = 8/group) were dosed with 25 mg/kg 2C1.1 or DNP-IgG2 on Day 0. Blood was collected pre-dose (Days −49, −42, and −1) and post-dose (Days 1, 9, and 16), and stimulated with PMA + ionomycin for 24 h. Supernatants were measured for IL-2, IL-4, IL-5, and IL-17. 2C1.1 treatment blocked ex vivo production of PMA + ionomycin-induced (a) IL-2, (b) IL-4, (c) IL-5, and (d) IL-17. Error bars display standard error of the mean. The light gray and dark gray squares on Days 1, 9, and 16 for each cytokine represent the maximum achievable inhibition for 2C1.1 and CsA, respectively, which was determined by spiking in a 0.5 µM saturating concentration of 2C1.1 or a 10 µM saturating concentration of CsA in vitro.
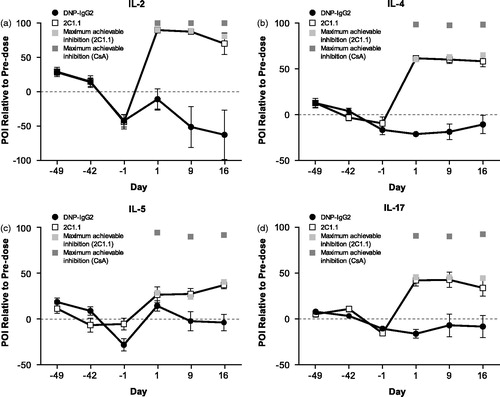
Although 2C1.1 treatment did not completely inhibit all PMA/ionomycin-induced cytokines, the maximum achievable inhibition for 2C1.1 was maintained over the course of the entire study. At each timepoint, blood was spiked with 500 nM 2C1.1 prior to the stimulation with PMA/ionomycin to determine the maximum achievable inhibition. 2C1.1 treatment achieved an >92% mean maximal inhibition of the ex vivo cytokine responses on Days 0 and 9, and 66–93% mean maximal inhibition of the ex vivo cytokine response on Day 16 (). The less effective inhibition of cytokines on Day 16 was primarily attributable to one animal that lost the pharmacodynamic effect on Day 16 (data not shown).
2C1.1 treatment achieves full occupancy of ORAI1 on T-cells
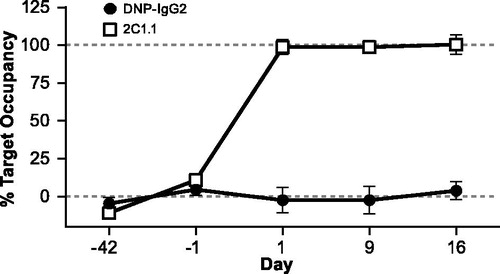
The single 25 mg/kg IV dose of 2C1.1 was able to fully occupy cynomolgus ORAI1 on the surface of T-cells on Day 1, continuing through the end of study on Day 16 (). No target occupancy was observed with the DNP-IgG2 antibody control.
Figure 7. Measurement of target occupancy on T-cells. Cynomolgus monkeys (n = 8/group) were dosed with 25 mg/kg 2C1.1 or DNP-IgG2 on Day 0. Blood was collected pre-dose (on days −42 and −1) and post-dose (Days 1, 9, and 16), and stained with Alexa Fluor 647-labeled 2C1.1. Mean fluorescent intensity (MFI) of the labeled 2C1.1 staining was measured on T-cells by flow cytometry. MFI values obtained from an in vitro spike of unlabeled 2C1.1 were used to calculate maximum target occupancy. Data is graphed as the percentage target occupancy relative to mean of the two pre-dose values and the maximum target occupancy. Error bars display standard deviation from the mean.
CsA blocked the primary immune response to SRBC
As expected for calcineurin inhibition, SRBC-specific IgM and IgG were significantly lower (p ≤ 0.0135 for IgM and p < 0.0001 for IgG) in animals dosed with CsA compared to animals dosed with the vehicle control on Days 9, 12, and 16 post-immunization ( and ). There was an 80% or greater reduction in SRBC-specific IgM on Days 9–16. SRBC-specific IgG was decreased by ≥95% on Days 9–16. This is similar to the degree of inhibition observed in rats using a Keyhole Limpet Hemocyanin (KLH) immunization model (Smith et al., Citation2003).
Figure 8. Effects of CsA or 2C1.1 on SRBC-specific IgM and IgG. Cynomolgus monkeys (n = 8/group) were dosed with 50 mg/kg BID CsA or vehicle from Day −7 to +16 and 25 mg/kg 2C1.1 or DNP-IgG2 on Day 0. SRBC was administered on Day 1. Blood was collected post-dose (Days 1, 9, 12, and 16), and serum isolated. SRBC-specific IgM and IgG levels were determined by ELISA, and reported as relative light units (RLU). Data was log-transformed, and a one-way ANOVA was used to compare groups at individual timepoints. CsA treatment resulted in a significant reduction of SRBC specific (a) IgM and (b) IgG on Days 9, 12, and 16 (p ≤ 0.0135). SRBC-specific IgM was reduced by 76–80% relative to vehicle control on Days 9–16. SRBC-specific IgG was reduced by 95–96% relative to vehicle control on Days 9–16. Although animals treated with 2C1.1 trended higher in their SRBC-specific (c) IgM and (d) IgG responses on Days 9, 12, and 16, they did not reach statistical significance. Error bars display the standard error of the mean.
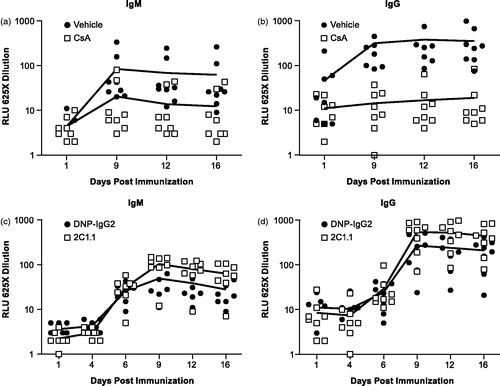
2C1.1 fails to block the primary immune response to SRBC
There was no decrease in SRBC-specific IgM and IgG in animals dosed with 2C1.1 compared to animals dosed with the DNP-IgG2 antibody control on Days 9, 12, and 16 post-immunization ( and ). Compared to DNP-IgG2, animals treated with 2C1.1 had 226%, 209%, and 217% higher SRBC-specific IgM on, respectively, Days 9, 12, and 16. SRBC-specific IgG was also higher on Days 9, 12, and 16 (227%, 232%, and 223%, respectively) in animals treated with 2C1.1. However, the 2C1.1 treated group did not show a statistically significant difference from the DNP-IgG2 control. It would require group sizes of at least 12 animals to achieve sufficient statistical power to distinguish the differences observed here, given the large variation in animal responses to immunization, variations which are consistent with previous observations around the variability of TDAR assay responses in non-human primates (Lebrec et al., Citation2011). It should be noted that the study design was powered with the expectation that there would be an inhibitory effect similar to that of CsA given the similar level of IL-2 inhibition observed with both molecules.
Discussion
An SRBC model of T-cell-dependent antibody responses (TDAR) in cynomolgus monkeys was utilized to determine the pharmacologic activity of 2C1.1, a fully human anti-ORAI1 monoclonal antibody. CsA was used as a positive control given that it interdicts in the same Ca2+ signaling pathway as ORAI1 and is a validated inhibitor of T-cell activation in both cynomolgus monkeys and humans (Gregory et al., Citation2004; Vercauteren et al., Citation1998).
Table 1. Plasma cyclosporin A (CsA) concentrations (ng/ml) in male cynomolgus monkeys following repeat oral dose administrations.
Table 2. SRBC-specific IgM and IgG (RLU) in animals treated with vehicle or CsA.
Table 3. SRBC-specific IgM and IgG (RLU) in animals treated with anti-DNP-IgG2 or 2C1.1.
In the present study, the pharmacokinetics of CsA and 2C1.1 were evaluated in the context of target coverage as measured by multiple ex vivo assays. The pharmacodynamic activity of CsA and 2C1.1 was evaluated based on the test article ability to suppress stimulated cytokine production in cynomolgus whole blood. Treatment with CsA or 2C1.1 prevented ex vivo stimulated IL-2 production and the level of inhibition was maintained for the duration of the study with the dosing regimen used. CsA consistently demonstrated a greater level of inhibition for stimulated cytokines other than IL-2 when compared to 2C1.1, despite our demonstration that 2C1.1 showed full target occupancy on CD4+ T-cells. We have no clear explanation for this difference; we speculate that other cells such as NK or NKT cells may be producing cytokines such as IL-17 that we are measuring in whole blood. If those cells are impervious to CRAC inhibition with 2C1.1, that could account for the differences observed.
The pharmacologic activity of CsA and 2C1.1 was evaluated by measuring their effect on the formation of SRBC-specific antibodies following immunization with SRBC antigen. As expected for CsA, there was significant reduction in the levels of both SRBC-specific IgM and IgG. 2C1.1 blockade of cynomolgus ORAI1, in contrast, did not show inhibition of SRBC-specific IgM and IgG. The lack of inhibition of the immune response to SRBC immunization by 2C1.1 suggests that complete inhibition of the CRAC channel may be required to impact a functional immune response, consistent with what is known for human patients deficient in ORAI1 function where heterozygote carriers of defective ORAI1 alleles show no changes in immune function while homozygous individuals are immunodeficient (Feske, Citation2011). An alternative explanation is that there is a difference in the requirement for the level of SOC within T-cell subsets, particularly in Treg cells, that would result in differential inhibition using 2C1.1. It has been proposed previously that Treg cell populations may be more sensitive to inhibition of CRAC compared to effector T-cells (Oh-Hora & Rao, Citation2009; Oh-Hora et al., Citation2013), and it is clear from published experiments with genetically engineered mice where CRAC function is perturbed through modulation of Stim1 or Orai1 that subsets of T-cells, particularly Treg cells, are more sensitive to loss of CRAC function than effector T-cells (Jin et al., Citation2013; Oh-Hora et al., Citation2013, and reviewed in Shaw & Feske, Citation2012). A stronger impact on Treg cells compared to the effect on effector T-cells (CD4+ T-cells) with 2C1.1 administration would explain the null effect of CRAC inhibition on the SRBC TDAR in the presence of decreased IL-2 production.
In summary, this study demonstrated there are differences in blocking the CRAC pathway at different levels using the fully-human anti-ORAI1 antibody 2C1.1 as compared against the small molecule calcineurin inhibitor CsA in a SRBC TDAR model in a cynomolgus monkey. Given the results, we suggest further work will need to be done in the primate immune system to fully understand the relationship between CRAC inhibition and the immune response, particularly around the sensitivity of different immune cell subsets to partial versus complete CRAC inhibition.
Declaration of interest
All authors were employed at Amgen Inc., Thousand Oaks, California at the time of this study.
| Abbreviations | ||
| ACN, | = | acetonitrile; |
| BID, | = | bis in die [i.e. twice daily]; |
| CRAC, | = | calcium release-activated calcium; |
| CsA, | = | cyclosporin A; |
| DAG, | = | diacylglycerol; |
| DNP, | = | dinitrophenyl; |
| ECL, | = | electrochemiluminescence; |
| ELISA, | = | enzyme-linked immunosorbent assay; |
| ER, | = | endoplasmic reticulum; |
| KLH, | = | Keyhole Limpet Hemocyanin; |
| IL, | = | interleukin; |
| InsP3, | = | inositol-1,4,5-trisphosphate; |
| mAb, | = | monoclonal antibody; |
| MFI, | = | mean fluorescence intensity; |
| MRM, | = | multiple reaction monitoring; |
| MSD, | = | Mesoscale Discovery; |
| NFAT, | = | nuclear factor of activated T-cells; |
| PBS, | = | phosphate-buffered saline; |
| PD, | = | pharmacodynamic; |
| PIP2, | = | phosphatidylinositol-3-4-bisphosphate; |
| PK, | = | pharmaco-kinetic; |
| PLCγ1, | = | phospholipase Cγ1; |
| PMA, | = | phorbol 12-myristate-13-acetate; |
| POI, | = | percentage of inhibition; |
| RLU, | = | relative luminescence units; |
| SCID, | = | severe combined immunodeficiency; |
| SEB, | = | staphylococcal enterotoxin B; |
| SOC, | = | store-operated calcium; |
| SRBC, | = | sheep red blood cell; |
| STIM1, | = | stromal interaction molecule 1; |
| STIM2, | = | stromal interaction molecule 2; |
| TCR, | = | T-cell receptor; |
| TDAR, | = | T-cell-dependent antibody response. |
Supplementary material available online
Supplementary Table 1 and Figure 1
supplemental_material_915897.tiff
Download TIFF Image (1.8 MB)Acknowledgements
This work was supported by Jim Meyer, Department of PKDM, Amgen Inc., Thousand Oaks, CA. The authors wish to thank Herve Lebrec for critical review and helpful suggestions with the study design and manuscript.
References
- de Boer, M. L., Mordvinov, V. A., Thomas, M. A., and Sanderson, C. J. 1999. Role of nuclear factor of activated T-cells (NFAT) in the expression of IL-5 and other cytokines involved in the regulation of hemopoetic cells. Int. J. Biochem. Cell. Biol. 31:1221–1236
- Feske, S. 2007. Calcium signalling in lymphocyte activation and disease. Nat. Rev. Immunol. 7:690–702
- Feske, S. 2009. ORAI1 and STIM1 deficiency in human and mice: Roles of store-operated Ca2+ entry in the immune system and beyond. Immunol. Rev. 231:189–209
- Feske, S. 2011. Immunodeficiency due to defects in store-operated calcium entry. Ann. NY Acad. Sci. 1238:74–90
- Feske, S., Giltnane, J., Dolmetsch, R., et al. 2001. Gene regulation mediated by calcium signals in T-lymphocytes. Nat. Immunol. 2:316–324
- Feske, S., Gwack, Y., Prakriya, M., et al. 2006. A mutation in Orai1 causes immune deficiency by abrogating CRAC channel function. Nature 441:179–185
- Feske, S., Okamura, H., Hogan, P. G., and Rao, A. 2003. Ca2+/calcineurin signaling in cells of the immune system. Biochem. Biophys. Res. Commun. 311:1117–1132
- Feske, S., Picard, C., and Fischer, A. 2010. Immunodeficiency due to mutations in ORAI1 and STIM1. Clin. Immunol. 135:169–182
- Feske, S., Prakriya, M., Rao, A., and Lewis, R. S. 2005. A severe defect in CRAC Ca2+ channel activation and altered K+ channel gating in T-cells from immunodeficient patients. J. Exp. Med. 202:651–662
- Gregory, C. R., Kyles, A. E., Bernsteen, L., et al. 2004. Compared with cyclosporine, ISATX247 significantly prolongs renal-allograft survival in a non-human primate model. Transplantation 78:681–685
- Jin, S., Chin, J., Kitson, C., et al. 2013. Natural regulatory T-cells are resistant to calcium release-activated calcium (CRAC/ORAI) channel inhibition. Int. Immunol. 25:497–506
- Lebrec, H., Cowan, L., Lagrou, M., et al. 2011. An inter-laboratory retrospective analysis of immunotoxicological endpoints in non-human primates: T-cell-dependent antibody responses. J. Immunotoxicol. 8:238–250
- Lewis, R. S. 2001. Calcium signaling mechanisms in T-lymphocytes. Annu. Rev. Immunol. 19:497–521
- Lin, F. F., Elliott, R., Colombero, A., et al. 2013. Generation and characterization of fully human monoclonal antibodies against human Orai1 for autoimmune disease. J. Pharmacol. Exp. Ther. 345:225–238
- Liou, J., Kim, M. L., Do Heo, W., et al. 2005. STIM is a Ca2+ sensor essential for Ca2+-store-depletion-triggered Ca2+ Influx. Curr. Biol. 15:1235–1241
- Lissner, D., and Siegmund, B. 2013. Ulcerative colitis: Current and future treatment strategies. Digest. Dis. 31:91–94
- Liu, X. K., Lin, X., and Gaffen, S. L. 2004. Crucial role for nuclear factor of activated T-cells in T-cell receptor-mediated regulation of human IL-17. J. Biol. Chem. 279:52762–52771
- McCarl, C. A., Picard, C., Khalil, S., et al. 2009. ORAI1 deficiency and lack of store-operated Ca2+ entry cause immunodeficiency, myopathy, and ectodermal dysplasia. J. Allergy Clin. Immunol. 124:1311–1318
- Naesens, M., Kuypers, D. R., and Sarwal, M. 2009. Calcineurin inhibitor nephrotoxicity. Clin. J. Am. Soc. Nephrol. 4:481–508
- National Research Council. 2011. Guide for the Care and Use of Laboratory Animals: 8th Edition. Washington, D.C.: National Academies Press
- Oh-Hora, M. 2009. Calcium signaling in the development and function of T-lineage cells. Immunol. Rev. 231:210–214
- Oh-Hora, M., Komatsu, N., Pishyareh, M., et al. 2013. Agonist-selected T-cell development requires strong T-cell receptor signaling and store-operated calcium entry. Immunity 38:881–895
- Oh-Hora, M., and Rao, A. 2008. Calcium signaling in lymphocytes. Curr. Opin. Immunol. 20:250–258
- Oh-Hora, M., and Rao, A. 2009. The calcium/NFAT pathway: Role in development and function of regulatory T-cells. Microbes Infect. 11:612–619
- Parekh, A. B., and Putney, J. W. 2005. Store-operated calcium channels. Physiol. Rev. 85:757–810
- Picard, C., McCarl, C. A., Papolos, A., et al. 2009. STIM1 Mutation associated with a syndrome of immunodeficiency and autoimmunity. New Engl. J. Med. 360:1971–1980
- Piccotti, J. R., Alvey, J. D., Reindel, J. F., and Guzman, R. E. 2005. T-Cell-dependent antibody response: Assay development in cynomolgus monkeys. J. Immunotoxicol. 2:191–196
- Prakriya, M., Feske, S., Gwack, Y., et al. 2006. Orai1 is an essential pore subunit of the CRAC channel. Nature 443:230–233
- Putney, J. J. 1986. A model for receptor-regulated calcium entry. Cell Calcium 7:1–12
- Roos, J., Digregorio, P. J., Yeromin, A. V., et al. 2005. STIM1, an essential and conserved component of store-operated Ca2+ channel function. J. Cell Biol. 169:435–445
- Schuurman, H. J., Slingerland, W., Mennninger, K., et al. 2001. Pharmacokinetics of cyclosporine in monkeys after oral and intramuscular administration: Relation to efficacy in kidney allografting. Transplant. Intl. 14:320–328
- Shaw, P. J., and Feske, S. 2012. Regulation of lymphocyte function by ORAI and STIM proteins in infection and autoimmunity. J. Physiol. 590:4157–4167
- Smith, H. W., Winstead, C. J., Stank, K. K., et al. 2003. A predictive F344 rat immunotoxicology model: Cellular parameters combined with humoral response to NP-CγG and KLH. Toxicology 194:129–145
- Srinivas, N. R., Weiner, R. S., Warner, G., et al. 1996. Pharmacokinetics and pharmaco-dynamics of CTLA4lg (BMS-188667), a novel immunosuppressive agent, in monkeys following multiple doses. J. Pharm. Sci. 85:1–4
- Vercauteren, S. B., Bosmans, J. L., Elseviers, M. M., et al. 1998. A meta-analysis and morphological review of cyclosporine-induced nephrotoxicity in auto-immune diseases. Kidney Int. 54:536–545
- Vig, M., Beck, A., Billingsley, J. M., et al. 2006. CRACM1 multimers form the ion-selective pore of the CRAC channel. Curr. Biol. 16:2073–2079
- Yeromin, A. V., Zhang, S. L., Jiang, W., et al. 2006. Molecular identification of CRAC channel by altered ion selectivity in a mutant of Orai. Nature 443:226–229
- Zhang, S. L., Yu, Y., Roos, J., et al. 2005. STIM1 is a Ca2+ sensor that activates CRAC channels and migrates from the Ca2+ store to the plasma membrane. Nature 437:902–905