
Abstract
Exposure to small amounts of beryllium (Be) can result in beryllium sensitization and progression to Chronic Beryllium Disease (CBD). In CBD, beryllium is presented to Be-responsive T-cells by professional antigen-presenting cells (APC). This presentation drives T-cell proliferation and pro-inflammatory cytokine (IL-2, TNFα, and IFNγ) production and leads to granuloma formation. The mechanism by which beryllium enters an APC and is processed to become part of the beryllium antigen complex has not yet been elucidated. Developing techniques for beryllium detection with enough sensitivity has presented a barrier to further investigation. The objective of this study was to demonstrate that Accelerator Mass Spectrometry (AMS) is sensitive enough to quantify the amount of beryllium presented by APC to stimulate Be-responsive T-cells. To achieve this goal, APC - which may or may not stimulate Be-responsive T-cells - were cultured with Be-ferritin. Then, by utilizing AMS, the amount of beryllium processed for presentation was determined. Further, IFNγ intracellular cytokine assays were performed to demonstrate that Be-ferritin (at levels used in the experiments) could stimulate Be-responsive T-cells when presented by an APC of the correct HLA type (HLA-DP0201). The results indicated that Be-responsive T-cells expressed IFNγ only when APC with the correct HLA type were able to process Be for presentation. Utilizing AMS, it was determined that APC with HLA-DP0201 had membrane fractions containing 0.17–0.59 ng Be and APC with HLA-DP0401 had membrane fractions bearing 0.40–0.45 ng Be. However, HLA-DP0401 APC had 20-times more Be associated with the whole cells (57.68–61.12 ng) than HLA-DP0201 APC (0.90–3.49 ng). As these findings demonstrate, AMS detection of picogram levels of Be processed by APC is possible. Further, regardless of form, Be requires processing by APC to successfully stimulate Be-responsive T-cells to generate IFNγ.
Introduction
Over one million American workers have been exposed to beryllium (Be) and are at risk of developing Chronic Beryllium Disease (CBD) (Henneberger et al., 2004; Infante & Newman, Citation2004; Newman et al., Citation2004). Previous studies from our research group and others have mapped pathways by which Be elicits the proliferation of Be-specific CD4+ T-helper (TH)-1 cells (Rossman et al., Citation1988; Saltini et al., Citation1989, Citation1990), clonal expansion into Be-specific effector-memory T-cells (Fontenot et al., Citation2002, Citation2005; Saltini et al., Citation1990), and up-regulation of pro-inflammatory cytokine production (Fontenot et al., Citation2002; Tinkle et al., Citation1997). Together, amplification of these Be-specific T-cell-mediated responses results in the granulomatous inflammation associated with CBD. The integral role of antigen-presenting cells (APC) in the activation of Be-specific T-cells is shown by the ability of anti-HLA-DP (and to a much lesser extent anti-HLA-DR) monoclonal antibodies to inhibit both Be-specific T-cell proliferation and pro-inflammatory cytokine expression by CBD bronchoalveolar lavage (BAL)-derived CD4+ T-cells (Fontenot et al., Citation2002).
A further requirement for successful Be presentation is the necessity of a glutamic acid at position 69 of the β chain of the HLA-DP molecule. APC with HLA-DP molecules containing a glutamic acid at position 69 (Glu69 genotype, such as HLA-DP0201), but not APC lacking this glutamic acid (such as HLA-DP0401) can activate Be-specific T-cell proliferation and cytokine production (Amicosante et al., Citation2005; Fontenot et al., Citation2000, Citation2002; Sawyer et al., 2004b). HLA-DP0201 and HLA-DP0401 vary only at the β69 position, but presentation of Be by APC with HLA-DP0401 does not successfully activate Be-responsive T-cells. Despite these advances in our understanding of the role of T-cell activation in the pathogenesis of CBD, the precise chemical form of the Be-antigen is still unknown. Further, it has not yet been conclusively shown that Be uptake is a requirement for presentation. However, one paper (Fontenot et al., Citation2006) has suggested that Be uptake and processing of beryllium salts by APC is not required for Be-specific T-cell proliferation, albeit in a limited set of experiments.
In the sets of experiments reported here, a Be-ferritin adduct (Sawyer et al., 2004a) was used to deliver Be to APC for processing and presentation to Be-responsive T-cells. We hypothesized that Accelerator Mass Spectrometry (AMS) would be sensitive enough to quantify the Be processed for presentation by APC. To demonstrate that the amount of Be-ferritin used in these experiments would also stimulate Be-responsive T-cells, a set of experiments was also undertaken in which Be-responsive T-cells were cultured with Be-ferritin adducts and APC that either had/had not been treated to halt cellular processing. Intracellular cytokine assays were then performed to detect T-cell-derived interferon (IFN)-γ, as a metric for successful stimulation of the Be-responsive T-cells.
Materials and methods
Cell culture
This series of experiments utilized two APC lines with different HLA types that differ in their ability to stimulate Be-responsive T-cells. Specifically, the 1332-EBV cell line is a human EBV-transformed B-cell line homozygous for HLA-DP0201 that has been previously shown to successfully present Be to Be-responsive T-cells (Fontenot et al., Citation2000, Citation2001). In some experiments, as a negative control for cellular processing by these APC, the 1332-EBV line was fixed by incubating the APC for 1 h at 37 °C in 0.25% formaldehyde and then washing them 3-times in 5 ml PBS (pH 7.4) just prior to use (Fontenot et al. Citation2000; Lu et al., Citation2003). As a negative control for Be-responsive T-cell activation, the HHKB cell line was used. This cell line is also a human EBV transformed B-cell line, but is homozygous for HLA-DP0401; APC of this HLA type fail to stimulate Be-specific T-cells (Fontenot et al., Citation2000). The final cell line used in these experiments, 1332-BALTCL, is a BAL-derived Be-responsive T-cell line shown to proliferate and secrete IFNγ in response to Be presentation by APC with the correct HLA type (Fontenot et al., Citation2000). All cells were grown in HyClone RPMI-1640 with glutamine (ThermoFisher, Pittsburgh, PA), 10% fetal bovine sera (Sigma, St. Louis, MO), 100 penicillin U/ml, 100 streptomycin µg/ml, 100 µM sodium pyruvate, 0.1 nM HEPES, and 1% fungizone (all ThermoFisher) at 37 °C in a 5% CO2 incubator.
Ferritin adduct generation
Be-Ferritin adducts were prepared as previously described (Price & Joshi, Citation1983; Sawyer et al., 2004a). In brief, 4 mg horse ferritin (Sigma) was added along with 36 µg beryllium sulfate (1 M BeSO4; ThermoFisher) to a 4 ml solution of 0.2 M Tris-acetate buffer (pH 6.5). This solution was heated to 37 °C for 30 min and then transferred to 6 kDa Slide-a-Lyzer (Promega, Madison WI) cassettes and dialyzed for 48 h at 4 °C in 4 L of 0.02 M Tris-acetate buffer (pH 6.5) to separate beryllium bound to ferritin (Be-ferritin) from free beryllium. The dialysis buffer was changed 3-times in the 48-h period. Solutions were removed from dialysis cassettes and stored at 4 °C until utilized. Quantification of Be bound to ferritin (in the form of Be-ferritin adducts) was determined by ICP-MS (West Coast Analytical Service, Santa Fe Springs, CA), in triplicate. Be-ferritin adducts for AMS were prepared as described above, except in this case the source of Be used was a mixture of 10Be/9Be at 1 mg/ml in HNO3 (Chiarappa-Zucca et al., Citation2004).
HLA-DP surface expression
HHKB and 1332-EBV cells were grown as described above, either with the addition of 1 ng IFNγ/ml media for 10 days or without IFNγ. The cells were then removed from culture and centrifuged at 400 × g for 5 min to pellet and then washed twice in 10 ml room temperature phosphate-buffered saline (PBS, pH 7.4) by centrifugation (400 × g, 5 min). The cells were then suspended in residual PBS (∼100 μl). Antibodies were added to each tube - 0.25 μg anti-CD20-FITC (eBioscience, San Diego, CA) and 0.25 μg anti-HLA-DP-biotin (B7.21 antibody, a generous gift from Dr. Fontenot at UCD) - and the mixtures incubated for 60 min at 4 °C in the dark. PBS (10 ml) was then added to each tube and the materials centrifuged (400 × g, 5 min). The tubes were decanted to remove wash PBS/non-bound antibody and the cells suspended in residual supernatant. To each tube, 0.5 μg Strepavidin-PE (BD Biosciences, San Jose, CA) was added and the cells were incubated for 60 min at 4 °C in the dark. Following the incubation, 10 ml PBS was added to each tube, cells were centrifuged (400 × g, 5 min), and supernatants were decanted to remove unbound Strepavidin. The cells were then suspended in FACS Fix solution (PBS [pH 7.4], 0.7% NaN3, 10% formaldehyde) and stored at 4 °C until processed in a FACS Caliber flow cytometer (BD, Franklin Lakes, NJ). All data were analyzed using FlowJo software (FlowJo, Ashland OR) to generate mean fluorescence intensity for PE (HLA-DP). A minimum of 45 000 events/sample were acquired.
IFNγ intracellular cytokine staining
In duplicate wells of a 96-well round bottom polystyrene plate (Corning, Corning, NY), 2 × 10⁵ APC (1332-EBV, 1332-EBV fixed [incubated at 37 °C in 0.25% formaldehyde for 1 h] or HHKB) grown in the presence of 10 ng IFNγ/ml media for 10 days, were combined with 2 × 10⁵ 1332-BALTCL cells and the final volume adjusted to 200 µl with growth media. Stimuli, i.e. medium alone, 0.33 M Tris-Acetate, 40 µg ferritin, 10 ng/ml staphylococcal enterotoxin B (SEB), 100 µM BeSO4, 6 µM Be-ferritin, 12 µM Be-ferritin, 18 µM Be-ferritin, or 25 µM Be-ferritin, were then added to specific wells to the final levels indicated. Cells were then incubated at 37 °C (in 5% CO2) for 60 min before 1 µg Brefeldin A was added to each well to stop cell protein secretion. The cells were then incubated for 5 h at 37 °C (in 5% CO2).
Following incubation, the cells were centrifuged (400 × g, 5 min), supernatants decanted, and the cells washed 3-times (each with 250 μl PAB [PBS {pH 7.4} containing 1% BSA] solution) by centrifugation (400 × g, 5 min). Following the final wash, the pelleted cells were suspended in residual PAB and incubated for 15 min with 5 μl FcR blocking reagent/well (Miltinyi Biotec, Auburn, CA) to block non-specific binding. The cells were then treated with 2 μl anti-CD3-FITC (BD Biosciences) and 2 μl anti-CD4-APC (eBiosciences) in the dark for 60 min at 4 °C; each antibody was diluted 1:50 in FACS buffer (PBS [pH 7.4], 0.01% NaN3, 1 mg γ-globulins/ml). Thereafter, the cells were washed with PAB as above and placed in fixation medium (Caltag, Burlingame, CA) overnight at 4 °C. Cells were then washed again (twice with PAB as above) and suspended in Permeabilization Buffer (Caltag) as per manufacturer recommendations. The samples were then incubated with 2 μl anti-IFNγ-PE (Life Technologies, Grand Island, NY; diluted 1:25 in FACS staining buffer) in the dark for 60 min at 4 °C before being washed twice with PAB and suspended in residual PAB. Using the FACS Calibur system, lymphocyte populations were identified by forward and 90° light-scatter patterns. These populations were further delineated into T-cells expressing IFNγ using the CD3, CD4, and IFNγ fluorescence antibodies. A minimum of 25 000 events/sample was acquired.
Maximal Be-ferritin association determination
Antigen-presenting cells were cultured as described above with the addition of 10 ng IFNγ/ml media for 10 days prior to Be challenge. IFNγ-cultured cells were added to 6-well plates (at 2 × 10⁶ cells/well) and incubated for 2 h at 37 °C (in 5% CO2) to allow time to settle. In triplicate, Be-ferritin adducts (at 728 ng Be/ml Tris-acetate [pH 6.5]) were added to wells to yield a final concentration of either 50 μM or 10 μM Be-ferritin. To other wells, 1 M BeSO4 was added to yield triplicate final concentrations of 100 μM or 10 μM BeSO4. All cells were then incubated for 0, 24, 48 or 72 h at 37 °C (in 5% CO2). At each timepoint, the contents of each well were removed to individual 50 ml conical tubes. Each well was washed twice with 3 ml cold growth media and these washes were pooled to corresponding 50 ml tubes. The tubes were then centrifuged at 400 × g for 5 min to pellet cells and the pellets then washed three times in 50 ml room temperature PBS (pH 7.4) by centrifugation (400 × g, 5 min/wash) to remove unbound Be-ferritin. Cells were then suspended in 1 ml homogenization buffer (0.25 M sucrose, 10 mM Tris-HCl [pH 7.4], 1 mM EDTA) that received 50 µl Sigma Protease Inhibitor Cocktail (Sigma) just prior to use. Cells were then measured for Be content by ICP-MS (in triplicate) (see below). Amounts of Be detected at 24, 48, and 72 h were normalized to the amount detected at time 0 (0 h) within each treatment.
Be processing by APC
Ten days prior to challenge with Be-ferritin, cells were cultured in the growth media previously described with the addition of 10 ng IFNγ/ml. On the day of challenge, cells were removed from culture flasks, washed twice by centrifugation at 400 × g for 5 min using warmed (37 °C) growth media, and then added to 6-well plates at 7.5 × 10⁵ cells/well. Media was then added to each well to bring the total volume to 2 ml in each well and the cells were incubated for 2 h at 37 °C (in 5% CO2) to allow time to settle. Radioactive Be-ferritin (10Be/9Be) adducts (at 450 ng/ml) were added to each well, yielding a final Be concentration of 50 µM. Following a 72-h incubation at 37 °C (in 5% CO2), the cells were collected and washed as described above, suspended in 1 ml homogenization buffer (see above) and then subjected to cell fractionation.
Each cell sample was separated into seven sub-samples by differential centrifugation. Briefly, cells were lysed using a VirSonic 50 sonicator (Virtis, Gardiner, NY) 4-times for 5 s at 50% power. An initial sub-sample of 50 µl was transferred to a 1.5 ml Eppendorf tube. The remaining 950 µl sample was centrifuged at 400 × g for 5 min. Resulting supernatants were removed to new tubes while each pellet was suspended in 500 µl homogenization buffer. A sub-sample (50 µl) of the supernatant was transferred to a new 1.5 ml Eppendorf tube. The remaining supernatant (∼900 µl) was centrifuged at 10 000 × g for 15 min. Resulting supernatants were removed to new ultra-speed centrifuge tubes, while a sub-sample (50 µl) of each supernatant was transferred to a 1.5 ml Eppendorf tube. Resulting pellets were each suspended in 500 µl homogenization buffer and the remaining supernatants (∼850 µl) were centrifuged at 100 000 × g for 60 min at 4 °C. The final supernatant was removed to a new 1.5 ml Eppendorf tube while the final pellet was suspended in 500 µl homogenization buffer and transferred to a new 1.5 ml Eppendorf tube. All samples were then stored at −80 °C until subjected to AMS.
AMS sample preparation
Sample preparation for AMS analysis was performed by the methods described by Finkel & Nishiizumi (Citation1997) and Chiarappa-Zucca et al. (Citation2004), in which Be was extracted, acid digested, precipitated, and then oxidized. In brief, samples were placed in 25 ml Teflon beakers (Savillex Corp., Minnetonka, MN) with 2.0 ml HNO3 (70% [v/v]). This solution was then heated to 100 °C until samples were close to dryness, to eliminate organic impurities. Samples were then suspended in 5 ml 2.0% HNO3 and Be extracted by adding 20–30 µl perchloric acid. Samples were then covered with plastic watch glasses and taken to dryness before being hydrated in 3 mL of 3 M HNO3.
Be was precipitated from solutions by drop-wise addition of NaOH until the solution reach a pH of 8.5–9.0. Samples were then incubated at room temperature for 24 h and then centrifuged (10 min, 1500 × g). Supernatants were discarded and precipitated Be transferred to 17 mm × 9 mm quartz crucibles (Ace Glass Company, Louisville, KY) for the oxidation step. The crucibles were placed under a heat lamp to dry and then baked at 500 °C. Thereafter, 1.0 mg niobium (Alfa Aesar, Ward Hill, MA) was added to each crucible and the sample + niobium was homogenized in the crucible using a #56 drill stem (Precision Twist Drill Company, Crystal Lake, IL) that had been washed with acetone, rinsed with ultra-pure water, and dried prior to use. Following the homogenization, samples were transferred to aluminum sample holders previously washed in acetone and rinsed in ethyl acetate. Once samples were in the holders, they were packed using the #56 drill stem and a hammer.
10Be AMS measurement
AMS measured the 10Be/9Be ratio in the prepared samples. Measurements were made in quasi-simultaneous injection mode, in which 10Be3+ counts were measured for 300 ms, followed by measurement of 9Be3+ current for 5 ms. This rapid cycling provided an implicit internal correction for time-dependent drifts of the ion source output; this cycle was repeated for the duration of the measurement. Sample 10Be/9Be ratios were determined by comparing ratios of 10Be counts to 9Be-integrated charge to the same ratio for a standard. Samples were typically counted for a maximum of 5 min for low 10Be3+ count samples or 2-times (< 5 min) for high 10Be3+ count samples - for an overall counting precision of 0.5–2.0%.
Be measurement by inductively coupled plasma mass spectrometry (ICP-MS)
Samples assayed by ICP-MS were sent to West Coast Analytical Service for Be determination by SOP 7040 (Trace Metal detection by ICP-MS). Reported limits of detection of Be for this laboratory are 0.1 ppb.
Results
IFNγ intracellular cytokine staining
An intracellular cytokine assay was used to determine if processing of the Be-ferritin adducts was required for successful stimulation of Be-responsive T-cells (). A robust IFNγ response was observed among Be-responsive T-cells treated with SEB (positive control), regardless of the APC used. Conversely, T-cells did not respond to either of the negative controls, Tris-acetate, or ferritin, regardless of APC.
Figure 1. Percentage of Be-responsive T-cells expressing IFNγ. Percentage of Be-responsive T-cells expressing IFNγ (±SE; n = 3) when 100 μM BeSO4 was presented by 1332-EBV presenting cells (black bars) was significantly reduced when either paraformaldehyde-treated 1332-EBV (grey bars; * p < 0.001) or HHKB (white bars; # p < 0.001) cells were used as APC. Percentage of T-cells expressing IFNγ was not significantly different when 1332-EBV cells presented 100 μM BeSO4 compared to 6, 12, 18, or 25 μM Be-ferritin or SEB. T-cell expression of IFNγ was not induced by either Tris-acetate or ferritin (used to generate Be-ferritin adducts). All assays were performed by incubating cells in the presence of stimuli for 60 min and then halting cytokine export by treatment with Brefeldin A and allowing cytokines to accumulate within cells for 5 h prior to fixing.
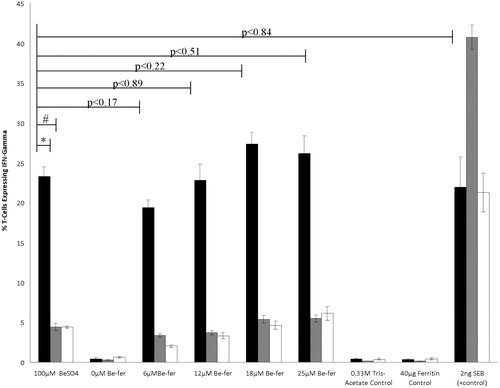
When Be-responsive T-cells were presented 100 μM BeSO4 by 1332-EBV cells, 23.32% of the T-cells made IFNγ, a percentage significantly higher than the 4.42% T-cells that responded when 100 μM BeSO4 was presented by formaldehyde fixed 1332-EBV cells or 4.38% T-cells that responded when 100 μM BeSO4 was presented by HHKB cells (p ≤ 0.0006). Similar T-cell IFNγ response profiles were observed within each Be-ferritin adduct treatment level. More Be-responsive T-cells made IFNγ when Be-ferritin was cultured with 1332-EBV as the APC then either fixed 1332-EBV or HHKB cells as the APC: treatment levels 6 μM (p ≤ 0.0005), 12 μM (p ≤ 0.003), 18 μM (p ≤ 0.0006), and 25 μM (p ≤ 0.006). No significant variation in the percentage of T-cells expressing IFNγ was observed when 1332-EBV cells presented 100 μM BeSO4 or various Be-ferritin adducts: 6 μM (p ≤ 0.17), 12 μM (p ≤ 0.89), 18 μM (p ≤ 0.22), and 25 μM (p ≤ 0.51).
Maximal Be-ferritin association determination
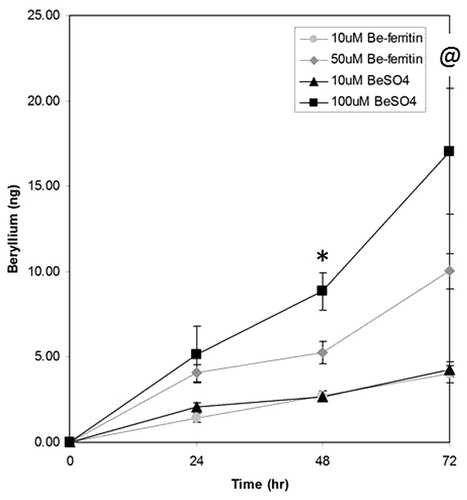
Antigen-presenting cells (1332-EBV) were isolated and assayed by ICP-MS to determine if Be association varied depending on Be source, sulfate or adduct, and exposure time (). At 24 h, there were no statistical differences in the amounts of Be across the four treatments. However, by 48 h, the amount of Be associated with cells exposed to 100 μM BeSO4 (8.84 ± 2.17 ng) was significantly higher than the amount associated with cells exposed to either 10 μM BeSO4 (2.63 ± 0.24 ng; p ≤ 0.019) or 10 μM Be-ferritin adduct (2.72 ± 0.64 ng; p ≤ 0.005). By 72 h, cells exposed to 100 μM BeSO4 demonstrated increased Be association (17.05 ± 7.40 ng) when compared to those exposed to either 10 μM BeSO4 (4.28 ± 0.64 ng; p ≤ 0.039) or 10 μM Be-ferritin adduct (4.00 ± 1.03 ng; p ≤ 0.049). The amount of Be associated with cells exposed to 100 μM BeSO4 did not significantly differ from the amount of Be found with cells exposed to 50 μM Be-ferritin adduct at any timepoint tested (p < 0.20).
Figure 2. Time-dependent association of beryllium with APC. Association of beryllium with 1332-EBV cells (±SE; n = 3) increases with time. At time 0 and 24 h, there was no statistically significant differences across treatment in the amount of Be associating with cells. At 48 h, the amount of Be associating with cells cultured with 100 μM BeSO4 was higher than with cells cultured with either 10 μM BeSO4 or 10 μM Be-ferritin (*p < 0.019 and p < 0.001, respectively). At 72 h, the amount of Be associating with cells challenged with 100 μM BeSO4 was higher than with cells challenged with 10 μM BeSO4 or 10 μM Be-ferritin (@p < 0.049). The amount of Be associating with cells was not statistically different between the cells in the 100 μM BeSO4 and 50 μM Be-ferritin regimens (p < 0.20).
Levels of Be associated with cell fractions
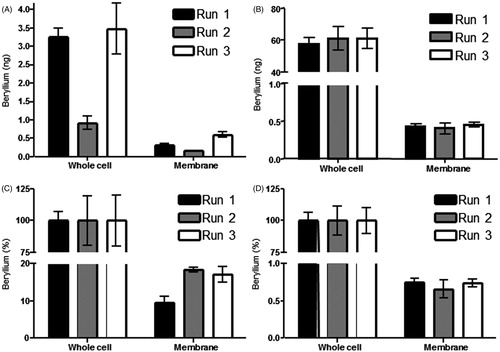
Be association with total APC and cell membranes of APC was assayed by AMS or ICP-MS (). Total amounts of Be associated with 1332-EBV total cells varied from 0.90–3.49 ng (), while the amount of Be associated with the HHKB cells was above the level of detection for AMS. However, when assayed by ICP-MS, the amount of Be associated with the total HHKB cell was determined to range from 57.68–61.12 ng (). The amount of Be associated with the membrane fractions for 1332-EBV ranged from 0.17–0.59 ng (), while the amount of Be associated with the HHKB membrane fractions varied from 0.40–0.45 ng ().
Figure 3. Beryllium association with sub-cellular fractions of APC. All detections were preformed following 72 h incubation. (A) AMS detection of beryllium associated with lysed 1332-EBV whole cells preformed following a 72 h incubation (0.90–3.49 ng) and the membrane fraction (0.17–0.59 ng) of the same APC (n = 3). (B) ICP-MS detection of Be associated with HHKB lysed whole cells following a 72 h incubation (57.68–61.12 ng) and AMS detection of Be associated with membrane fraction (0.40–0.45 ng) of the same APC (n = 3). (C) Amount of Be associated with membrane fraction of 1332-EBV cells as a percentage of total Be associated with the cell following a 72 h incubation (n = 3; 9.59–18.41%). (D) Amount of Be associated with membrane fraction of HHKB cells as a percentage of total Be associated with the cell following a 72 h incubation (n = 3; 0.65–0.75%).
Be associating with the membrane fraction of the APC is presented to Be-responsive T-cells in the context of HLA. To determine if the amounts of Be associating with the cell surface varied due to the amount of HLA on the cell surface, we utilized flow cytometry to quantify the amount of HLA-DP on both the HHKB and 1332-EBV cell lines. When antigen presenting cells used in these experiments were grown for 10 days prior to challenge in media with the addition of 10 ng IFNγ/ml media, the amount of HLA-DP on the cell surface was equal to one another (p ≤ 0.62).
Discussion
Over one million American workers have been exposed to beryllium and are at risk for beryllium sensitization (BeS). Of these sensitized workers, 6–8% per year progress to CBD (Infante & Newman, Citation2004; Newman et al., Citation2005). A large amount of work by our group and others has shown that APC expressing an HLA containing a glutamic acid at position 69 of the β-pleated sheet (Glu69) are able to successfully present Be to stimulate Be-responsive T-cells. Once presented antigen, Be-responsive T-cells proliferate and/or secrete pro-inflammatory cytokines. However, the exact nature of the Be antigen remains unknown. In this set of experiments, our group exposed two antigen presenting cells lines which varied only at position 69 of the β-chain to Be-ferritin adducts to track Be processing in the APC by AMS. We further performed experiments to confirm this amount of Be-ferritin could drive a Be-specific T-cell response.
Intracellular cytokine assays demonstrated that not only could the amount of Be-ferritin used in these sets of experiments drive Be-responsive T-cells to produce IFNγ, but that Be-ferritin was able to induce this cytokine response using at least 16-times less Be as compared to BeSO4 (). It is our contention that Be-ferritin adducts were more efficiently taken up by APC than were free Be salts. This more efficient uptake was not exhaustively tested due to sample scarcity. Future studies should be conducted to definitively determine the relative efficiency of ferritin as a delivery vehicle for Be in the presence of Be-responsive T-cells. Further, while beyond the scope of this paper, investigating whether Be delivered to APC by Be-ferritin also affected the amount of IFNγ on a per-cell basis could expand our understanding of CBD pathogenesis. This experiment further showed that processing of Be-ferritin or Be salts was required for successful presentation to Be-responsive T-cells (Figure 1). Specifically, formaldehyde-treated APC of the correct HLA type - which were not able to process antigen but maintain an intact extracellular HLA, as determined by successful SEB stimulation - failed to successfully activate Be-responsive T-cells to generate IFNγ, when cultured with Be-ferritin. It was also noted that this fixing of the 1332-EBV cell line abrogated its ability to successfully stimulate the Be-responsive T-cell line to generate IFNγ when cultured with BeSO4.
This result appeared to contradict previously published data (Fontenot et al., Citation2006). However, the previously published data used Be-responsive T-cell proliferation and not IFNγ generation as the metric of T-cell responsiveness. There is a lack of correlation between Be-specific proliferation and Be-specific cytokine-secretion by CD4+ T-cells in blood (Fontenot et al., Citation2005; Pott et al., Citation2005). Further, over time, Be-responsive T-cells lose the ability to proliferate while maintaining an ability to generate cytokines (unpublished observations). Once this study had confirmed that Be-ferritin would induce Be-responsive T-cells to generate pro-inflammatory cytokines, the localization of Be within APC was investigated utilizing AMS and ICP-MS.
Initial ICP-MS experiments revealed that Be association with APC increased over time, regardless of Be form (). Furthermore, overall amounts of Be were higher when cells were exposed to higher doses of Be. Utilizing these results, 1332-EBV and HHKB were exposed to 50 µM concentrations of Be-ferritin to test the hypothesis that both cell lines, regardless of HLA-DP type, would process similar amounts of Be, as deterimined by measuring the amount of Be associating with both the total cell and cell membrane fraction. However, the amount of Be associating with the HHKB whole cell was 20-times higher than that with the 1332-EBV whole cell (). Regardless of total amount of Be associating with the two cell lines, overall amounts of Be associating with the membrane fractions of the two APC lines were not statistically different from one another. When the amounts of Be associated with the membranes of the two APC were calculated as a percentage of Be associated with the total cell, the values varied greatly (p ≤ 0.006; ). It is possible that HHKB cells more efficiently took up Be-ferritin adducts through a receptor-mediated process. However, this observation was tangental to our main goals and has not yet been investigated. Since the amount of HLA-DP on the cell surfaces did not vary between the two cell lines, it can be hypothesized that maximal amounts of Be were presented on the cell surface by each APC in the context of membrane-bound HLA-DP.
Utilizing both ferritin as a delivery vehicle for Be and AMS for the detection of Be, this study has shown it is possible to quantify the amount of Be processed by APC for successful stimulation of Be-responsive T-cells. This APC processing yields a relatively small amount of Be ( < 0.6 ng) associated with the APC cell membrane for presentation to Be-responsive T-cells. Detection of this small amount of Be may only be possible by utilizing AMS.
Besides AMS, graphite furnace atomic absorption spectrometry (GFAAS) is the most sensitive way to detect Be. However, several of the membrane samples from this series of studies would have been near or below the limits of detection for GFAAS (Stephan et al., Citation2008). To our knowledge, this is the first time that AMS has been utilized to detect a metal antigen processed by a cell system. This sensitivity of detection suggests potential value in using this technology in future research addressing the interaction between metal ions and biologically relevant molecules.
Declaration of interest
The authors report no conflicts of interest. The authors alone are responsible for the content and writing of the paper.
Acknowledgements
The authors would like to thank Dr Tristan Barnes and Dr Dick Sawyer for their help in the developmental phase of this study as well as Roger Martinelli and Susan Zimmermann for their assistance with the AMS analyses.
References
- Amicosante, M., Berretta, F., Rossman, M., et al. 2005. Identification of HLA-DRPheβ47 as the susceptibility marker of hyper-sensitivity to beryllium in individuals lacking the berylliosis-associated supratypic marker HLA-DPGluβ69. Respir. Res. 6:94
- Chiarappa-Zucca, M. L., Finkel, R. C., Martinelli, R. E., et al. 2004. Measurement of beryllium in biological samples by accelerator mass spectrometry: Applications for studying Chronic Beryllium Disease. Chem. Res. Toxicol. 17:1614–1620
- Finkel, R. C., and Nishiizumi, K. 1997. Beryllium-10 concentrations in the Greenland Ice Sheet Project 2 ice core from 3–40 ka. J. Geophys. Res. 102:26669–26706
- Fontenot, A. P., Canavera, S. J., Gharavi, L., et al. 2002. Target organ localization of memory CD4+ T-cells in patients with Chronic Beryllium Disease. J. Clin. Invest. 110:1473–1482
- Fontenot, A. P., Keizer, T. S., McCleskey, M., et al. 2006. Recombinant HLA-DP2 binds beryllium and tolerizes beryllium-specific pathogenic CD4+ T-cells. J. Immunol. 177:3874–3883
- Fontenot, A. P., Newman, L. S., and Kotzin, B. L. 2001. Chronic Beryllium Disease: T-cell recognition of a metal presented by HLA-DP. Clin. Immunol. 100:4–14
- Fontenot, A. P., Palmer, B. E., Sullivan, A. K., et al. 2005. Frequency of beryllium-specific, central memory CD4+ T-cells in blood determines proliferative response. J. Clin. Invest. 115:2886–2893
- Fontenot, A. P., Torres, M., Marshall, W. H., et al. 2000. Beryllium presentation to CD4+ T-cells underlies disease-susceptibility HLA-DP alleles in Chronic Beryllium Disease. Proc. Natl. Acad. Sci. USA 97:12717–12722
- Henneberger, P. K., Goe, S. K., Miller, W. E., et al. 2004. Industries in the United States with airborne beryllium exposure and estimates of the number of current workers potentially exposed. J. Occup. Environ. Hyg. 1:648–659
- Infante, P. F., and Newman, L. S. 2004. Beryllium exposure and Chronic Beryllium Disease. Lancet 363:415–416
- Lu, L., Vollmer, J., Moulon, C., et al. 2003. Components of the ligand for a Ni++ reactive human T-cell clone. J. Exp. Med. 197:567–574
- Newman, L. S., Mroz, M. M., Balkissoon, R., and Maier, L. A. 2005. Beryllium sensitization progresses to Chronic Beryllium Disease: A longitudinal study of disease risk. Am. J. Respir. Crit. Care Med. 171:54–60
- Newman, L. S., Rose, C. S., Bresnitz, E. A., et al. 2004. A case control etiologic study of sarcoidosis: Environmental and occupational risk factors. Am. J. Respir. Crit. Care Med. 170:1324–1330
- Pott, G. B., Palmer, B. E., Sullivan, A. K., et al. 2005. Frequency of beryllium-specific, TH1-type cytokine-expressing CD4+ T-cells in patients with beryllium-induced disease. J. Allergy Clin. Immunol. 115:1036–1042
- Price, D. J., and Joshi, J. G. 1983. Ferritin. Binding of beryllium and other divalent metal ions. J. Biol. Chem. 258:10873–10880
- Rossman, M. D., Kern, J. A., Elias, J. A., et al. 1988. Proliferative response of bronchoalveolar lymphocytes to beryllium. A test for Chronic Beryllium Disease. Ann. Int. Med. 108:687–693
- Saltini, C., Kirby, M., Trapnell, B. C., et al. 1990. Biased accumulation of T-lymphocytes with “memory”-type CD45 leukocyte common antigen gene expression on the epithelial surface of the human lung. J. Exp. Med. 171:1123–1140
- Saltini, C., Winestock, K., Kirby, M., et al. 1989. Maintenance of alveolitis in patients with Chronic Beryllium Disease by beryllium-specific helper T-cells. New Engl. J. Med. 320:1103–1109
- Sawyer, R. T., Day, B. J., Fadok, V. A., et al. 2004a. Beryllium-ferritin: Lymphocyte proliferation and macrophage apoptosis in Chronic Beryllium Disease. Am. J. Respir. Cell. Mol. Biol. 169:893–895
- Sawyer, R. T., Parsons, C. E., Fontenot, A. P., et al. 2004b. Beryllium-induced TNFα production by CD4+ T-cells is mediated by HLA-DP. Am. J. Respir. Cell. Mol. Biol. 31:122–130
- Stephan, C. H., Fournier, M., Brousseau, P., and Sauve, S. 2008. Graphite furnace atomic absorption spectrometry as routine method for the quantification of Be in blood and serum. Chem. Cent. J. 2:14
- Tinkle, S. S., Kittle, L. A., Schumacher, B. A., and Newman, L. S. 1997. Beryllium induces IL-2 and IFNγ in berylliosis. J. Immunol. 158:518–526