
Abstract
Glutathione-S-transferases (GST) and aldo-keto reductases (AKR) are key aflatoxin (AF)-detoxifying enzymes. In this study, the expression of GST-M1, GST-T1, AKR-7A2, and AKR-7A3 genes in human monocytes and lymphocytes was analyzed after in vitro exposure to 10 or 100 ng AFB1/ml for 2 h. Unlike in pilot studies that showed that all four examined genes were present in HepG2 cells, in lymphocytes and monocytes, only GST-M1 and AKR-7A2 were detected. In fact, the induced expression of both GST-M1 and AKR-7A2 genes in human monocytes was moreso than that seen in AFB1-exposed lymphocytes. In addition, analyses of the effects of the exposures on cell cycle status were performed as, in cells lacking adequate detoxification capacities, it would be expected the cells would arrest at checkpoints in the cell cycle or progress to apoptotic/necrotic states. The results here indicated that only the high dose of AFB1 led to a change in cell cycle profiles and only in the monocytes (i.e. cells in S phase were significantly reduced). In general, the results here strongly suggest that human immune cell lineages appear to be able to increase their expression of AFB1-detoxifying enzymes (albeit to differing degrees) and, as a result, are able to counter potential toxicities from AFB1 and (likely) its metabolites.
Introduction
As one of the most bio-hazardous mycotoxins, aflatoxin (AF) B1 causes many failures in various organs, especially in the liver, and depending on the dose and the route of entrance in the kidney, lung, and colon in humans and animals (Wogan et al., Citation2012). Immune cells are key contributors to the prevention of cancer caused by xenobiotics, including various types of AF. First, they have to counteract any toxic effects of AFB1 against themselves and then prevent development of any cancers that might evolve in the exposed host. In monocytes and lymphocytes, AFB1 is mono-oxygenated by some cytochrome P450 isoforms (CYP), preferably CYP1A2, and is transformed to epoxide and di-aldehyde that adversely affects conformation of DNA and proteins (Bahari et al., Citation2014). It is also interesting to note that, in AFB1-exposed leukocytes, concomitant expression of AFB1-activating enzymes and cell cycle arrest occurs (Bahari et al., Citation2014). The pro-oxidant properties of AFB1 in cells (including immune cells; Mehrzad et al., Citation2011) could lead to a depletion of cellular ATP, thereby adversely affecting replication, transcription, and translation processes of DNA and, ultimately, cell division (Shenton et al., Citation2006). Thus, in cells lacking adequate detoxification capacities, it would be expected that cells would arrest at checkpoints in the cell cycle or progress to apoptotic/necrotic states.
Most commonly, to detoxify AFB1 and/or its metabolites, cells use binding by glutathione (GSH) to the most active form of AFB1, i.e. exo-AFB1 epoxide, to reduce its levels and so inhibit formation of AFB1-DNA adducts, and, in so doing, lowering the risk for mutagenic events to ensue. This conjugation – mediated by glutathione-S-transferase (GST) – also results in a product, i.e. GS-AFB1, that can be more readily exported from the cell than the parent AFB1 (Gross-Steinmeyer et al., Citation2010). Three forms of GST, i.e. cytosolic, mitochondrial, and microsomal, are expressed in human cells; among all the cytosolic GST with AFB1-detoxifying activity (Rotunno et al., Citation2012), isoform GST-M1 has a strong binding affinity to AFB1 and so a high AFB1 detoxifying capacity. The importance of this enzyme is reflected in the fact that a deletion of the GST-M1 gene in cells is known to increase the risk of human lung cancers by ∼17% (McWilliams et al., Citation1995). In addition, single nucleotide polymorphisms in GST-M1 have been shown to positively correlate with changes in AFB1-DNA adduct levels in cells (Long et al., Citation2009). Furthermore, it has also been shown that toxins in cigarette smoke are able to cause GST-M1/T1 down-regulation; while it is unlikely AFB1 will be found in cigarette smoke, this nevertheless implied that these types of enzymes are important to mitigate the overall risk for development of lung cancer due to smoking (Rotunno et al., Citation2012).
Among the metabolites of AFB1, the exo-epoxide in non-enzymatically converted AFB1 8-9 di-hydrodiol and AFB1 8-9 di-aldehyde. The latter, in turn, forms AFB1-lysine adducts, leading to conformational/functional changes in many immunologically-important proteins (Guengerich et al., Citation2002). Unlike the GST that rely on conjugation as a means of detoxification/mitigation of risk of harm from AFB1, aldo-ketoreductases (AKR) act by reducing AFB1 aldehydes to non-toxic AFB1 di-alcohols (Praml et al., Citation2008). Of all the members of the AKR superfamily, the most effective is AFB1-aldehyde reductase (AFAR) or AKR-7A2 (Schwab et al., Citation1996).
Despite the many studies that have detailed the plethora of AFB1 detoxification enzymes in cells like hepatocytes, it is still unknown whether lymphocytes and monocytes also might/can use these detoxifying pathways when exposed to this toxin. This study was, therefore, aimed to find how AKR and GST genes in monocytes and lymphocytes respond to AFB1 exposure and, further, what are the effects of AFB1 on the two cell types. In addition, this study sought to ascertain whether changes in expression of genes for AFB1-detoxyfying enzymes occurred in conjunction with increases in cell arrest and, if so, in which phases of the cell cycle.
Materials and methods
Chemicals
AFB1 was obtained from Sigma-Aldrich Chemie (Deisenhofen, Germany). All tissue culture medium components (RPMI 1640, human [AB] serum (at 10% in medium), L-glutamine, penicillin/streptomycin, non-essential amino acids, sodium pyruvate, and β-mercaptoethanol), as well as phosphate-buffered saline (PBS, pH 7.4), were purchased from Invitrogen (Carlsbad, CA). For use in the cultures, the AFB1 was prepared as a 0.1 mg/ml stock in 96% ethanol, and further dilutions were made with PBS vehicle.
Peripheral blood mononuclear cell (PBMC) isolation and treatments
Heparinized blood samples from four healthy individuals (age = 23 ± 1.4 years) were used to isolate human peripheral blood mononuclear cells (PBMC). Approval for these studies, the procedures of blood sampling and all in vitro experiments and assays, were in accordance to the local human/animal welfare regulations and the Ethical Committee of Ferdowsi University of Mashhad.
In brief, each blood sample was diluted 1:4 in PBS (without Mg2+, Ca2+) and then layered atop 15 ml Ficoll-Paque plus (Lympholyte®, Zierikzee, the Netherlands). After centrifugation (1100 × g, 20 °C, 40 min), the layer of PBMC was collected and the purified PBMC washed once (450 × g, 4 °C, 10 min) and again twice (180 × g, 4 °C, 5 min) with a solution of culture medium (Malvandi et al., Citation2013; Mehrzad et al., Citation2013). The isolated PBMC were then dispensed in 3 ml aliquots (at 107 PBMC/ml medium) into culture plates (3 cm diameter) and incubated for 2 h in a 37 °C chamber containing 95% humidity and 5% CO2. After the incubation, non-adherent cells (i.e. lymphocytes) in the culture medium were collected; adherent cells (monocytes) remaining on the plates were dislodged using gentle flushing with medium. Viability and numbers of each cell type were then confirmed using nigrosin solution and a Neubauer chamber. Each cell type was seeded at a density of 5 × 10⁶/ml culture medium into dedicated wells of 24-well tissue culture plates (2 ml/well) in duplicate. The wells then received AFB1 (or vehicle) such that the cells were treated with 0, 10, or 100 ng AFB1/ml. After a 2-h incubation, the contents of each well were collected and used for molecular analyses.
Molecular analysis of lymphocyte and monocyte RNA
Purified RNA from treated and control cells were extracted with RNA extraction Kit (DENAzist Asia, Mashhad, Iran); 1 µg of the isolated material from each cell population was then used for first strand cDNA synthesis (using oligo-dT primers). Exon junction or intron-spanning primers () were designed for AKR-7A3, AKR-7A2, GST-T1, GST-M1, and ACT-B. ‘5x HOT FIREPol® EvaGreen®qPCR Mix Plus’ (Solis BioDyne, Tartu, Estonia) was used to perform the qPCR, according to manufacturer protocols. Each qPCR reaction was done in a 20 µl final volume containing 10 pM of specific forward and reverse primers, 4 µl EvaGreen master mix, and 1 µl cDNA template. To optimize the qPCR assays, different concentrations (1, 0.1, 0.01, 0.001, 0.0001, and 0.00001 µg/µl) of cDNA were analyzed with the primers. qPCR conditions for all genes were carried out (in duplicate) using a Rotter gen 6000 light-cycler system (QIAGEN, Venlo, the Netherlands) with a cycling program including holding for 15 min at 95 °C, followed by cycling 45-times at 94, 58, and 72 °C (20 s for each temperature) with melting curve analyses (included ramping from 50–99 °C, rising 0.5 °C/step and waiting 10 s for each step afterward; a single peak was obtained in each qPCR product reaction) accompanied by agarose gel electrophoresis to ascertain the absence of non-specific PCR products.
Table 1. Designed primers sequences used in rt-qPCR.
Normalization and analyses of qPCR data were calculated using GenEX Version 5 software (MultiD, Göteborg, Sweden) and Relative Expression Software Tool (REST; QIAGEN, Hilden, Germany). In each qPCR reaction, the cycle number at which the fluorescence rose appropriately above background was determined as the crossing point (CP). Cycle threshold (Ct) values were means of duplicates in each qPCR run and four biological repeats after inter-plate calibration. Optimization experiments were also performed to ensure that the efficiency of the target and the reference genes was approximately equal. A Pfaffl equation (Pfaffl, Citation2001) was first used to calculate relative gene expression ratio, i.e. the change in each target gene expression divided by the change in ACT-B expression. A slope was determined from the exponential phase. Amplification efficiency (E) was calculated based on slope, where E = 10[−1/slope]. The expression of each target gene was calibrated to that of ACTB using the formula: Relative fold change
Cell cycle analysis
To analyze cell cycle patterns of monocytes and lymphocytes after the 2-h exposure to 0, 10, or 100 ng AFB1/ml, the cells were first permeabilized and fixed (Bahari et al., Citation2014). In brief, cells were fixed in 3% formaldehyde, washed with PBS (350 × g, 4 °C, 10 min), permeabilzed with 0.2% Tween-20 solution for 10 min (at 37 °C), and then washed again with PBS. After counting, to aliquots of 106 cells, propidium iodide (10 µg PI/ml; Sigma) and 30 U RNase/ml (Bioneer, Daejeon, South Korea) were added and the mixtures then incubated for 30 min at 20 °C. Ten thousands cells were collected and gated (based on the size of lymphocytes and monocytes after excluding debris and dead cells) in a FACSCalibur flow cytometer (BD, East Rutherford, NJ). The total number of lymphocytes and monocytes in sub-G1, G0/G1, S, and G2/M phases, as well as in apoptotic or necrotic states, were then enumerated in duplicate using flow cytometer software (Turku, Finland).
Statistics
Relative analysis of gene expression was performed based on the method of Pfaffl (Citation2001). Comparisons of the means between the AFB1-treated and control groups were performed using a Student’s t-test. All cell cycle assay data were analyzed using a one-way analysis of variance (ANOVA). A p-value ≤ 0.05 was accepted as significant.
Results
The analyses of the data indicated there was mRNA expression of AKR-7A2 and GST-M1, but not AKR-7A3 and GST-T1, in both monocytes and lymphocytes (, upper). In contrast, as was seen in pilot studies, transcripts for AKR-7A2, AKR-7A3, GST-T1, and GST-M1 could be detected in HepG2 cells (some pilot data presented). The RT-qPCR data revealed that expression levels of GST-M1 mRNA in lymphocytes and monocytes treated for 2 h with AFB1 were higher in those cells that received the lower dose of AFB1 (10 ng/ml) than the higher dose (100 ng/ml) group (). Comparatively, GST-M1 up-regulation was far more pronounced (>50-fold) in monocytes. Intriguingly, 100 ng AFB1/ml resulted in significant down-regulation of GST-M1 mRNA only in the monocytes.
Figure 1. AFB1 detoxification genes expressed in human monocytes, lymphocytes, and HepG2 cells during responses to AFB1. (Upper panel) Four AFB1 detoxification genes and β-actin (ACT-B) mRNA in monocytes (M), lymphocytes (L), and HepG2 cells (H) were measured by RT-PCR. (Lower panel) Comparative transcription of GST-M1 and AKR-7A2 in monocytes and lymphocytes exposed to 10 or 100 ng AFB1/ml for 2 h. All data were normalized to ACT-B internal control. Relative expression level of each gene in control monocytes and lymphocytes was set at 1.0. Data shown are means (±SEM) of cells from four individuals.
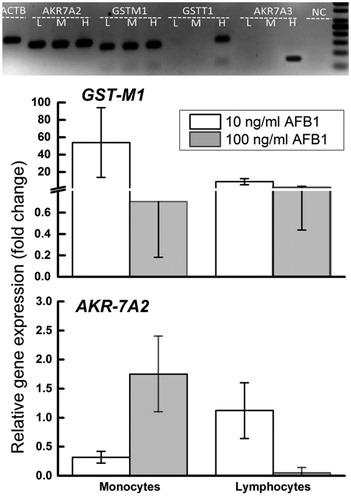
In comparison to the GST-M1, induced AKR-7A2 expression was weaker in both the lymphocytes and monocytes after either dose of AFB1 (). Further, with respect to the monocytes, the higher AFB1 dose led to a much higher expression of the AKR-7A2. In addition, induction of the gene was lower in the monocytes than in the lymphocytes when the lower AFB1 dose was employed, yet far greater when the dose was increased ≈10-times.
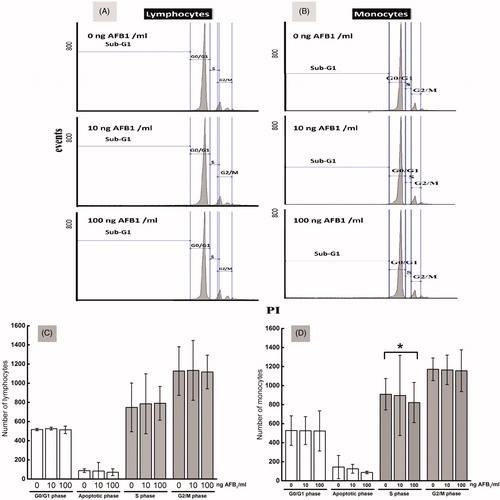
With respect to any potential effects of AFB1 on cell cycle status of the cells, of 10,000 lymphocytes and monocytes analyzed per treatment regimen (respectively, ), only ∼5% were calculated to be in the G0/G1 phase in each group (). Similarly, only a very small percentage of lymphocytes and monocytes (< 1%) were apoptotic in any of the groups, indicating little change in cell viability due to AFB1. In addition, the relative percentages of lymphocytes and monocytes in the G2/M phase were similar across all the treatment groups. However, with respect to the number of cells in the S phase, there was only a decrease seen in the numbers of monocytes that had been exposed to 100 ngAFB1/ml ().
Figure 2. Cell cycle patterns of monocytes and lymphocytes after a 2-h exposure to AFB1. The four representative histograms show the percentages of (A) lymphocytes and (B) monocytes in each cycle phase after exposure to 0, 10, or 100 ng AFB1/ml. All X-axes are in logarithmic scale. Enumeration of the numbers of (C) lymphocytes and (D) monocytes in each cycle phase—G0/G0, sub-G1 (apoptotic cells), G2/M, and S. Open and filled bars are, respectively, geomean events/numbers, and mean events/numbers of leukocytes in 10,000 evaluated cells. Values shown are means (±SEM) of cells from four individuals. **p ≤ 0.05 versus control.
Discussion
AFB1, a known human carcinogen, is metabolically activated via isoforms of cytochrome P450 (CYP) – particularly CYP1A2 and CYP3A4 – in monocytes and lymphocytes (Bahari et al., Citation2014). We have also previously shown that even a very low dose of AFB1 could stimulate some key immunosurveillance molecules, i.e. TLR, in human and bovine mononuclear leukocytes (Bahari et al., Citation2014; Malvandi et al., Citation2013; Mehrzad et al., Citation2013). In the studies here, the response of two key AF-detoxifying genes (i.e. forms of GST and AKR) to AFB1 in human mononuclear leukocytes was analyzed for the first time. The goal of the present studies was to explicitly address a critical point: whether and how GST and AKR might be differently expressed in AFB1-exposed human monocytes and lymphocytes. We wish to note that, in the present studies, the isolated lymphocytes were not separated into different sub-populations for analyses; we hope the findings here will provide a basis for more intense investigations of the effects from the AFB1 upon specific sub-populations of lymphoid lineage, especially T-, B-, and NK cells.
Among four AFB1 detoxifying genes that were the target of these studies, only GST-M1 and AKR-7A2 were detectable in the isolated lymphocytes and monocytes. These outcomes are in line with the reports of Srivastava et al. (Citation2012) that reported the existence of GST-M1 and AKR-7A2 in human immune cells. It was seen here that in both the monocytes and lymphocytes, AFB1 caused a pronounced over-expression of GST-M1, although this effect was diminished with the higher dose (i.e. 100 ng/ml) of AFB1 tested. In addition, expression of GST-M1 was found to be higher than AKR-7A2 in both cell types. Surprisingly, neither dose of AFB1 tested here led to any significant over-expression of AKR-7A2 in lymphocytes (although the 100 ng/ml dose did cause a relatively strong induction in the monocytes). The differences in mRNA outcomes between the GST-M1 and AKR-7A2 might be due to a high reactivity of the GST-M1 promoter to AFB1-GS (Gross-Steinmeyer et al., Citation2009); as such, with ongoing detoxification reactions, there would be more of the conjugate to stimulate GST-M1 expression. In contrast, while the presence of anti-oxidant response elements (ARE) in the AKR-7A2 promoter in combination with any initial increased presence of oxidant AFB1-epoxide could up-regulate AKR-7A2 expression (Praml et al., Citation2008), detoxification of the epoxides in the cells would likely have quickly mitigated any further induction of AKR-7A2 expression.
With respect to effects on cell cycle, 10 ng AFB1/ml had little effect on the various stages in monocytes and lymphocytes. Only 100 ng AFB1/ml resulted in decreased numbers of monocytes in the S phase, the part of the cell cycle in which DNA is replicated. That the impact of the AFB1 on lymphocytes and monocytes differed when 100 ng/ml of AFB1 was used (i.e. monocyte division apparently was arrested at G0/G1 and did not enter S phase) may be useful in explaining why AFB1-exposed monocyte-derived dendritic cells (DC) have inappropriate Ag-presentation, maturation, and T-cell polarization capacities (Mehrzad et al., Citation2014a,Citationb). From a practical prospective, it would be worth examining the immunotoxic effects of AFB1-associated metabolites on cell cycle patterns in primary monocytes/lymphocytes with highly-expressed GST-M1/AKR-7A2. Such an analysis would indicate how differently either GST-M1 and AKR-7A2 could contribute to AFB1 detoxification in primary immune cells under in vitro or in vivo scenarios. The observations here with the monocytes were also in keeping with what is known about cells that, when faced with pro-oxidant levels/low energy status, display arrested DNA replication, protein synthesis, and other cell functions (Shenton et al., Citation2006). Further, the relatively low levels of apoptotic monocytes/lymphocytes among the treated cells here were also consistent with previous findings of AFB1 effects on neutrophils (Mehrzad et al., Citation2011).
Nevertheless, a question that remains to be addressed is ‘what is the utility of doing these types of evaluations if (A) lymphocytes do not proliferate in the absence of antigenic stimulus and (B) circulating monocytes are non-dividing/only differentiate into terminal forms when they reach tissues?’ It is clear the present studies did not evaluate effects of the toxin on cell cycle in the presence of potential antigens/mitogens; however, based on the findings/comments of Chen et al. (Citation2013), since cell cycle events reflecting auto-proliferation occur naturally among the cell types we examined here, the impact of the various treatment regimens could still be successfully assessed and permit us to draw valid conclusions about the effects (or even potential effects) of AFB1 on cell cycle in immune cells.
Apart from the issue of use/non-use of stimuli to treat the isolated cells, we are also cognizant of the fact that only two doses of AFB1 and a single length (i.e. 2 h) of exposure was employed in the present study. With regard to the AFB1 concentrations used, these were selected to encompass environmentally in vivo-relevant exposure levels known to impart immunomodulatory effects in animals/human cells (see Viegas et al. Citation2013). With respect to length of exposure, based upon our earlier findings it was shown that the single 2-h period was long enough to rise to significant changes at the protein and mRNA levels in immune cells exposed to AFB1 (Bahari et al., Citation2014; Malvandi et al., Citation2013; Mehrzad et al., Citation2013, Citation2014a,Citation b). Nevertheless, it would still be worth examining the shorter/longer timepoints to ascertain the temporal patterns of the AFB1 effects on the various endpoints. Such studies are currently underway in our laboratories and the results will be reported in an upcoming manuscript.
In summary, in the current investigation to ascertain whether and how GST-M1 and AKR-7A2 might be differently co-expressed in AFB1-exposed blood mononuclear leukocytes, it was seen that human monocytes were more reactive than lymphocytes to potential AFB1 detoxification, and that GST-M1 seemed to be more affected than AKR-7A2 in the process of AFB1 detoxification.
Declaration of interest
The authors report no conflicts of interest. The authors alone are responsible for the content and writing of the paper.
Acknowledgements
The authors wish to acknowledge the Ferdowsi University of Mashhad bureau (area) for research and technology. We also thank N. Tabasi, N. Ghasemi, and S. Zamani Taghizadeh Rabe for their technical assistance.
References
- Bahari, A., Mehrzad, J., Mahmoudi, M., et al. 2014. Effect of aflatoxin B1 on cytochrome P450 isoforms in human lymphocytes and monocytes. Immuno-pharmacol. Immunotoxicol. 36:1–10
- Chen, C. Y., Chen, Y. K., Wang, J. J., et al. 2013. DC-81-enediyne induces apoptosis of human melanoma A375 cells: Involvement of ROS, p38 MAPK, and AP-1 signaling pathways. Cell Biol. Toxicol. 29:85–99
- Gross-Steinmeyer, K., Stapleton, P. L., Tracy, J. H., et al. 2009. Modulation of aflatoxin B1-mediated genotoxicity in primary cultures of human hepatocytes by diindolylmethane, curcumin, and xanthohumols. Toxicol. Sci. 112:303–310
- Gross-Steinmeyer, K., Stapleton, P. L., Tracy, J. H., et al. 2010. Sulforaphane- and phenethyl isothiocyanate-induced inhibition of aflatoxin B1-mediated genotoxicity in human hepatocytes: Role of GSTM1 genotype and CYP3A4 gene expression. Toxicol. Sci. 116:422–432
- Guengerich, F. P., Arneson, K. O., Williams, K. M., et al. 2002. Reaction of aflatoxin B1 oxidation products with lysine. Chem. Res. Toxicol. 15:780–792
- Long, X. D., Ma, Y., and Deng, Z. L. 2009. GSTM1 and XRCC3 polymorphisms: Effects on levels of aflatoxin B1-DNA adducts. Chinese J. Cancer Res. 21:177–184
- Malvandi, A. M., Mehrzad, J., and Saleh-Moghaddam, M. 2013. Biologically relevant doses of mixed aflatoxins B and G up-regulate MyD88, TLR2, TLR4 and CD14 transcripts in human PBMC. Immunopharmacol. Immunotoxicol. 35:528–532
- McWilliams, J. E., Sanderson, B. J., Harris, E. L., et al. 1995. Glutathione-S-transferase M1 (GSTM1) deficiency and lung cancer risk. Cancer Epidemiol. Biomarkers Prev. 4:589–594
- Mehrzad, J., Klein, G., Kamphues, J., et al. 2011. In vitro effects of very low levels of aflatoxin B1 on free radicals production and bactericidal activity of bovine blood neutrophils. Vet. Immunol. Immunopathol. 141:16–25
- Mehrzad, J., Milani M., and Mahmoudi M. 2013. Naturally occurring level of mixed aflatoxins B and G stimulate toll-like receptor-4 in bovine mononuclear cells. Vet. Quart. 33:186–190
- Mehrzad, J., Devriendt, B., Baert, K., and Cox, E. 2014a. Aflatoxin B1 interferes with the antigen-presenting capacity of porcine dendritic cells. Toxicol. In Vitro 28:531–537
- Mehrzad, J., Devriendt, B., Baert, K., and Cox E. 2014b. Aflatoxins of Type B and G affect porcine dendritic cell maturation in vitro. J. Immunotoxicol. (in press)
- Pfaffl, M. W. 2001. A new mathematical model for relative quantification in real-time RT-PCR. Nucleic Acids Res. 29:e45
- Praml, C., Schulz, W., Claas, A., et al. 2008. Genetic variation of aflatoxin B1 aldehyde reductase genes (AFAR) in human tumor cells. Cancer Lett. 272:160–166
- Rotunno, M., Lam, T. K., Vogt, A., et al. 2012. GSTM1 and GSTT1 copy numbers and mRNA expression in lung cancer. Mol. Carcinog. 51:E142–E150
- Schwab, M., Praml, C., and Amler, L. C. 1996. Genomic instability in 1p and human malignancies. Genes Chromosomes Cancer 16:211–229
- Shenton, D., Smirnova, J. B., Selley, J. N., et al. 2006. Global translational responses to oxidative stress impact upon multiple levels of protein synthesis. J. Biol. Chem. 281:29011–29021
- Srivastava, A., Yadav, S., Sharma, A., et al. 2012. Similarities in diesel exhaust particles induced alterations in expression of cytochrome P450 and glutathione-S-transferases in rat lymphocytes and lungs. Xenobiotica 42:624–632
- Viegas, S., Veiga, L., Figueredo, P., et al. 2013. Occupational exposure to aflatoxin B1 in swine production and possible contamination sources. J. Toxicol. Environ. Health 76:944–951
- Wogan, G. N., Kensler, T. W., and Groopman, J. D. 2012. Present and future directions of translational research on aflatoxin and hepatocellular carcinoma. A review. Food Addit. Contam. Part A. Chem. Anal. Control Expo. Risk Assess. 29:249–257