
Abstract
Agents that destroy tumor cells and simultaneously boost host anti-tumor immunity are of keen interest in cancer therapy. In the present study, the effect of carnosol on anti-tumor immunity in a Balb/c mouse model of fibrosarcoma was evaluated. Carnosol was administered intraperitoneally daily (at 5 or 10 mg/kg/day, for 7 days) to tumor-bearing mice (i.e. 7 days after initial injection of tumor cells). Another group of tumor-bearing mice was treated with 20 mg cyclophosphamide/kg/d (positive control); a final group received vehicle only (vehicle control). After an initial measure on Day 0, tumor size was measured twice during the 7-day treatment period. One day after the final treatment with vehicle/carnosol (i.e. Day 7), the mice had their tumors measured and then were euthanized to permit their spleen and tumor to be harvested for isolation of, respectively, splenocytes and tumor-associated lymphocytes. Using these materials, spontaneous and mitogen-induced release of interleukin (IL)-4, IL-10, and interferon (IFN)-γ, lymphocyte proliferation, and the absolute numbers/relative percentages of splenic and tumor-associated T-regulatory (Treg) and other T-lymphocyte sub-sets were evaluated. The results showed that carnosol at both doses significantly suppressed tumor growth and caused depletion of splenic and tumor-associated Treg cells. It also caused relative (vs control mouse cell values) decreases in splenocyte spontaneous/inducible production of IL-4 and IL-10 and increases in IFNγ and cell proliferation. Carnosol at either dose did not cause changes in the percentages of CD4+ or CD8+ lymphocytes in the spleen or in tumor-associated lymphocyte populations. The observed increases in IFNγ, decreases in IL-10 and IL-4 production, and reductions in splenic/tumor-associated Treg cell levels might be signs reflecting the potential anti-tumor activity of carnosol. Based on the findings here, it is asserted that carnosol is a likely candidate – after more complete toxicologic evaluation – for eventual use as an anti-cancer therapeutic.
Introduction
Rosmarinus officinalis (Lamiaceae; rosemary) is a herb distributed over many parts of the world (de Albuquerque et al., Citation2007). Widely used as a source of anti-oxidants in the food industry (Aruoma et al., Citation1992; Beninca et al., Citation2011; Nissen et al., Citation2000; Sotelo-Felix et al., Citation2002), this anti-oxidant activity is attributed to several polyphenolic constituents including carnosol and carnosic acid (Johnson et al., Citation2010; Sotelo-Felix et al., Citation2002). Carnosol, an o-diphenolic diterpene first isolated from sage (Gajhede et al., Citation1990), is generated by oxidative degradation of carnosic acid (Johnson, Citation2011, Munne-Bosch et al., Citation1999). Several studies have documented the anti-inflammatory properties of carnosol (Celiktas et al., Citation2007; Johnson et al., Citation2010; Lai et al., Citation2009; Lo et al., Citation2002; Takaki et al., Citation2008). In the Johnson et al. (Citation2010) study, the anti-inflammatory effects of carnosol were documented as reductions in the formation of nitric oxide (NO) and pro-inflammatory leukotrienes. In addition to these effects, carnosol has been shown to inhibit 5-lipoxygenase and cyclooxygenase-2 activity, reduce expression of adhesion molecules (ICAM-1), and activate NF-κB during inflammation (Altinier et al., Citation2007; Beninca et al., Citation2011; Lo et al., Citation2002; Poeckel et al., Citation2008; Ya-Mei Yu et al., Citation2009).
There is also evidence of anti-cancer effects from the use of carnosol. Specifically, such effects have been demonstrated against leukemia (Dorrie et al., Citation2001; Zunino & Storms, Citation2008), prostate, breast (Johnson et al., Citation2010), skin (Huang et al., Citation1994, Citation2005), and colon cancer (Moran et al., Citation2005; Sancho et al., Citation2004). These effects have been attributed, in part, to the ability of carnosol to modulate multiple signaling pathways, the cell cycle, and apoptosis-related proteins (Johnson, Citation2011). Carnosol has also been shown to be directly cytotoxic against some cancer cells, including MCF-7 and AU565 cells (Johnson et al., Citation2010).
A novel strategy to use during the overall course of anti-cancer therapy is immunotherapy, i.e. if an anti-cancer therapy benefits from immunostimulatory regimens, overall efficacy will improve. To achieve increases in host immune function beneficial to reducing the presence/viability of cancer cells, stimulation of host cell-mediated immunity against tumors and inhibition of T-regulatory (Treg) cells are required (Farsam et al., Citation2011). Several key cytokines influence these two outcomes: interferon (IFN)-γ produced mainly by T-helper (TH)-1 and cytotoxic T-cells (TCTL) boost cell-mediated anti-tumor immunity, while IL-4 from TH2 cells promotes formation of (Treg) cells and so reduced anti-tumor immunity (Finn, Citation2008). Thus, any immunotherapy aimed at countering immunosuppressive effects from cancer cells needs to be able to shift the TH1/TH2 equilibrium in situ toward TH1 (Finn, Citation2008; Zitvogel et al., Citation2008). In this regard, to better comprehend potential effects of carnosol as an immunomodulant and anti-cancer agent, a Balb/c mouse fibrosarcoma model was employed here to permit analyses of the impact of carnosol.
Materials and methods
Mice
Balb/c mice (male, 5–8-weeks-of-age; 19–21 g) were purchased from the Pasteur Institute (Tehran, Iran). All mice were maintained in a pathogen-free facility under standard conditions (temperature of 20–22 °C, 35% relative humidity, 12-h light:dark cycle) and had ad libitum access to filtered water and autoclaved standard mouse chow. All mice were acclimatized for 1 week prior to use in any experiments. The Animal Research Ethics Committee of Mashhad University of Medical Sciences (Mashhad, Iran) approved all protocols used in these studies.
WEHI-164 cell line culture
WEHI-164 Balb/c mouse fibrosarcoma cells were purchased from the Pasteur Institute for use in generating tumors in the mice. The cells were maintained in RPMI-1640 medium supplemented with 10% fetal bovine serum (FBS), 100 μg streptomycin/ml, and 100 U penicillin/ml (all Gibco, Grand Island, NY) and grown in 37 °C in a humidified 5% CO2 incubator.
Experimental tumor model
To establish the tumor model, WEHI-164 cells in logarithmic growth phase were injected subcutaneously (106 cells/150 μl) into the right flank of each mouse. After 7 days, when the tumors were palpable, the mice were randomly allocated into four groups (n = 6/group). Mice in the carnosol experimental groups were injected intraperitoneally (IP) daily with carnosol solution (98%: Sigma, St. Louis, MO; prepared in 5% dimethyl sulfoxide [DMSO]/phosphate-buffered saline [PBS, pH 7.4] solution) in order to receive 5 or 10 mg carnosol/kg/day. Mice in the positive control group received cyclophosphamide (CYP: Sigma) at 20 mg/kg/day. Mice in the vehicle control group received only DMSO/PBS injections. No injection volume ever exceeded 100 μl. The doses of carnosol used here were based on the study of Beninca et al. (Citation2011) demonstrating the anti-inflammatory effects of carnosol at doses to mice of 2.5–10 mg/kg. Similarly, the dose of CYP was selected based on a study (Farsam et al., Citation2011).
All treatments were applied for seven consecutive days (Day 0 [first carnosol treatment]–Day 6 [final carnosol treatment]). At 24 h after the final treatment (i.e. on Day 7), all mice were first evaluated for tumor size and then immediately euthanized by cervical dislocation so that their respective tumor and spleen could be isolated for use in the various immunologic analyses outlined below. In no instances were there any mice analyzed that had not been injected with tumor cells prior to initiation of the treatments indicated above (i.e. no true carnosol only group evaluated without tumor already present).
Assessment of tumor size
To assess effects on the tumor itself, each mouse had its tumor dimension measured on Days 4 and 7 of the treatment period using a Vernier caliper (Mitutoyo, Kanagawa, Japan). Tumor volume (in terms of mm3) was calculated as length × width2 × (π/6).
Separation of tumor-infiltrating lymphocytes
Tumor samples isolated at necropsy were placed in a petri dish on ice and both normal and necrotic tissues dissected away from the tumor using a scalpel. Thereafter, a Medimachine™ (DAKO, Cytomation; Glostrup, Denmark) was used to disrupt the tumor. The tumor fragments were then placed in 2 ml of RPMI-1640 held in a Medicon microblade-equipped polyethylene chamber (BD Biosciences, San Jose, CA) and dissociated 3–4 times for 30 s each at a constant speed (100 rpm). The resulting cell suspension was washed twice by centrifugation (300 × g, 5 min) using ice-cold PBS (supplemented with 5% FBS) and the final pellet re-suspended in PBS/5% FBS for counting and analyses of viability (via trypan blue exclusion, >90%) of the mixture of tumor cells and macrophages/lymphocytes that had infiltrated the tumor over time.
Preparation of splenic mononuclear cells (MNC)
Under sterile conditions, splenocyte single cell suspensions were prepared from the isolated spleens of all mice using standard disruption/isolation protocols (Riahi et al., Citation2010). The initial suspensions were centrifuged at 1200 rpm (4 °C, 10 min) and then any erythrocytes present removed by incubating the cells at room temperature for 3 min in lysing buffer containing 0.83% (v/v) NH4Cl in 100 mM Tris buffer, (pH 7.4). The MNC were isolated by density centrifugation using Ficol-Hypaque (Baharafshan, Iran). The layer was removed and then washed three times with RPMI 1640 and finally suspended in 1 ml media containing 10% FBS. Viability of cells was then ascertained using trypan blue and the result was >95%.
Lymphocyte (MNC) proliferation
Aliquots (100 μl) of the splenic MNC (at 2 × 10⁶ cells/ml) were placed in wells of a 96-well microtiter plate and then received either phytohemagglutinin-A (PHA; at final concentration of 5 μg/ml/well; Sigma) or medium only. The cultures were then incubated for 72 h at 37 °C (under 5% CO2) and then cell proliferation was assessed using an MTT assay. In brief, 15 μl of a 5-mg/ml solution of 3-(4,5-diamethyl-2-thiazolyl) 2,5-diphenyl-2H-tetrazolium (MTT; Sigma) was added to each well and the plates incubated at 37 °C for 4 h. The blue formazan precipitate that formed within each cell was then dissolved by addition of 100 μl DMSO and the optical density in each well was measured at 570 nm in a Stat-Fax™ Elisa Reader (Stat-Fax, Palm City, FL). Based on absorbance values, a stimulation index (SI) for each sample was calculated:
Splenocyte cytokine production
In a separate set of cultures, aliquots of the isolated splenic MNC (2 × 10⁶ cells/ml, 1 ml) were placed into each well of 24-well plates and thereafter PHA (5 μg/ml; final concentration) was added to stimulation the cells. The cells were then incubated for 72 h at 37 °C before the well supernatants were collected and frozen at −70 °C until analyzed. This single timepoint was selected based on previous studies by Langroudi et al. (Citation2010), Noori et al. (Citation2010), and Farsam et al. (Citation2011). To assess the amounts of interleukin (IL)-4 and -10, as well as of interferon (IFN)-γ present (note: when taken en toto, these levels reflect the status of TH1/TH2 balance among the cells/in hosts), cytokine-specific ELISA kits were purchased (R&D Systems, Minneapolis, MN). All results were based on measures generated using a Stat-Fax™ Elisa reader (450 nm filter). Levels of sensitivity of the IL-4, IL-10, and IFNγ kits were, respectively, 2, 4, and 1 pg/ml. Measures of spontaneous release of the cytokines were also performed in dedicated wells that received only medium in place of PHA.
Flow cytometric analysis of splenic/tumor-infiltrating Treg cells and other T-cell sub-types
Levels (relative percentages) of splenic and tumor-infiltrating Treg cells and other T-cell sub-types were determined using a FACSCalibur™ flow cytometer (BD, San Jose, CA), mouse T-cell sub-set antibody cocktail kit (with isotype control; containing PE-Cy 7-anti-CD3e, PE-anti-CD4, FITC-anti-CD8; all BD Pharmingen, San Diego, CA), and a mouse Treg cell staining kit (with isotype control; FITC-anti-CD4, PE-Cy5-anti-CD25, and PE-Cy5-anti-Foxp3; eBioscience, San Diego) according to manufacturer protocols. All data were analyzed using INSTAT software (GraphPad Inc., San Diego). For each sample, a minimum of 10 000 events was captured.
Statistical analysis
All data were analyzed using a Student’s t-test to determine significant differences among the various groups for a given endpoint. A p value < 0.05 was considered significant. All data are expressed as means ± SE.
Results
Effect of carnosol on tumor volume
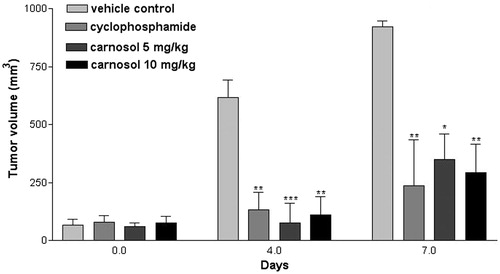
Tumor volumes during the 7-day treatments are shown in . It can be seen that administration of 5 and 10 mg carnosol/kg or 20 mg cyclophosphamide (CYP)/kg resulted in a decrease in the rate of tumor growth. Mean tumor volumes on Day 4 in mice treated with carnosol or CYP were significantly decreased to, respectively, 75.4 [± 86.8], 110.2 [± 80.1], and 133.4 [± 76.1] mm3 (relative to control mouse tumor volumes of > 600 mm3). On Day 7, the mean tumor volumes in the carnosol or CYP-treated hosts were still reduced (compared to those of vehicle control mice, >900 mm3); the values now were 348.5 [± 112.9], 292.6 [± 122.0], and 235.0 [± 199.1] mm3, respectively. Interestingly, these Day 7 values, while larger, were not significantly altered from those on Day 4.
Figure 1. Tumor volumes in treated mice. Values shown are from measures made on Days 0, 4 and 7 of the treatment regimens indicated. Values shown are mean ± SE (n = 6/group). Values significantly different from vehicle control mice at *p < 0.05; **p < 0.01 and ***p < 0.001.
Lymphocyte (MNC) proliferation assay
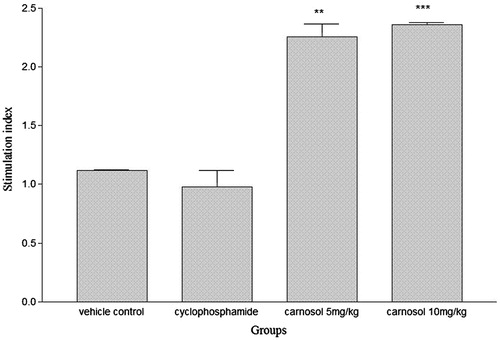
Results of the splenocyte proliferation assays for cells harvested from tumor-bearing mice 24 h after the final treatment are shown in . Carnosol at 5 and 10 mg/kg caused significant increases in splenocyte proliferative responses (SI values) compared to those seen with cells from vehicle tumor-bearing control mice; values for the control, and the 5 and 10 mg/kg carnosol groups were 1.12 [± 0.01], 2.26 [± 0.11], and 2.36 [± 0.02]. In contrast, use of 20 mg CYP/kg/day did not cause significant changes in splenocyte proliferative responses (SI = 0.98 [± 0.14]). For the cultures not treated with PHA, spontaneous proliferation was not significantly different (all had absorbance values within 0.13–0.18) (data not shown).
Figure 2. Splenocyte (MNC) proliferation assays. Values shown are from measures made using splenocytes harvested 24 h after the final treatment (harvested on Day 7) from hosts in the indicated regimens. Values shown are mean ± SE (n = 6/group). Values significantly different from vehicle control at **p < 0.01 and ***p < 0.001.
Splenocyte cytokine production
The effects of the treatment regimens on PHA-stimulated splenocyte IL-4, IL-10, and IFNγ production are presented in . Significant reductions (in comparison with values from cells from vehicle control mice) in IL-4 and IL-10 formation (each p < 0.001) were noted in cultures of splenocytes from mice treated with either dose of carnosol or with CYP. In general, these levels were reduced by 30–51% and 48–54% from control IL-4 and IL-10 levels. There were no apparent dose-related effects attributable to the carnosol treatments; however, the effect of CYP on IL-4 formation was significantly greater than that of either carnosol level. In contrast, the carnosol and CYP regimens each resulted in significant increases in release of IFNγ (all p < 0.001) by the isolated splenocytes. The values were 26.5 [±0.6], 35.7 [± 1.0], and 48.3 [± 0.3] pg/ml, respectively, for the 5 mg carnosol, 10 mg carnosol, and CYP regimens as compared to 17.6 [± 0.2] for the vehicle control cells. In this case, the higher carnosol dose imparted the stronger effect and the effect of CYP was greater than that of either carnosol dose. Measures of spontaneous release of the cytokines () indicated that each of the three treatment regimens significantly reduced formation/release of IL-4 and IL-10, but had no effect on release of IFNγ. There were no significant differences among the carnosol and CYP outcomes for any of the three cytokines measured.
Figure 3. Cytokine formation by isolated splenocytes (MNC). Levels of IFNγ, IL-4, and IL-10 produced after culture of splenocytes harvested 24 h after the final treatment (harvested on Day 7) from hosts in the indicated regimens. Values shown are mean ± SE (n = 6/group). Values significantly different from vehicle control at *p< 0.05 and ***p< 0.001. ###Value significantly different from positive control (p < 0.001).
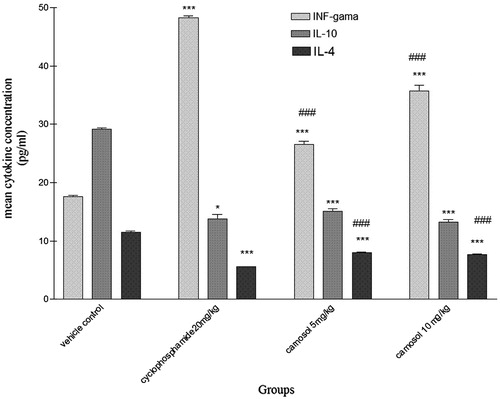
Table 1. Spontaneous cytokine release by splenocytes from mice in treatment groups.
Intra-tumor and splenic CD4+CD25+FoxP3+ Treg cell levels
The absolute (total) number of spleen and of tumor tissue CD4+CD25+FoxP3+ Treg cells associated with either carnosol group was significantly decreased compared to corresponding values in tissues recovered from vehicle control mice ( and ). Using the total numbers of CD4+ cells in each treatment group’s cell population analyzed as a 100% baseline, the relative percentages of intra-tumor and spleen CD4+CD25+FoxP3+ Treg cells in samples from the 10 mg carnosol/kg- and 20 mg CYP/kg-treated tumor-bearing mice were also significantly lower than in tumors from the vehicle control mice (). However, use of 5 mg carnosol/kg did not result in any significant change in these percentages.
Figure 4. Percentage of intra-tumor and splenic CD4+CD25+FoxP3+ T-cells. Levels of indicated cells among splenocytes/tumor tissues harvested 24 h after the final treatment (harvested on Day 7) from hosts in indicated regimens. All values shown are based on CD4+ cell levels in the sample set as a 100% value. Values shown are mean ± SE (n = 6/group). Values significantly different from vehicle control at *p < 0.05 and ***p < 0.001.
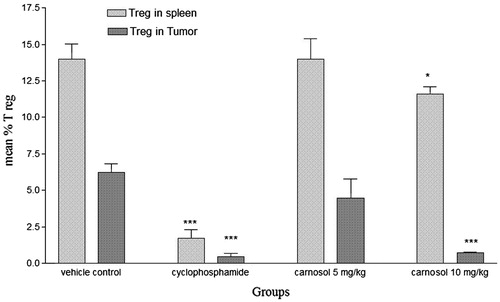
Table 2. Absolute numbers of splenic lymphocyte sub-populations/gram spleen.
Table 3. Absolute numbers of intra-tumor lymphocyte sub-populations/gram tumor tissue.
Other splenic and intra-tumor T-cell sub-types
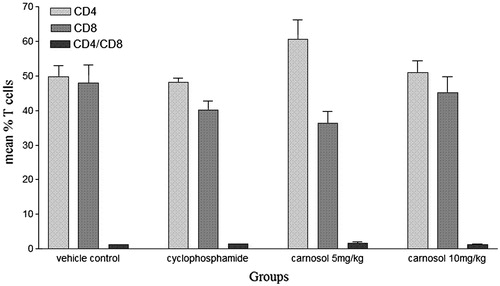
The absolute numbers and percentages of intra-tumor and splenic CD3+ T-cells in either carnosol group was not significantly affected relative to values seen among cells from the vehicle control mice (, and ). There was also no significant difference in total numbers of intra-tumor and splenic CD4+ cells in carnosol groups compared to control. Results for the specific splenic T-cell sub-types indicated that carnosol at 10 mg/kg caused a slight significant increase in the relative percentage of CD4+ cells (using CD3+ cell levels/group as a 100% baseline) and in CD4+/CD8+ ratios compared to corresponding values associated with the control mice (). No significant changes were noted in CD8+ percentages (again based on CD3+ cells as 100% value) or their absolute numbers with this carnosol levels. In the tumors themselves, the relative percentages and absolute numbers of CD4+ and CD8+ cells as well as CD4+/CD8+ ratios were not significantly altered by any treatment regimen ().
Figure 5. Percentage of intra-tumor and splenic CD3+ T-cells. Levels of indicated cells among splenocytes/tumor tissues harvested 24 h after the final treatment (harvested on Day 7) from hosts in the indicated regimens. All values shown are based on CD4+ cell levels in the sample set as a 100% value. Values shown are mean ± SE (n = 6/group). Values significantly different from vehicle control mice at *p < 0.05 and ***p < 0.001.
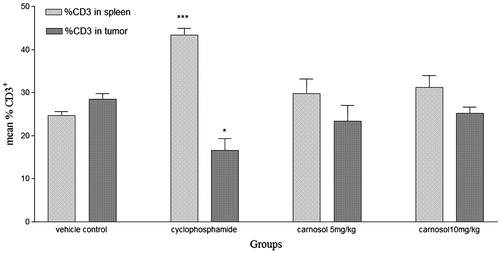
Figure 6. Percentages of CD4+ and CD8+ T-cells and CD4+/CD8+ ratios in spleens. Levels of indicated cells (and calculated ratios) among splenocytes harvested 24 h after the final treatment (harvested on Day 7) from hosts in the treatment regimens indicated. All values shown are based on CD3+ cell levels in the sample set as 100% value. Values shown are mean ± SE (n = 6/group). Values significantly different from vehicle control mice at *p < 0.05.
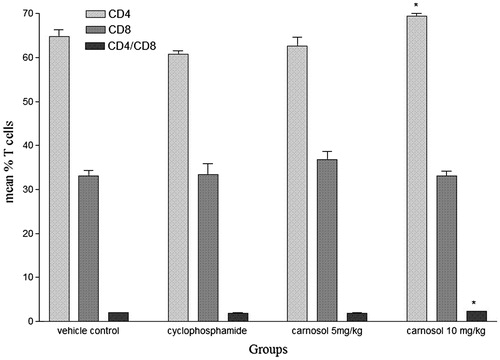
Figure 7. Percentages of CD4+ and CD8+ T-cells and CD4+/CD8+ ratios in tumor samples. Levels of indicated cells (and calculated ratios) among tumor samples harvested 24 h after the final treatment (harvested on Day 7) from hosts in indicated regimens. All values shown are based on CD3+ cell levels in the sample set as 100% value. Values shown are mean ± SE (n = 6/group).
Discussion
Carnosol is a dietary diterpene isolated from rosemary (≈5% of the weight of rosemary leaves are carnosol\carnosic acid (Johnson et al., Citation2010)) that has anti-inflammatory and anti-cancer properties (Lopez-Jimenez et al., Citation2013; Moss et al., Citation2003). In the present study, potential immunomodulatory and anti-tumor effects of carnosol in mice models were explored. Specifically, effects of carnosol on tumor volume, absolute numbers and relative percentages of CD4+, CD8+ and Treg cells in the spleen and in the growing tumor, as well as PHA-stimulated cytokine formation by/proliferation of splenocytes isolated from the treated tumor-bearing mice were evaluated.
The results here confirmed that carnosol administration to tumor-bearing mice could suppress tumor growth. Since one of the most important aspects of host responses to cancer is activation of cell-mediated immunity (CMI) to cause destruction of the cancer cells, the significant decrease in tumor volume among the carnosol-treated mice could have been due to either direct activation of the CMI or due to a shift in the host to a more TH1 cell-based response. In general, TH1 cells can initiate processes leading to activation of many cells, including CD8+ and phagocytes. The TH1 cells can also secrete cytokines like IFNγ and tumor necrosis factor (TNF)-α to both activate tumor-killing cells and to sensitize tumor cells to subsequently be lysed by Natural Killer (NK) and CD8+ cells (due to increased expression of co-stimulatory factors) (Bhardwaj, Citation2007; Gerloni & Zanetti, Citation2005). As the data here showed that carnosol treatment of the tumor-bearing mice slowed tumor growth, reduced Treg cell levels, increased production of IFNγ, and decreased formation of IL-4 and IL-10, it would appear that some of the anti-cancer effect from carnosol was likely due to a shift in the hosts toward TH1-based responses.
The effect of carnosol on Treg cell levels in the mice was an interesting observation. Many investigators have concluded that use of any safe means to deplete Treg cells could improve the outcome of any cancer therapy (Beyer & Schultze, Citation2006; Steer et al., Citation2010). This is so because, normally, Treg cells suppress the functions of tumor-specific CD8+ and effector CD4+ T-cells through cell–cell contact/production of IL-10 or transforming growth factor (TGF)-β (Curiel, Citation2007; Facciabene et al., Citation2012; Loser et al., Citation2007; Schmidt et al., Citation2013; Vignali et al., Citation2008). Similarly, Treg cells inhibit the anti-tumor functions of NK and TCTL cells in granzyme-B- and perforin-dependent manners (Cao et al., Citation2007). In the present study, it seems that carnosol may have improved host CMI indirectly by causing decreases in the numbers (or even potentially function; this remains unknown to date) of Treg cells commonly found in/around a tumor site (Witz & Levy-Nissenbaum, Citation2006).
Nevertheless, it is not totally clear as yet how the carnosol (or even the CYP) led to the decreases in splenic/tumor-associated Treg cell levels. It is plausible that the effects were indirect. How this is so is based on a combination of findings by other investigators. Specifically, Lo et al. (Citation2002) reported that treatment of RAW 264.7 cells (mouse macrophages) with carnosol caused reduced lipopolysaccharide-stimulated NO production (suppression of NO production and iNOS gene expression was due, in part, to inhibition of NF-κB activation). Niedbala et al. (Citation2007) reported that NO helped to induce the expansion of Treg cell populations in situ. Thus, based on both of those sets of findings, it is plausible to believe that the observed reductions in Treg cell levels in the carnosol-treated tumor-bearing mice here might be associated with an inhibition of NO production – possibly as a result of the anti-oxidant effects of carnosol. Further studies are needed to investigate this hypothesis.
Conclusions
Carnosol appears to act as a possible immunomodulant that could effectively improve the anti-tumor TH1-based responses in situ. Clearly, use of the compound in the tumor-bearing mouse model here resulted in slowed growth of the cancer, decreases in the relative levels of immunosuppressive (and thus cancer-benefiting) Treg cell levels, and shifts toward increases in formation of IFNγ and in CD4+ cell levels in these hosts. Nevertheless, while these were apparently the first studies to report the in situ effects of carnosol on Treg cells, further studies are clearly needed to better clarify other likely immunomodulatory properties of this compound. Such studies should include measures of ex vivo CTL cytotoxicity and NK killing activities. Only after these are defined could there be any potential for the use of carnosol as an adjunct during anti-cancer therapy regimens.
Declaration of interest
The authors report no conflicts of interest. The authors alone are responsible for the content and writing of this paper.
Acknowledgements
The authors are thankful to the Vice Chancellor of Research at Mashhad University of Medical Sciences and the Iran National Science Foundation for their financial support.
References
- Altinier, G., Sosa, S., Aquino, R. P., et al. 2007. Characterization of topical anti-inflammatory compounds in Rosmarinus officinalis L. J. Agric. Food Chem. 55:1718–1723
- Aruoma, O., Hlliwell, B., Aeschbach, R., and Loligers, J. 1992. Anti-oxidant and pro-oxidant properties of active rosemary constituents: Carnosol and carnosic acid. Xenobiotica 22:257–268
- Beninca, J. P., Dalmarco, J. B., Pizzolatti, M. G., and Frode, T. S. 2011. Analysis of the anti-inflammatory properties of Rosmarinus officinalis L. in mice. Food Chem. 124:468–475
- Beyer, M., and Schultze, J. L. 2006. Regulatory T-cells in cancer. Blood 108:804–811
- Bhardwaj, N. 2007. Harnessing the immune system to treat cancer. J. Clin. Invest. 117:1130–1136
- Cao, X., Cai, S. F., Fehniger, T. A., et al. 2007. Granzyme B and perforin are important for regulatory T-cell-mediated suppression of tumor clearance. Immunity 27:635–646
- Celiktas, O. Y., Kocabas, E., Bedir, E., et al. 2007. Anti-microbial activities of methanol extracts and essential oils of Rosmarinus officinalis, depending on location and seasonal variations. Food Chem. 100:553–559
- Curiel, T. 2007. Treg cells and rethinking cancer immunotherapy. Clin. Invest. 117:1167–1174
- de Albuquerque, U. P., Demedeiros, P. M., de Almeida, A. L., et al. 2007. Medicinal plants of the caatinga (semi-arid) vegetation of NE Brazil: A quantitative approach. J. Ethnopharmacol. 114:325–354
- Dorrie, J., Sapala, K., and Zunino, S. J. 2001. Carnosol-induced apoptosis and down-regulation of Bcl-2 in B-lineage leukemia cells. Cancer Lett. 170:33–39
- Facciabene, A., Motz, G. T., and Coukos, G. 2012. T-Regulatory cells: Key players in tumor immune escape and angiogenesis. Cancer Res. 72:2162–2171
- Farsam, V., Hassan, Z. M., Zavaran-Hosseini, A., et al. 2011. Anti-tumor and immunomodulatory properties of artemether and its ability to reduce CD4+CD25+ FoxP3+ Treg cells in vivo. Int. Immunopharmacol. 11:1802–1808
- Finn, O. J. 2008. Molecular origins of cancer: Cancer immunology. Medicine 358:2704–2715
- Gajhede, M., Anthoni, U., Nielsen, H. P., et al. 1990. Carnosol. Crystal structure, absolute configuration, and spectroscopic properties of a diterpene. J. Crystallogr. Spectr. Res. 20:165–171
- Gerloni, M., and Zanetti, M. 2005. CD4 T-cells in tumor immunity. Springer Sem. Immunopathol. 2005:37–48
- Huang, M. T., Ho, C. T., Wang, Z. Y., et al. 1994. Inhibition of skin tumorigenesis by rosemary and its constituents carnosol and ursolic acid. Cancer Res. 54:701–708
- Huang, S. C., Ho, C. T., Lin-Shiau, S. Y., and Lin, J. K. 2005. Carnosol inhibits the invasion of B16/F10 mouse melanoma cells by suppressing metalloproteinase-9 through down-regulating NF-κB and c-Jun. Biochem. Pharmacol. 69:221–232
- Johnson, J. J. 2011. Carnosol: A promising anti-cancer and anti-inflammatory agent. Cancer Lett. 305:1–7
- Johnson, J. J., Syed, D. N., Suh, Y., et al. 2010. Disruption of androgen and estrogen receptor activity in prostate cancer by a novel die-tary diterpene carnosol: Implications for chemoprevention. Cancer Prev. Res. 3:1112–1123
- Lai, C. S., Lee, J. H., Ho, C. T., et al. 2009. Rosmanol potently inhibits LPS-induced iNOS and COX-2 expression through down-regulating MAPK, NF-κB, STAT3, and C/EBP signaling pathways. J. Agric. Food Chem. 57:10990–10998
- Langroudi, L., Hassan, Z. M., Ebtekar, M., et al. 2010. A comparison of low-dose cyclophosphamide treatment with artemisinin treatment in reducing the number of regulatory T-cells in a murine breast cancer model. Int. Immunopharmacol. 10:1055–1061
- Lo, A. H., Liang, Y. C., Lin-Shiau, S. Y., et al. 2002. Carnosol, an anti-oxidant in rosemary, suppresses inducible nitric oxide synthase through down-regulating NF-κB in mouse macrophages. Carcinogenesis 23:983–991
- Lopez-Jimenez, A., Garcia-Caballero, M., Medina, M. A., and Quesada, A. R. 2013. Anti-angiogenic properties of carnosol and carnosic acid, two major dietary compounds from rosemary. Eur. J. Nutr. 52:85–95
- Loser, K., Apelt, J., Voskort, M., et al. 2007. IL-10 controls UV-induced carcinogenesis in mice. J. Immunol. 179:365–371
- Moran, A. E., Carothers, A. M., Weyant, M. J., et al. 2005. Carnosol inhibits β-catenin tyrosine phosphorylation and prevents adenoma formation in the C57BL/6J/Min/+(Min/+) mouse. Cancer Res. 65:1097–1104
- Moss, M., Cook, J., Wesnes, K., and Ducket, P. 2003. Aromas of rosemary and lavender essential oils differentially affect cognition and mood in healthy adults. Int. J. Neurosci. 113:15–38
- Munne-Bosch, S., Schwarz, K., and Alegre, L. 1999. Response of abietane diterpenes to stress in Rosmarinus officinalis L.: New insights into the function of diterpenes in plants. Free Radical Res. 31:S107–S112
- Niedbala, W., Cai, B., Liu, H., et al. 2007. Nitric oxide induces CD4+CD25+Foxp3– regulatory T-cells from CD4+CD25– T-cells via p53, IL-2, and OX40. Proc. Natl. Acad. Sci. USA 104:15478–15483
- Nissen, L. R., Mansson, L., Bertelsen, G., et al. 2000. Protection of dehydrated chicken meat by natural anti-oxidants as evaluated by electron spin resonance spectrometry. J. Agric. Food Chem. 48:5548–5556
- Noori, S., Taghikhani, M., Hassan, Z. M., et al. 2010. Tehranolide molecule modulates the immune response, reduce regulatory T-cells, and inhibits tumor growth in vivo. Mol. Immunol. 47:1579–1584
- Poeckel, D., Greiner, C., Verhoff, M., et al. 2008. Carnosic acid and carnosol potently inhibit human 5-lipoxygenase and suppress pro-inflammatory responses of stimulated human polymorphonuclear leukocytes. Biochem. Pharmacol. 76:91–97
- Riahi, B., Rafatpanah, H., Mahmoudi, M., et al. 2010. Immunotoxicity of paraquat after subacute exposure to mice. Food Chem. Toxicol. 48:1627–1631
- Sancho, E., Batlle, E., and Clevers, H. 2004. Signaling pathways in intestinal development and cancer. Ann. Rev. Cell Dev. Biol. 20:695–723
- Schmidt, H. H., Ge, Y., Hartmann, F., et al. 2013. HLA Class II tetramers reveal tissue-specific regulatory T cells that suppress T-cell responses in breast carcinoma patients. OncoImmunogy 2:e24962
- Sotelo-Felix, J., Martinez-Fong, D., Muriel, P., et al. 2002. Evaluation of the effectiveness of Rosmarinus officinalis (Lamiaceae) in the alleviation of carbon tetrachloride-induced acute hepatotoxicity in the rat. J. Ethnopharmacol. 81:145–154
- Steer, H., Lake, R., Nowak, A., and Robinson, B. 2010. Harnessing the immune response to treat cancer. Oncogene 29:6301–6313
- Takaki, I., Bersani-Amado, L., Vendruscolo, A., et al. 2008. Anti-inflammatory and anti-nociceptive effects of Rosmarinus officinalis L. essential oil in experimental animal models. J. Med. Food 11:741–746
- Vignali, D., Collison, L., and Workman, C. 2008. How regulatory T-cells work. Nat. Rev. Immunol. 8:523–532
- Witz, I., and Levy-Nissenbaum, O. 2006. The tumor microenvironment in the post-PAGET era. Cancer Lett. 242:1–10
- Ya-Mei Yu, M., Lin, C. H., and Hong-Der Tsai, M. 2009. Carnosic acid reduces cytokine-induced adhesion molecules expression and monocyte adhesion to endothelial cells. Eur. J. Nutr. 48:101–106
- Zitvogel, L., Apetoh, L., Ghiringhelli, F., et al. 2008. The anti-cancer immune response: Indispensable for therapeutic success? Clin. Invest. 118:1991–2001
- Zunino, S. J., and Storms, D. H. 2008. Carnosol delays chemotherapy-induced DNA fragmentation and morphological changes associated with apoptosis in leukemic cells. Nutr. Cancer 61:94–102