
Abstract
Vanadium is a major air pollutant with toxic and carcinogenic effects; it also exercises immunosuppressive effects on the adaptive immune response. Its effect on the innate immune response is poorly explored. The aim of this study was to identify if vanadium pentoxide (V2O5) impairs the function of immunoregulatory NK cells and to determine possible mechanisms associated with this effect. Interleukin-2-independent NK-92MI cells were exposed to different V2O5 concentrations for 6, 12, or 24 h periods. Cell proliferation was then evaluated using CFSE staining, apoptosis by Annexin V binding, and necrosis by 7-AAD staining. The release of IL-2, -4, -6, -10, -17A, IFNγ, and TNFα by the cells were assessed using a human CBA kit. Expression of CD45, SOCS1, JAK3, pJAK3, STAT5, pSTAT5, IL-2R, IL-15R, Fas, and FasL in/on the cells was determined by flow cytometry; JAK3 and pJAK3 expression were also evaluated via confocal microscopy. The results indicated that V2O5 could inhibit NK-92MI cell proliferation and induce cell apoptosis in a dose- and time-related manner. V2O5 also inhibited IL-2, IL-10, and IFNγ secretion but mostly only after 24 h of exposure and with primarily the higher doses tested. V2O5 had no effect on expression of JAK3 and STAT5, but did cause an increase in pJAK3 and appeared to lead (trend) to reductions in levels of phosphorylated STAT5. V2O5 increased the expression of IL-2R, IL-15R, Fas, and FasL at concentrations above the 50–100 µM range. V2O5 had no effect on expression of the CD45 membrane phosphatase, but it did cause an increase in the expression of SOCS1. These results indicate that a key toxic effect of V2O5 on NK cells is a dysregulation of signaling pathways mediated by IL-2. These effects could help to explain the previously-reported deleterious effects on innate immune responses of hosts exposed to inhaled V2O5.
Introduction
Vanadium (V) is recognized as an important air pollutant in the atmosphere of major cities (Fortoul et al., Citation2002). A predominant source of this element in the atmosphere is the increased combustion of fuel products such as those derived from Venezuelan or Mexican oil, which have high V content (Ivancsits et al., Citation2002; Shafer et al., Citation2012). Inhaled V can enter the systemic circulation of an organism, subsequently exerting toxicities in other organs and tissues (Fortoul et al., Citation2002; Nemmar et al., Citation2004). The toxic effects of V are not only obviously related to dose, but to the chemical nature of the V agent itself (i.e. oxidation state, free, or complexed forms, etc.) (Korbecki et al., Citation2012).
Inhalation of vanadium pentoxide (V2O5) has been shown to decrease the phagocytic index and inducible production of interleukin (IL)-6 (Fortoul et al., Citation2002) and interferon (IFN)-γ by rat pulmonary macrophages (Cohen et al., Citation1997). Exposure of peripheral blood mononuclear cells to other V compounds reduces the release of IFNγ by, and the proliferation of, mitogen-stimulated cells, although IL-5 release was affected in a concentration-dependent bi-modal manner (Di Gioacchino et al., Citation2002). Mice chronically exposed to airborne V2O5 display histologic and functional damage to their spleen (Pinon-Zarate et al., Citation2008). Overall, the general outcome from exposure to V agents is a suppression of the host immune response.
The induced immune response is a result of interactions of various components of the adaptive and innate immune system; the main cell type in the latter is the natural killer cell (Dimitriadis et al., Citation2010) involved in host immunity against viruses and other intracellular microbes (Bonavida, Citation2014). Mice and humans exposed to pollutants derived from burning coal or cigarette smoke show a diminished NK cell activity (Dutta et al., Citation2012; Jones, Citation2008; Wortham et al., Citation2012). Diesel exhaust particles also modify NK cell function (Hurd & Whalen, Citation2011; Muller et al., Citation2013). Normally, a balance between signals that are generated from activating receptors and inhibitory receptors regulates NK cell activation (Bi et al., Citation2014; Leon et al., Citation2014; Vivier et al., Citation2008). IL-2 is an essential cytokine required for the proliferation and activation of NK cells (Suzuki et al., Citation1983); its effect is mediated through the IL-2 receptor via the JAK/STAT signaling pathway (Lu et al., Citation1998). Impairment of the IL-2/IL-2 receptor-signaling pathway suppresses immune cell proliferation and other functions (Wu et al., Citation2009).
Because V (often as inorganic oxides) is abundantly present in fumes from burning coal/oil, as well as in smaller amounts in cigarette smoke and exhaust particles, the aim of the work presented here was to determine if V2O5 (as a model inorganic V oxide) could impair NK cell function. Using an IL-2-independent human NK-92MI cell line that is phenotypically considered an NKbright cell line, the studies showed that V2O5 inhibited the secretion of select pro-inflammatory cytokines and cell proliferation, induced apoptosis, modified the IL-2 receptor-signaling pathway, and enhanced the expression of SOCS1 in this cell type.
Materials and methods
Cell line and culture
The IL-2-independent human NK cell line NK-92MI was obtained from American Type Culture Collection (#CLR-2408, ATCC, Manassas, VA). This stable line, transfected with human IL-2 cDNA, was cultured in α-minimum essential medium without ribonucleosides and deoxyribonucleosides, but supplemented with 12.5% heat-inactivated fetal bovine serum (FBS), 12.5% horse serum, 100 IU penicillin/ml and 100 IU streptomycin/ml, 2 mM L-glutamine, 0.2 mM inositol, 20 mM folic acid, and 100 µM 2-mercaptoethanol. Culture media and all reagents were from Gibco (Life Technologies, Grand Island, NY) and Sigma-Aldrich (St. Louis, MO). The cells were grown until confluence in 25 cm2 polystyrene tissue culture flasks (Corning Costar, Cambridge, MA) at 37 °C in a humidified atmosphere containing 5% CO2. Cell aliquots were frozen in 10% dimethyl sulfoxide and kept in liquid nitrogen until use. Freshly thawed cells were used for all the experiments.
A 10 mM stock solution of vanadium pentoxide (Sigma; 99.99%) in phosphate-buffered saline (PBS, pH 7.4) was prepared. This stock solution was then used to generate all final concentrations (μM) of the metal agent used in the experiments.
Cell proliferation assay
Proliferation analyses were conducted using carboxyfluorescein diacetate succinimidyl ester (CFSE) staining. The cells were suspended in PBS + 5% FBS and labeled for 10 min at 4 °C using 5 μM CFSE (Sigma 21888). Staining was quenched by addition of 4 vol ice-cold PBS/5% FBS solution for 1 min before washing the cells twice with PBS/5% FBS at 4 °C. The tagged cells were then plated in 6-well tissue culture plates (5 × 10⁵ cells/ml; Corning Costar) and exposed to different concentrations of V2O5 (25, 50, 100, 200, or 400 µM). After 48 h, the cells were harvested and intensity of CFSE staining quantified by flow cytometry using a 4-color FACS Calibur instruments (BD Biosciences, Franklin Lakes, NJ).
Quantification of apoptosis
Apoptosis was measured by flow cytometry, using an allophycocyanin (APC) conjugate of Annexin V and 7-Amino-Actinomycin (7-AAD) (BD Pharmingen, San Jose, CA). Annexin V binds to early apoptotic as well as late apoptotic/necrotic cells while 7-AAD binds to late apoptotic/necrotic cells. Briefly, NK-92MI cells (5 × 10⁵ cells/well) were exposed to different levels of V2O5 (25, 50, 100, 200, or 400 µM) for 6, 12, and 24 h. Treated cells were then washed twice with cold PBS and re-suspended at 106 cells/ml in 1X Binding Buffer [0.1 M HEPES (pH 7.4), 1.4 M NaCl, 25 mM CaCl2 (BD Pharmingen)]. Aliquots (100 µl) of the suspension (105 cells) were then placed into 5-ml culture tubes to which 5 µl APC Annexin V and 5 µl 7-AAD were then added. After vortexing, the cells were incubated 15 min at room temperature in the dark. Thereafter, 400 µl 1X Binding Buffer was added to each tube and the cells then underwent flow cytometric analysis within 1 h using an Attune™ Acoustic Focusing Cytometer-Blue/Red (Life Technologies).
Cytokine determination
NK-92MI cells were seeded in 6-well culture plates at 5 × 10⁵ cells/well. After exposure to different concentrations of V2O5 for varying lengths of time, supernatants were collected and frozen at −20 °C until analyzed. Concentrations of tumor necrosis factor (TNF)-α, IFNγ, and of IL-2, -4, -6, and -17A were measured using a cytometric bead array human TH1/TH2/TH17 CBA kit (BD Biosciences), according to manufacturer protocols. All samples were then analyzed using the 4-color FACS Calibur system. Data analyses were performed using FCAP Array 3.0.1 software (Soft Flow, St. Louis Park, MN). The limits of detection for the array were: IL-2, 2.6 pg/ml; IL-4, 4.9 pg/ml; IL-6, 2.4 pg/ml; IL-10, 4.5 pg/ml; TNFα, 3.8 pg/ml; IFNγ, 3.7 pg/ml; and IL-17A, 18.9 pg/ml.
Flow cytometry
At the end of the V2O5 treatment, the cells were washed (5 min, 250 × g) twice in FACS buffer (PBS containing 0.09% [w/v] sodium azide, supplemented with 1% FBS), fixed and then permeabilized with, respectively, Fix Buffer I and Perm Buffer III (BD Phosflow), according to manufacturer instructions. The cells were suspended in FACS buffer and incubated at 4 °C overnight with primary antibodies at dilutions previously determined optimal by titration. Cells were then washed twice and incubated with secondary fluorochrome-conjugated antibodies (diluted 1:500) for 1 h. Flow cytometry analysis was then performed using the Attune™ Acoustic Focusing Cytometer-Blue/Red.
For CD25, CD95, CD95L, and IL-15Ra determination, cells were first combined with the manufacturer recommended dose of specific primary antibody (FITC-conjugated mouse anti-human CD25; Biolegend Inc., San Diego, CA) and APC-conjugated mouse anti-human CD95 (BD Pharmingen™, San Jose, CA), incubated for 30 min at 4 °C in the dark, washed twice in FACS buffer, and then analyzed. CD95L and IL-15Ra determination was performed using a non-conjugated mouse anti-human CD95L (Chemikon Biotek, Millipore Corp., Billerica, MA) and non-conjugated goat anti-human IL-15Ra (R&D Systems, Minneapolis, MN); secondary antibodies used for the final detection were, respectively, APC-conjugated rat anti-mouse IgG1 (Biolegend) and Alexa 488-labeled donkey anti-goat IgG H&L (Abcam, Cambridge, MA).
For CD45 and SOCS1 determination, cells were first labeled with the anti-human CD45 (at dilutions previously determined by titration), then fixed and permeabilized using Cyto-fix/Cytoperm, and finally stained with the appropriate antibodies. Rabbit-anti-human JAK3, monoclonal anti-Phospho-Jak3 (Tyr980/981) (D44E3), rabbit monoclonal anti-Stat5 (3H7), anti-Phospho-Stat5 (Tyr694) (C11C5) and anti-human SOCS1 were purchased from Cell Signaling Technology (Beverly, MA). Cy5-conjugated goat anti-rabbit IgG (H + L) was obtained from Life Technologies. After staining, gating of the cells was performed on the basis of forward and side scatter properties followed by gating on FSC-A × FSC-H (single cell). All flow analyses included runs with the proper antibody isotype control. Stained cells were collected on the FACSCalibur instrument using the CellQuest Pro Version 6.0 software (BD Biosciences). For each sample, a minimum of 20,000 cells was acquired. Data was analyzed in terms of mean fluorescence intensity (MFI) values or in terms of percentage of positive cells.
Confocal microscopy
Sorted cells in 100 μl PBS were stained with 100 nM SYTOX® green dye (Life Technologies) by co-incubation for 15 min at room temperature. Thereafter, the cells were centrifuged (5 min, 700 rpm) onto a microscope slide using a Hettich-Cyto-System (Andreas Hettich GmbH & Co., Tuttlingen, Germany). The cells were then immunostained as previously described and analyzed under a 100 × Plan Apochromatic oil-immersion objective (N.A. 1.4) in a Zeiss LSM 5 Pascal confocal system (Zeiss, Oberkochen, Germany) using excitation wavelength of 488 and 633 nm and pinhole apertures < 1 Airy unit.
Statistical analysis
Values are expressed as mean ± SE. Statistical analyses were performed using a one-way analysis of variance (Roberts et al., Citation2004) and a Tukey test for multiple comparisons. GraphPad Prism for Windows v 6.1 (La Jolla, CA) was used for all statistical procedures. All data obtained by flow cytometry were analyzed using FlowJo (v X.0.7, Tree Star, Inc. Ashland, OR). A p value < 0.05 was considered significant.
Results
Vanadium pentoxide (V2O5) influence on NK-92MI cell proliferation
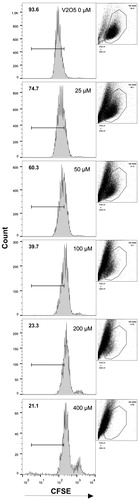
Increasing concentrations of V2O5 inhibited NK-92MI cell proliferation in a dose-related manner. Compared to control (non-V2O5-treated) cells, the rate of proliferation of NK-92MI cells decreased as the level of V2O5 increased. The inhibitory effect of V2O5 reached 78% at the 400 µM level (). This inhibition was accompanied by a decrease in size and increase in granularity of the cells, changes characteristic of apoptotic processes.
Figure 1. Effect of V2O5 on NK-92MI cell proliferation. Cells were treated with increasing concentrations (25–400 μM) of V2O5 for 48 h. Cells were then stained with CFSE and proliferation of cells determined by flow cytometry. Data are expressed in percentages and each V2O5 concentration is represented with a cytofluorometer histogram (along with respective cell size and granularity dot-plot). Results shown are representative of three different experiments performed with each V2O5 concentration.
V2O5 influence on annexin and 7-ADD expression
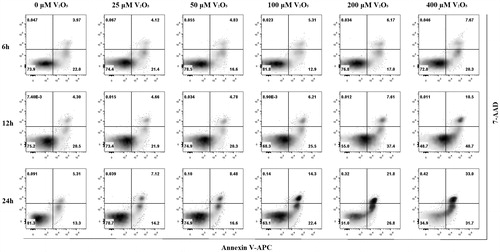
A presence of V2O5 triggered apoptosis in the NK-92MI cells in a dose- and time-related manner (). The percentage of cells undergoing apoptosis increased dramatically after 12 h of exposure (51.2 and 64.7% at 12 and 24 h, respectively). Apoptotic cells were clearly distinguishable from control cells due to the reduced cell size (low FSC) and enhanced density (high SSC). Interestingly, the baseline percentage of 7-AAD+ cells was negligible and remained so after the cells were exposed to V2O5 for 6, 12, or 24 h. The left lower quadrant of all the density plots shown in clearly demonstrates that cell viability decreased as the level of V2O5 increased.
Figure 2. V2O5-induced phosphatidylserine externalization on NK-92MI cells. Cells treated with different V2O5 concentrations for 6, 12, and 24 h and progressive phosphatidylserine externalization examined. Lower right quadrant (Annexin V+7-AAD−) represents early apoptotic cells; upper right quadrant (Annexin V+7-AAD+) represents late apoptotic cells. Lower left quadrant (Annexin V−7-AAD−) represents living cells; upper left quadrant (Annexin V−7-AAD+) represents necrotic cells. Results shown are representative of three different experiments done with each V2O5 concentration.
V2O5 effects on cytokine production
As NK-92MI cells secrete high concentrations of IL-2 (Tam et al., Citation1999), basal levels of IL-2 in cultures of non-treated cells ultimately reached 2800 pg/ml after 24 h (). Cultures treated with increasing concentrations (25–400 μM) of V2O5 for 24 h showed a continuous significant (p < 0.01) decrease in IL-2 production, down to nearly 500 pg/ml at the highest dose tested. The same decrease was observed after 12 h, even though basal IL-2 levels were also lower than at 24 h; interestingly, production again neared 500 pg/ml at the highest dose tested. No V-related effects were noted after just 6 h of incubation.
Figure 3. Cytokine production by V2O5-treated NK-92MI cells. IL-2, IL-10, and IFNγ were measured in supernatants of V2O5-treated cells at 6, 12, and 24 h using a cytometric bead array. Results for IL-4, IL-6, IL-17A, and TNFα not shown as levels were below detection by the kit. The results shown are one representative experiment (of three different experiments) performed with each V2O5 concentration. *p < 0.05, **p < 0.01, ***p < 0.001 vs the same V2O5 dose at the different exposure times.
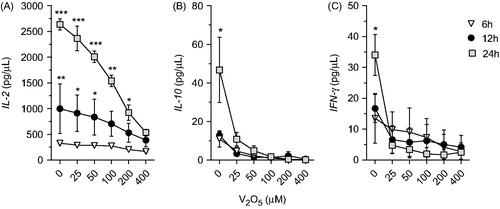
With regard to IL-10, although the basal concentrations were not as high as those for IL-2, the effects of V2O5 were immediately apparent even at the lowest dose (i.e. 25 µM) tested for 24 h. Production was moreover nearly totally abrogated at V2O5 concentrations >50 µM. Effects at the shorter (i.e. 6 and 12 h) incubation periods were not evident as basal production was already quite low. The effects on IFNγ release were similar to those for the IL-10. Basal IL-4, IL-6, IL-17A and TNFα levels were below ELISA kit detection limits in all samples.
V2O5 effect on cell surface molecule expression
Expression of CD25 (IL-2Rα subunit) began to significantly increase above background starting at 50 µM V2O5 and reached a maximal MIF value at the highest V2O5 concentration tested (i.e. 400 µM) (). A similar pattern for induced changes in IL-15Rα expression/MIF values was observed (). Fas and FasL expression behaved somewhat similarly, but the concentration of V2O5 where an increased expression was clearly observed was 100 µM for the CD95 (Fas), but just 50 µM for CD95L (FasL) (). Interestingly, the effect on FasL expression appeared to peak at 100 µM V2O5, while that of CD95 tended to keep increasing as the dose of V2O5 doubled. Furthermore, the expression patterns observed for Fas and FasL at 400 µM V2O5 showed an unexpected high expression peak in terms of size and granularity.
Figure 4. Modifications of cell surface membrane ligands expression in V2O5-treated NK-92MI cells. Expression levels of (a) CD25; (b) IL-15Rα chain; (c) Fas; and (dD) FasL. Results shown are percentage positive cells in relation to expression levels on cells that received respective isotype control. (e) Analysis strategy of cytometry data; image represents data obtained when CD25 expression was evaluated in non-V2O5-treated NK-92MI cells. All data was analyzed using this dot plot strategy.

V2O5 effect on JAK3/STAT5 pathway
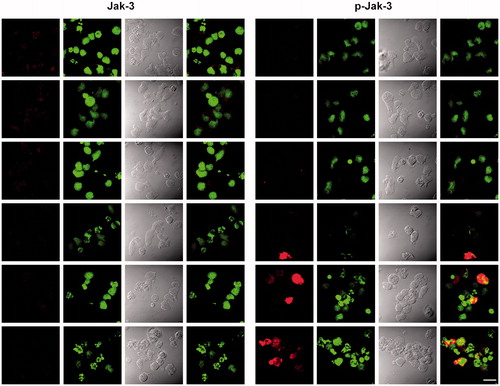
NK-92MI cells treated with increasing concentrations (25–400 μM) V2O5 for different periods of time showed a significant time-related increase in JAK3 phosphorylation with the 200 and 400 μM doses (p < 0.001 and p < 0.01 vs non-treated control value, respectively) (). Phosphorylation of JAK3 in the 6-h cultures was nominal. Incubation of the cells with V2O5 resulted in a downward trend in STAT5 phosphorylation, but the effects were not significant. The status of both STAT5 and JAK3 were unaffected by any of the V treatments. As seen in (representative image of NK-92MI cells’ intracellular staining for JAK3 and pJAK3), it is worth noticing a strong presence of pJAK3 in the internal portion of the cell membranes of cells treated with increasing amounts of V2O5.
Figure 5. V2O5 effect on JAK3/STAT-5 activation. NK-92MI cells were treated with medium alone or 25, 50, 100, 200, and 400 μM of V2O5 at 37 °C and then intracellular staining for flow cytometry was performed. Protein levels of JAK3, pJAK3, STAT5, and pSTAT5 were determined after 6, 12, and 24 h of exposure. MFI = mean fluorescence intensity. Results shown are average of three different experiments performed with each V2O5 concentration. *p < 0.01, **p < 0.001 vs the same V2O5 dose at the different exposure times.
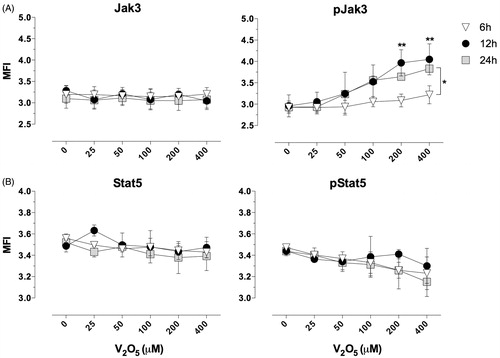
Figure 6. Images of phosphorylation of JAK3 in cells treated with V2O5 for 24 h. The figure shows confocal microscopy images of cells sorted from cytometer. Images on the left of the figure show JAK3, while images on the right show pJAK3. JAK3 and pJAK3 are shown in red; nucleic acid staining marked with SYTOX® green. The first and fifth column show JAK3 and pJAK3, respectively. The second and sixth column show counterstained cell nuclei. The third and seventh column show light microscopy images. The fourth and eighth columns show merged red and green channels. The white bar in the lower right hand section of image represents 20-μm distances.
V2O5 effect on SOCS1 and CD45 expression
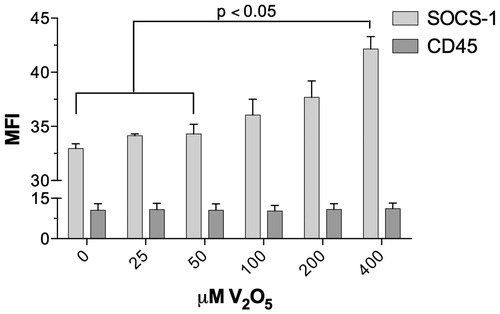
CD45 expression of on NK-92MI cells exposed to different doses of V2O5 for 24 h remained unaltered (). In contrast, expression of SOCS-1 showed a gradual increase dependent on the dose of V2O5; the increase with 200 and 400 µM V2O5 was significant relative to expression in the controls or with the lower doses of V2O5 tested.
Figure 7. Expression of CD45 and SOCS1 on 92MI NK-cells exposed to V2O5. The graph depicts mean fluorescence intensity (MFI) of CD45 and SOCS1 obtained from FSC-SSC parameters corresponding to the NK-92 MI cell populations.
Discussion
The results of the current study showed that vanadium pentoxide (V2O5) inhibits the proliferation of NK-92MI cells by inducing apoptosis. The use of this specific cell line was determined by the fact that it is a human cell line that preserved its CD56bright phenotype after the IL-2 cDNA transfection process, rendering it as a valid prototypical example of an activated natural killer cell (Maki et al., Citation2001; Sharma & Das, Citation2014). NK cells are considered a major innate immune response effector and play a major role in the resolving of V2O5-induced lung inflammation (Turpin et al., Citation2010).
The V2O5 concentrations used in these experiments were within the range reported by the World Health Organization (WHO) in workplace air (0.01–60 mg/m3) and in soils near petro-chemical plants in México (Hernandez & Rodriguez, Citation2012; WHO, Citation2000). Unlike inhaled water-soluble V compounds that enter the lung cells using transport systems utilized by other anions (like phosphate or sulfate ions), insoluble particles like V2O5 are ingested by resident [alveolar] macrophages. Once in the macrophage phagosomes, the V2O5 particles undergo slow dissolution to free ions that can potentially exit the cells, and then enter/cross through epithelial cells or enter into erythrocytes when they are in the alveoli, and so become a part of the generic circulation (Cohen et al., Citation2010). It is the latter now-solubilized forms of V that NK cells in the body are, thus, most-likely exposed (Roberts et al., Citation2004).
Other V compounds are known to induce apoptosis and have been evaluated for cancer therapy (Leon et al., Citation2014). The fact 7-ADD cell uptake was not modified by V2O5 exposure implied, there was a negligible occurrence of necrosis as this compound only stained compromised membranes (Darzynkiewicz et al., Citation1992; Schmid et al., Citation1992). Therefore, the results in the present study with 7-ADD uptake confirm that NK cells were not damaged but that, instead, the NK cells were induced to enter into apoptotic processes. The high affinity of annexin V for phosphatidylserine renders it a sensitive probe for apoptotic cell analysis; however, sole use of annexin V cannot distinguish between early, late apoptotic, and necrotic cells. Therefore, the results here suggest to us that a main toxic effect from V2O5 exposure on NK cells is induction of apoptosis. This would corroborate previous observations of apoptotic effects of V2O5 on endothelial cells (Montiel-Davalos et al., 2012).
Production of IL-2 results in activation of a number of genes, including those associated with cell proliferation. Recently, the range of recognized actions of IL-2 has expanded, with roles being defined in promotion of the differentiation of T-helper (TH)-1 and TH2 cells (Dilworth-Anderson & Cohen, Citation2010); IL-2 also causes inhibition of TH17 and T-follicular helper (Tfh) cell development, but promotion of TH17 cell expansion once the cells develop (Liao et al., Citation2013). With this as a basis, the present study evaluated TH1, TH2, and TH17 cytokine profiles of NK-92MI cells and how their release was affected by exposure to V2O5.
Several major cytokines regulate NK cells development, survival, and function, including IL-2, -4, -7, -10, -12, -15, -18, and -21, transforming growth factor (TGF)-β, and both Type I interferons (Marcais et al., Citation2013; Nandagopal et al., Citation2014). While NK cells secrete the above-mentioned cytokines, they also produce IFNγ. The current study showed that V2O5 cause reduced secretion of IL-2, IL-10, and IFNγ by the treated cells due to the decrease in cell viability subordinate to the apoptotic process that was induced by the V2O5. Nevertheless, the decreased levels of IL-2 were still high enough to secure compensatory cell proliferation.
Compensatory mechanisms have been reported in immune systems (Di Caro et al., Citation2011). The possibility of such a mechanism is highly possible here, since our results showed that, as cell viability was decreasing, expression of IL-2R and IL-15R [probably of intermediate affinity (Pillet et al., Citation2009)] was increasing-possibly as part of some mechanism to support uptake of IL-2 in order to maintain cell viability/activation. Nevertheless, it was clear that the cells here were undergoing some extreme risk to survival, as expression patterns observed for Fas and FasL at the highest V2O5 concentration tested led to an unexpected high expression peak in terms of size and granularity. Such a pattern may reflect activation of extracellular apoptosis pathways by V2O5.
The β subunit in the IL-2 receptor itself has a long intra-cytoplasmic tail that dimerizes with the common cytokine receptor γ chain and activates the JAK/STAT pathway. In contrast, in NK cells the IL-15Rα chain on the surface of dendritic cells present IL-15 in trans to NK cells that express the IL-2/IL-15R β and γ chain, allowing signaling through these complexes (Liao et al., Citation2013; Waldmann, Citation2006). JAK1, JAK3, and STAT5 are signal transduction elements linked to the IL-2R and its JAK-STAT pathway (Frank et al., Citation1995; Johnston et al., Citation1994; Ross et al., Citation2010), but the NK-92MI cell line is known to severely under-express CD25 in comparison to the parental NK-92 cell line (Maki et al., 2001; Tam et al., Citation1999). Thus, a most likely explanation for the results here was that V2O5 altered the signaling pathway mediated by the β subunit of the IL-2/IL-15 receptor that responds to IL-2 (Long et al., Citation2013).
The IL-2/IL-15 mediated signaling pathway requires auto-phosphorylation and activation of Janus kinases (especially JAK1 and JAK3), is essential for IFNγ production, and induces three parallel signaling cascades (e.g. Ras-Raf-MEK, PI3-AKT-mTOR, and STAT5) (Kovanen & Leonard, Citation2004; Ma et al., Citation2006). Vanadate interferes with the PI3K/Akt/mTOR signaling cascade (Goncalves et al., Citation2011) and some preliminary results (data not shown) from our own laboratories suggest that V2O5 also interferes with Akt and pAkt expression. Because inhibition of the PI3-AKT-mTOR pathway severely reduces IFNγ production (Nandagopal et al., Citation2014), the observed decreased production of IFNγ that was detected in the present study could be secondary to an inhibitory effect of V2O5 on the IL-2/IL-15 mediated signaling pathway.
The suppressor of cytokine signaling (SOCS) can also down-regulate JAK/STAT pathways, but by different mechanisms (Haque & Sharma, Citation2006). Normally, SOCS binds phospho-tyrosine residues on the receptors and blocks STATs from binding to receptors; it also binds directly to specific JAKs, thereby inhibiting corresponding JAK kinase activity (Furqan et al., Citation2013). The present results indicated that V2O5 induced increases in JAK3 phosphorylation and non-significant decreases in STAT5 phosphorylation in tandem with increases in SOCS expression. This suggested to us that V2O5, in a manner similar to vanadate (Rehder, Citation2013), inhibited protein tyrosine phosphatases, thereby preventing de-phosphorylation of JAK and, thus, maintaining JAK3 phosphorylation status. The observed increase in SOCS would be one attempt by the cells to turn-off the JAK/STAT pathway; a consequence of this would be inhibition of STAT phosphorylation and suppression of cytokine signaling. It is also well known that over-activity of receptor tyrosine kinases (RTK) under certain conditions can lead to induction of apoptosis (Kazi et al., Citation2014). The increased expression of IL-2R/IL-15R and Fas/FasL seen in the cells treated here could be interpreted as an attempt by the cells to override/compensate for the negative feedback signaling from the increases in SOCS and the decrease in IL-2 production. Sustained kinase phosphorylation has been observed with other types of V agents, including vanadates (Huyer et al., Citation1997) and oxovanadium (Vardatsikos et al., Citation2009).
Conclusions
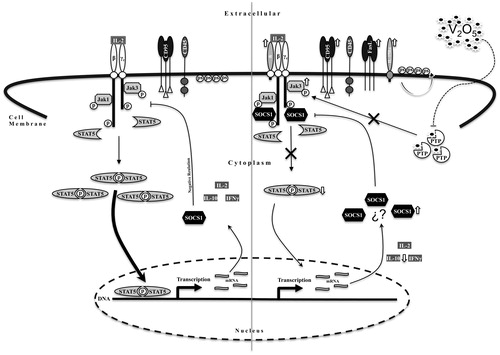
The results of these studies showed that V2O5 could inhibit, via increases in SOCS, the proliferation of NK-92MI cells as well as their secretion of anti-inflammatory IL-10 cytokine and pro-inflammatory IFNγ. It is possible that exposure of human NK cells to V2O5 could result in inhibited secretion of these and other key immunoregulatory cytokines through a similar mechanism (). Such effects could help to explain the effects of V2O5 on innate immune system cells and increased incidence of infections, allergies, and other malignancies in workers exposed to V2O5/V agents and residents living in highly polluted areas known to have high levels of V in the air and/or water.
Figure 8. Schematic representation of V2O5 -induced toxicity mechanism. The left-hand side of the figure shows normal signaling pathways activated by IL-2 in NK-92MI cells (in relation to parameters evaluated here). On the right-hand side, graphic representation of effects of V2O5 on the IL-2-induced signaling pathways. Results demonstrated that V2O5 increased JAK3 phosphorylation via possible inhibition of protein tyrosine phosphatase (PTP), that resulted in a decrease in STAT5 phosphorylation. This decrease was also secondary to an increase in SOCS1 synthesis (mechanism of latter remains to be determined). The decrease in STAT5 phosphorylation results in a decrease in inflammatory cytokines synthesis. The increase in cell membrane receptors such as CD95, FasL and both α subunits of IL-2R and IL-15R could be a compensatory mechanism secondary to diminished proliferation signaling activity. Negative regulation of JAK3 phosphorylation mediated by CD45 remained unaltered. Phosphatidylserine translocation to the outside of the membrane was evident.
Declaration of interest
The authors report no conflicts of interest. The authors alone are responsible for the content and writing of the paper.
Acknowledgments
Jose Francisco Gallardo Vera performed this study in partial fulfillment of requirements for the PhD degree in Biomedical Sciences of the Biological Sciences Postgraduate Course, Universidad Nacional Autónoma de México and a recipient of CONACyT scholarship 232341. The authors express their gratitude to Biol. Patricia Espinosa Cueto for technical assistance. This work was supported by grants IN-211113 and IN-210813 from DGAPA, UNAM, and CONACyT-177678, México.
References
- Bi, J., Zhang, Q., Liang, D., et al. 2014. T-Cell Ig and ITIM domain regulates natural killer cell activation in murine acute viral hepatitis. Hepatology 59:1715–1725
- Bonavida, B. 2014. NK cell phenotypic and functional heterogeneities and molecular mechanisms of cytotoxicity. Crit. Rev. Oncol. 19:21–45
- Cohen, M. D., Becker, S., Devlin, R., et al. 1997. Effects of vanadium upon polyl:C-induced responses in rat lung and alveolar macrophages. J. Toxicol. Environ. Health. 51:591–608
- Cohen, M. D., Sisco, M., Prophete, C., et al. 2010. Effects of metal compounds with distinct physicochemical properties on iron homeostasis and antibacterial activity in the lungs: Chromium and vanadium. Inhal. Toxicol. 22:169–178
- Darzynkiewicz, Z., Bruno, S., del Biono, G., et al. 1992. Features of apoptotic cells measured by flow cytometry. Cytometry 13:795–808
- Di Caro, V., D'Anneo, A., Phillips, B., et al. 2011. Interleukin-7 matures suppressive CD127+ forkhead box P3 (FoxP3)+ T-cells into CD127−CD25highFoxP3+ regulatory T-cells. Clin. Exp. Immunol. 165:60–76
- Di Gioacchino, M., Sabbioni, E., Di Giampaolo, L., et al. 2002. In vitro effects of vanadate on human immune functions. Ann. Clin. Lab. Sci. 32:148–154
- Dilworth-Anderson, P., and Cohen, M. D. 2010. Beyond diversity to inclusion: Recruitment and retention of diverse groups in Alzheimer research. Alzheimer Dis. Assoc. Disord. 24:S14–18
- Dimitriadis, E., Menkhorst, E., Salamonsen, L. A., and Paiva, P. 2010. Review: LIF and IL-11 in trophoblast-endometrial interactions during establishment of pregnancy. Placenta Suppl:S99–104
- Dutta, A., Bhattacharya, P., Lahiri, T., and Ray, M. R. 2012. Immune cells and cardiovascular health in pre-menopausal women of rural India chronically exposed to biomass smoke during daily household cooking. Sci. Total Environ. 438:293–298
- Fortoul, T. I., Quan-Torres, A., Sanchez, I., et al. 2002. Vanadium in ambient air: Concentrations in lung tissue from autopsies of Mexico City residents in the 1960s and 1990s. Arch. Environ. Health. 57:446–449
- Frank, D. A., Robertson, M. J., Bonni, A., et al. 1995. Interleukin 2 signaling involves the phosphorylation of Stat proteins. Proc. Natl. Acad. Sci. USA 92:7779–7783
- Furqan, M., Mukhi, N., Lee, B., and Liu, D. 2013. Dysregulation of JAK-STAT pathway in hematological malignancies and JAK inhibitors for clinical application. Biomarker Res. 1:5
- Goncalves, A. P., Videira, A., Soares, P., and Maximo, V. 2011. Orthovanadate-induced cell death in RET/PTC1-harboring cancer cells involves the activation of caspases and altered signaling through PI3K/Akt/mTOR. Life Sci. 89:371–377
- Haque, S. J., and Sharma, P. 2006. Interleukins and STAT signaling. Vitam. Horm. 74:165–206
- Hernandez, H., and Rodriguez, R. 2012. Geochemical evidence for the origin of vanadium in an urban environment. Environ. Monit. Assess. 184:5327–5342
- Hurd, T., and Whalen, M. M. 2011. Tetrabromobisphenol A decreases cell-surface proteins involved in human natural killer (NK) cell-dependent target cell lysis. J. Immunotoxicol. 8:219–227
- Huyer, G., Liu, S., Kelly, J., et al. 1997. Mechanism of inhibition of protein-tyrosine phosphatases by vanadate and pervanadate. J. Biol. Chem. 272:843–851
- Ivancsits, S., Pilger, A., Diem, E., et al. 2002. Vanadate induces DNA strand breaks in cultured human fibroblasts at doses relevant to occupational exposure. Mutat. Res. 519:25–35
- Johnston, J. A., Kawamura, M., Kirken, R. A., et al. 1994. Phosphorylation and activation of the JAK3 Janus kinase in response to IL-2. Nature 370:151–153
- Jones, M. 2008. Understanding the molecular mechanisms of allergy. Meth. Mol. Med. 138:1–15
- Kazi, J. U., Kabir, N. N., Flores-Morales, A., and Ronnstrand, L. 2014. SOCS proteins in regulation of receptor tyrosine kinase signaling. Cell Mol. Life Sci. 71:3297–3310
- Korbecki, J., Baranowska-Bosiacka, I., Gutowska, I., and Chlubek, D. 2012. Biochemical and medical importance of vanadium compounds. Acta Biochim. Pol. 59:195–200
- Kovanen, P. E., and Leonard, W. J. 2004. Cytokines and immunodeficiency diseases: Critical roles of the gamma(c)-dependent cytokines IL-2, -4, -7, -9, -15, and -21, and their signaling pathways. Immunol. Rev. 202:67–83
- Leon, I. E., Butenko, N., Di Virgilio, A. L., et al. 2014. Vanadium and cancer treatment: Anti-tumoral mechanisms of three oxido-vanadium(IV) complexes on a human osteosarcoma cell line. J. Inorg. Biochem. 134:106–117
- Liao, W., Lin, J. X., and Leonard, W. J. 2013. IL-2 at the crossroads of effector responses, tolerance, and immunotherapy. Immunity 38:13–25
- Long, E. O., Kim, H. S., Liu, D., et al. 2013. Controlling natural killer cell responses: Integration of signals for activation and inhibition. Annu. Rev. Immunol. 31:227–258
- Lu, L., Zhu, J., Zheng, Z., et al. 1998. JAK-STAT pathway is involved in the induction of TNFβ gene during stimulation by IL-2. Eur. J. Immunol. 28:805–810
- Ma, A., Koka, R., and Burkett, P. 2006. Diverse functions of IL-2, IL-15, and IL-7 in lymphoid homeostasis. Annu. Rev. Immunol. 24:657–679
- Maki, G., Klingemann, H. G., Martinson, J. A., and Tam, Y. K. 2001. Factors regulating the cytotoxic activity of the human natural killer cell line, NK-92. J. Hematother. Stem Cell Res. 10:369–383
- Marcais, A., Viel, S., Grau, M., et al. 2013. Regulation of mouse NK cell development and function by cytokines. Front. Immunol. 4:450
- Montiel-Davalos, A., Gonzalez-Villava, A., Rodriguez-Lara, V., et al. 2012. Vanadium pentoxide induces activation and death of endothelial cells. J. Appl. Toxicol. 32:26–33
- Muller, L., Chehrazi, C. V., Henderson, M. W., et al. 2013. Diesel exhaust particles modify natural killer cell function and cytokine release. Particle Fibre Toxicol. 10:16
- Nandagopal, N., Ali, A. K., Komal, A. K., and Lee, S. H. 2014. The critical role of IL-15-PI3K-mTOR pathway in natural killer cell effector functions. Front. Immunol. 5:187
- Nemmar, A., Hoylaerts, M. F., Hoet, P. H., and Nemery, B. 2004. Possible mechanisms of the cardiovascular effects of inhaled particles: Systemic translocation and prothrombotic effects. Toxicol. Lett. 149:243–253
- Pillet, A. H., Bugault, F., Theze, J., et al. 2009. A programmed switch from IL-15- to IL-2-dependent activation in human NK cells. J. Immunol. 182:6267–6277
- Pinon-Zarate, G., Rodriguez-Lara, V., Rojas-Lemus, M., et al. 2008. Vanadium pentoxide inhalation provokes germinal center hyperplasia and suppressed humoral immune responses. J. Immunotoxicol. 5:115–122
- Rehder, D. 2013. The future of/for vanadium. Dalton Trans. 42:11749–11761
- Roberts, J. R., Taylor, M. D., Castranova, V., et al. 2004. Soluble metals associated with residual oil fly ash increase morbidity and lung injury after bacterial infection in rats. J. Toxicol. Environ. Health. 67:251–263
- Ross, J. A., Cheng, H., Nagy, Z. S., et al. 2010. Protein phosphatase 2A regulates IL-2 receptor complex formation and JAK3/STAT5 activation. J. Biol. Chem. 285:3582–3591
- Schmid, I., Krall, W. J., Uittenbogaart, C. H., et al. 1992. Dead cell discrimination with 7-amino-actinomycin D in combination with dual color immunofluorescence in single laser flow cytometry. Cytometry. 13:204–208
- Shafer, M. M., Toner, B. M., Overdier, J. T., et al. 2012. Chemical speciation of vanadium in particulate matter emitted from diesel vehicles and urban atmospheric aerosols. Environ. Sci. Technol. 46:189–195
- Sharma, R., and Das, A. 2014. Organ-specific phenotypic and functional features of NK cells in humans. Immunol. Res. 58:125–131
- Suzuki, R., Handa, K., Itoh, K., and Kumagai, K. 1983. Natural killer (NK) cells as a responder to interleukin (IL)-2. I. Proliferative response and establishment of cloned cells. J. Immunol. 130:981–987
- Tam, Y. K., Maki, G., Miyagawa, B., et al. 1999. Characterization of genetically altered, IL 2-independent natural killer cell lines suitable for adoptive cellular immunotherapy. Human. Gene. Ther. 10:1359–1373
- Turpin, E. A., Antao-Menezes, A., Cesta, M. F., et al. 2010. Respiratory syncytial virus infection reduces lung inflammation and fibrosis in mice exposed to vanadium pentoxide. Respir. Res. 11:20
- Vardatsikos, G., Mehdi, M. Z., and Srivastava, A. K. 2009. Bis(maltolato)-oxovanadium (IV)-induced phosphorylation of PKB, GSK-3 and FOXO1 contributes to its glucoregulatory responses. Int. J. Mol. Med. 24:303–309
- Vivier, E., Tomasello, E., Baratin, M., et al. 2008. Functions of natural killer cells. Nat. Immunol. 9:503–510
- Waldmann, T. A. 2006. The biology of IL-2 and IL-15: Implications for cancer therapy and vaccine design. Nat. Rev. Immunol. 6:595–601
- WHO (World Health Organization). 2000. Vanadium [Chapter 6.12]. In: Air Quality Guidelines - 2nd Edition. Copenhagen: WHO Regional Office for Europe
- Wortham, B. W., Eppert, B. L., Motz, G. T., et al. 2012. NKG2D mediates NK cell hyper-responsiveness and influenza-induced pathologies in a mouse model of chronic obstructive pulmonary disease. J. Immunol. 188:4468–4475
- Wu, D., Guo, Z., Ren, Z., et al. 2009. Green tea EGCG suppresses T-cell proliferation through impairment of IL-2/IL-2 receptor signaling. Free Radic. Biol. Med. 47:636–643