
Abstract
Nanoparticles (NP) are significant to multiple industrial processes, consumer products and medical applications today. The health effects of many different types of NP, however, are largely unknown. The purpose of this study was to test the effects of 50-nm gold NP coated with poly-N-vinylpyrrolidone (PVP) on mouse macrophage and spleen cells with and without lipopolysaccharide (LPS), testing the hypothesis that the NP would modulate immune responses without being overtly toxic. Gold NP had no effect on macrophage viability and, in the absence of LPS, they had no effect on tumor necrosis factor (TNF)-α production as measured by ELISA. The presence of LPS significantly increased the release of TNFα from the macrophages above no-treatment controls, but increasing gold NP concentration led to decreasing release of TNFα. The reactive oxygen species (ROS) produced by exposed macrophages were also reduced compared to untreated controls, both with and without LPS, suggesting some kind of oxygen radical scavenging. In splenocyte cultures, gold NP had no effect alone, but significantly reduced the release of interleukin (IL)-17 and TNFα triggered by LPS. These results suggest that the gold NP used here are not cytotoxic to immune cells at these concentrations, but may affect cellular responses to infection or inflammation by altering the balance of cytokines.
Introduction
A nanoparticle (NP) is defined as a particle that has at least one dimension that is between 1–100 nm, which is ∼1/50,000th the width of a strand of human hair (Dwivedi & Paul, Citation2013). Nanoparticles can have unusual and useful properties because of their small volume-to-surface area ratio and their surface structure, which affects the surface reactivity, solubility, shape and aggregation. Because the small size has implications for reactivity, their creation must include controlling the materials’ purity and composition. This technology is the driving force behind the creation of nanomaterials for many emerging nanotechnology industries today. The applications of nanotechnology are far-reaching, with exposures occurring through industrial, commercial and even medical applications (Eissa et al., Citation2014; Hussain et al., Citation2013). It has been predicted that the economic impact of nanotechnology will soon surpass the effect of the industrial revolution of the early 20th Century (Nel et al., Citation2006).
While many studies focus purely on the cytotoxicity of NP, which would lead to health effects simply due to tissue damage, some short- and long-term effects can be induced through modulation of the immune response. Altering immune responses can lead to allergies, inflammation and even cancer, making this a critical area of research. For this study, a type of NP was selected that was readily available commercially and has a wide variety of potential applications. Gold has been used historically in the treatment of painful inflammatory conditions such as rheumatoid arthritis, but its effects at nanoscale levels have not been thoroughly investigated. Gold nanoparticles (AuNP) have been used in cell imaging, targeted drug delivery, cancer diagnostics and treatments. However, the effects of AuNP on the immune system have not been systematically studied.
This study tested the hypothesis that 50-nm AuNP would cause oxidative stress in macrophages through the phagocytic process and lead to inflammatory activation of macrophages leading to altered cytokine production by splenocytes in culture. Interestingly, while the AuNP had little effect alone, they reduced ROS, inflammatory cytokines and a T-helper TH17 response triggered by lipopolysaccharide (LPS).
Materials and methods
AuNP were purchased from Nanocomposix Inc. (NC, San Diego, CA) and were 50-nm in diameter and coated with poly-N-vinylpyrrolidone (PVP) to increase their stability (Liu et al., Citation2013b) and minimize Ostwald ripening (Voorhees, Citation1984). To verify the overall quality and specifications of the AuNP, visual identification, UV-Vis, Dynamic Light Scattering (DLS) and TEM were performed. Because the focus of the study was immunologic, two forms of the 50-nm AuNP from NC were selected (http://nanocomposix.com/collections/gold); the BioPure line of products is reported to be monodisperse, unagglomerated, endotoxin free and purified to remove residual reactants, while the Econix AuNP are monodisperse and unagglomerated, but not guaranteed to be free of endotoxin or residual reactants.
AuNP quality verification
Verification using visual inspection
The AuNP had a specific reddish or pink color (depending on concentration in the pure water solution provided by NC) that was due to the plasmon resonance effect (Ghosh & Pal, Citation2007). Any changes in color would indicate a change in the AuNP material properties, such as degradation of the PVP coating, large-scale agglomeration, Ostwald ripening or instability. The reddish color was observed as the particles first arrived and the color of both the AuNP suspensions remained consistent throughout the time the experiments were performed.
Verification using UV-visible (UV-Vis) spectroscopy
UV-Vis spectroscopy was effective in confirming the stability of NP (Haiss et al., Citation2007). The analyses were done both by NC and confirmed at Idaho State University (ISU). The BioPure AuNP experienced maximum absorbance at 532 nm at NC and 534 nm at ISU (absorption spectra shown in Supplemental Figure S1A). The Econix AuNP experienced a maximum absorbance at 529 nm at NC and 526 nm at ISU (Supplemental Figure S1B).
It was also necessary to perform UV-Vis spectroscopy after experiments were completed to verify AuNP stability throughout the course of the experiments. The BioPure AuNP experienced maximum absorbance at 532 nm at ISU and Econix AuNP at 530 nm (Supplemental Figure S2). The equipment used to perform the UV-Vis spectroscopy at NC was the Agilent 8453 UV-Visible Spectrometer (Agilent Technologies, Santa Clara, CA), while that used at ISU was a Perkin Elmer Precisely Lambda 35 UV-Visible Spectrometer (Perkin Elmer, Waltham, MA). Use of two different spectrometers may explain the slight variation between measurements, although both were within expected tolerances.
Verification using dynamic light scattering (DLS)
DLS measures the hydrodynamic diameter and indirectly the Zeta potential of the AuNP. Measuring the hydrodynamic diameter is an effective way to measure agglomeration (Jans et al., Citation2009) and the Zeta potential is proportional to the amount of average charge held by the AuNP. ISU did not have access to a DLS instrument, so initial measures were provided by NC using a Malvern Zetasizer Nano ZS (Malvern Instruments, Westborough, MA). After the experiments were completed, samples were taken to NC for another DLS measurement and verified the lack of agglomeration of the AuNP provided. The initial and final measurements of the hydrodynamic diameter for the BioPure AuNP were 72.5 and 77.3-nm, respectively. The initial and final measures of hydrodynamic diameter for the Econix AuNP were, respectively, 82.1 and 80.4 nm. The initial and final Zeta potential for the BioPure NP was −25.7 and −25.7 mV, respectively. The initial and final Zeta potential for the Econix NP was −25.7 and −32.8 mV, respectively.
Verification using a transmission electron microscope (TEM)
Transmission Electron Microscopy (TEM) was used to verify the shapes and the AuNP size distributions at NC, using a Jem-1010 transmission electron microscope (Jeol USA Inc., Peabody, MA) at 100 KeV and NP standard procedures. The analyses confirmed that no agglomeration was occurring in the AuNP provided by NC and that Ostwald ripening had no detectable effect on the AuNP. Before the experiments were done, TEM images were taken of the BioPure AuNP at NC; after experiments were complete, a portion of the unused BioPure and Econix AuNP solutions were sent to NC for re-analysis. After the experiments, TEM images were taken again to verify that the AuNP samples that were used in the experiments did not undergo agglomeration at any point during the experiments. The TEM data produced images and size distributions before and after experiments (Supplemental Figure S3); scaling is seen in the lower right of each picture.
Nanoparticle suspensions
In all experiments using AuNP, it was important to maintain mono-dispersion since surface properties and surface area are critical factors in particle interactions with cells. The materials from NC indicated that putting the water suspension of AuNP directly into the media, at an isotonic concentration of salts (≈300 mOsm), could cause agglomeration. To avoid AuNP agglomeration in all experiments, the suspensions were gradually “salted” by adding 50 µl media to the concentrated water suspensions every 10 min until a total of 200 µl media was added to 200 µl of Econix or BioPure AuNP, depending on the need of each experiment.
The presence of endotoxin in the suspensions was evaluated using the Lonza Pyrogene Endotoxin Detection Kit (Lonza, Walkersville, MD) following manufacturer protocols carefully, including calibration of the kit standard against our own LPS preparation for use in the cultures (see below; Cells and Cell Culture). This assay had a minimum detection limit of 0.01 EU/ml. All of the raw suspensions as well as cell cultures at all treatment concentrations were tested against the kit-provided endotoxin standard. None contained any detectable endotoxin, except those to which we added LPS (data not shown).
Cells and cell culture used for macrophages
RAW 264.7 macrophages were obtained from American Type Culture Collection (ATCC, Rockville, MD) and maintained at 37 °C in RPMI media (CellGro Mediatech, Manassas, VA). The complete media contained L-glutamine, 100 U penicillin or streptomycin/ml and 5% fetal calf serum (FBS, Atlanta Biologicals, Flowery Branch, GA) in a NapCo Series 8000 water-jacketed humidified 5% CO2 incubator maintained at 37 °C (Thermo Scientific, Waltham, MA).
Viability and particle uptake
The macrophages were gently scraped from T75 culture flasks, mixed evenly and counted using a Z2 series Coulter Counter (Beckman-Coulter, Brea, CA). One million cells were added to each well of a 24-well plate in 1 ml complete media. BioPure AuNP suspensions were added to the 1 ml cell cultures to give final concentrations of 0, 5, 25 and 50 µg AuNP/ml. These concentrations were based on previous in vitro studies (Du et al., Citation2012; Hashimoto et al., Citation2014) and two in vivo studies (Chen et al., Citation2013; Geiser et al., Citation2013), and it was ensured that these experiments were preformed well below overtly toxic dosages, so that immune effects could be measured in the absence of cell death. There were four replicate wells for each concentration in one half of the plate; the other half of the plate contained identical cultures with the addition of 1 µg LPS/mL (Salmonella minnesota; Sigma, St. Louis, MO) in all wells to determine the effect of the AuNP on LPS-stimulated macrophages. (Note: for Escherichia coli LPS, as 1 EU is given as 100 pg/ml, this would make this particular LPS treatment ≈10,000 EU/ml. However, due to variability in molecular weights of different LPS molecules, this is only an approximation.)
After 24 h incubation at 37 °C, the cells were imaged using a DFC 295 DMIL camera attached to a Leica binocular inverted microscope (Leica Microsystems, Buffalo, IL) using Differential Interference Contrast. Thereafter, 800 µl media was removed from each well and saved at −20 °C for cytokine analysis. Phosphate-buffered saline (PBS, pH 7.4; 500 µl) was then added to each well to give a total volume of 700 µl/well. The cells were then scraped from each well and placed into flow cytometry tubes on ice.
Flow cytometry for analysis of side scatter
Flow cytometry was performed using a Becton Dickinson Biosciences FACS Calibur flow cytometer and analyzed using CellQuest software (BD Biosciences, San Jose CA). Dead cells/debris and doublets were gated out of the analysis. A minimum of 10,000 gated (live, singlet) cells was analyzed for particle uptake using Forward and Side-Scatter analyses. Particle uptake by cells resulted in vesicular and particle inclusions, resulting in increased Side-Scatter as previously described (Suzuki et al., Citation2007). Data were presented as median fluorescence intensity.
Viability determination
Cell counting
Because the coloration and optical density of the AuNP interfered with methods depending on dye color absorption or fluorescence such as MTT/MTS assays, toxicity of the AuNP was tested by (a) plating equal numbers of cells to each well and then (b) counting only the cells remaining in the plate after treatment. As the adherent macrophages undergo cell death, they release from adherence to the plate. Briefly, the macrophages were plated in 24-well plates as above, allowed to adhere and AuNP suspensions were added to the cell cultures to give final concentrations of 0, 5, 25 and 50 µg/ml. The cells were treated for 48 h and then any loose (dead/dying) cells and any free AuNP were thoroughly washed from the plates to eliminate those from the count. Therefore, only live adherent cells were counted at the end of treatment using trypsin/EDTA reagent and gentle scraping to generate a cell suspension for each well. The cell suspensions were counted using the Coulter counter.
Dichlorofluorescein diacetate (DCFDA) protocol
RAW 264.7 macrophages were used and ≈50,000 cells were suspended in 100 μl complete media and added to each well in a 96-well plate using the method described above. Then the plate was incubated for 2 h at 37 °C to allow the cells to adhere. A 10 ml solution of 10 μM DCFDA was made by adding 2 μl of 50 mM of DCFDA stock (Life Technologies, Grand Island, NY) into 10 ml PBS. The media in the microtiter plate was removed and 100 μl DCFDA/PBS solution was added to each well containing the cells (with the exception of a control section which contained no DCFDA/PBS solution). The plate was then incubated in the dark for ≈1 h to allow the dye to load into the cells. The dye solution was then removed and the plate washed gently using PBS. The AuNP suspensions were added to each well to give final concentrations of 0, 5, 25 and 50 µg/mL and LPS (1 µg/ml) was added to an identical set of wells. The plate was read on a Synergy HT plate reader (and associated Gen5 2.00 software; BioTek, Winooski, VT) several times throughout a period of a day and a half. The 96-well plate was read for fluorescence, with the excitation set at 485 nm and the emission at 528 nm.
Tumor necrosis factor (TNF)-α ELISA
The presence of TNFα in the culture media of the RAW264.7 cells treated for 48 h with AuNP was measured using an OptEIA set (BD Biosciences Pharmingen, San Diego, CA), using the lyophilized recombinant mouse TNFα kit-provided standards and following manufacturer protocol. Briefly, the microwells of the plate were coated with 100 μl diluted kit Capture Antibody per well overnight. After washing and blocking, 100 μl of each standard and sample were added to appropriate wells. After 2 h incubation and washing, 100 μl diluted detection antibody was added to each well. Kit Enzyme Reagent (streptavidin-horseradish peroxidase-conjugate, SAv-HRP, 250X) was then added to each well and incubated at room temperature for 30 min. After washing, 100 μl kit-provided 3,3′,5,5′-tetramethylbenzidine (TMB) substrate solution was added to each well and the reaction was stopped with 100 µl of 1 N HCl after color developed in the standard wells. The absorbance in each well was then measured using the plate reader at 450 nm.
Mouse splenocyte culture and cytokine analysis using a cytokine bead array (CBA)
To investigate the effect of AuNP on the adaptive immune system, mouse splenocytes were prepared as previously described (Zebedeo et al., Citation2014). In brief, spleens were harvested from C57BL/6 mice into PBS (1 ml sterile PBS/spleen) and mincing the tissue between frosted ends of glass slides. After allowing tissue debris to settle out, the cell suspension was transferred to a clean conical tube and then centrifuged for 5 min at 1500 rpm to pellet the splenocytes. The pellet was re-suspended in 5 ml of 1 X RBC Lysis Buffer (eBioscience, San Diego, CA), incubated for ≈5 min and the reaction then stopped by diluting the Lysis Buffer with 10 ml of 1X PBS. The white blood cells were centrifuged at 1500 rpm for 5 min and re-suspended in complete media to be plated in a 24-well plate (to give 106 cells/well) and treated with the AuNP as described above for the macrophages. Thereafter, the plate containing the treated cell suspensions was incubated at 37 °C for 48 h.
For analyses of cytokines produced by the treated cells, a TH1/TH2/TH17 Cytokine Bead Array assay system (BD BioSciences) was employed. For the analyses, lyophilized Mouse TH1/TH2/TH17 Cytokine Standards were reconstituted according to manufacturer instructions and serially diluted to create standard curves for each cytokine to be analyzed. For each collected sample, Mixed Capture Bead suspensions (50 μl) were added to microfuge tubes to which the culture media samples or standards (50 µl aliquots) were added. Thereafter, 50 μl mouse TH1/TH2/TH17 PE Detection Reagent was added to each tube and the tubes were then incubated in the dark. After washing and centrifugation, the pellets were re-suspended in preparation for analysis by flow cytometry.
To perform the flow cytometry, the instrument was set to detect the different bead values in one detector (FITC) and to quantify the amount of each cytokine using the PE detector; and the Cytometer Set-Up bead samples were used to optimize the settings for the PMT voltage for both colors and to eliminate emission overlap using fluorescence compensation. Once optimized, all standards and samples were analyzed using the same settings. Standard curves for all of the cytokines were created using the Median Fluorescence Intensity (MFI) for each known concentration. The concentration of each cytokine for each sample was then calculated by extrapolation from standard curves.
Statistical methods
Unless otherwise indicated, four replicates were used for each treatment group and experiments were repeated at least twice; representative data are shown in the figures. The cytokine data were analyzed by comparing means of the treated groups to the control using a 2-tailed, unpaired t-test (StatPlus Software, AnalystSoft, Inc., Vancouver, Canada). Dose–response or time-course data were analyzed 1-way analysis of variance (ANOVA) with a Bonferroni post-hoc test to compare between treatments (StatPlus). Mean values (±standard error of mean [SEM]) are shown as bars (+error bars) in the figures. Statistical significance was established as a two-tailed probability of Type I error occurring at <5%.
Results
Particle uptake: Light microscopy
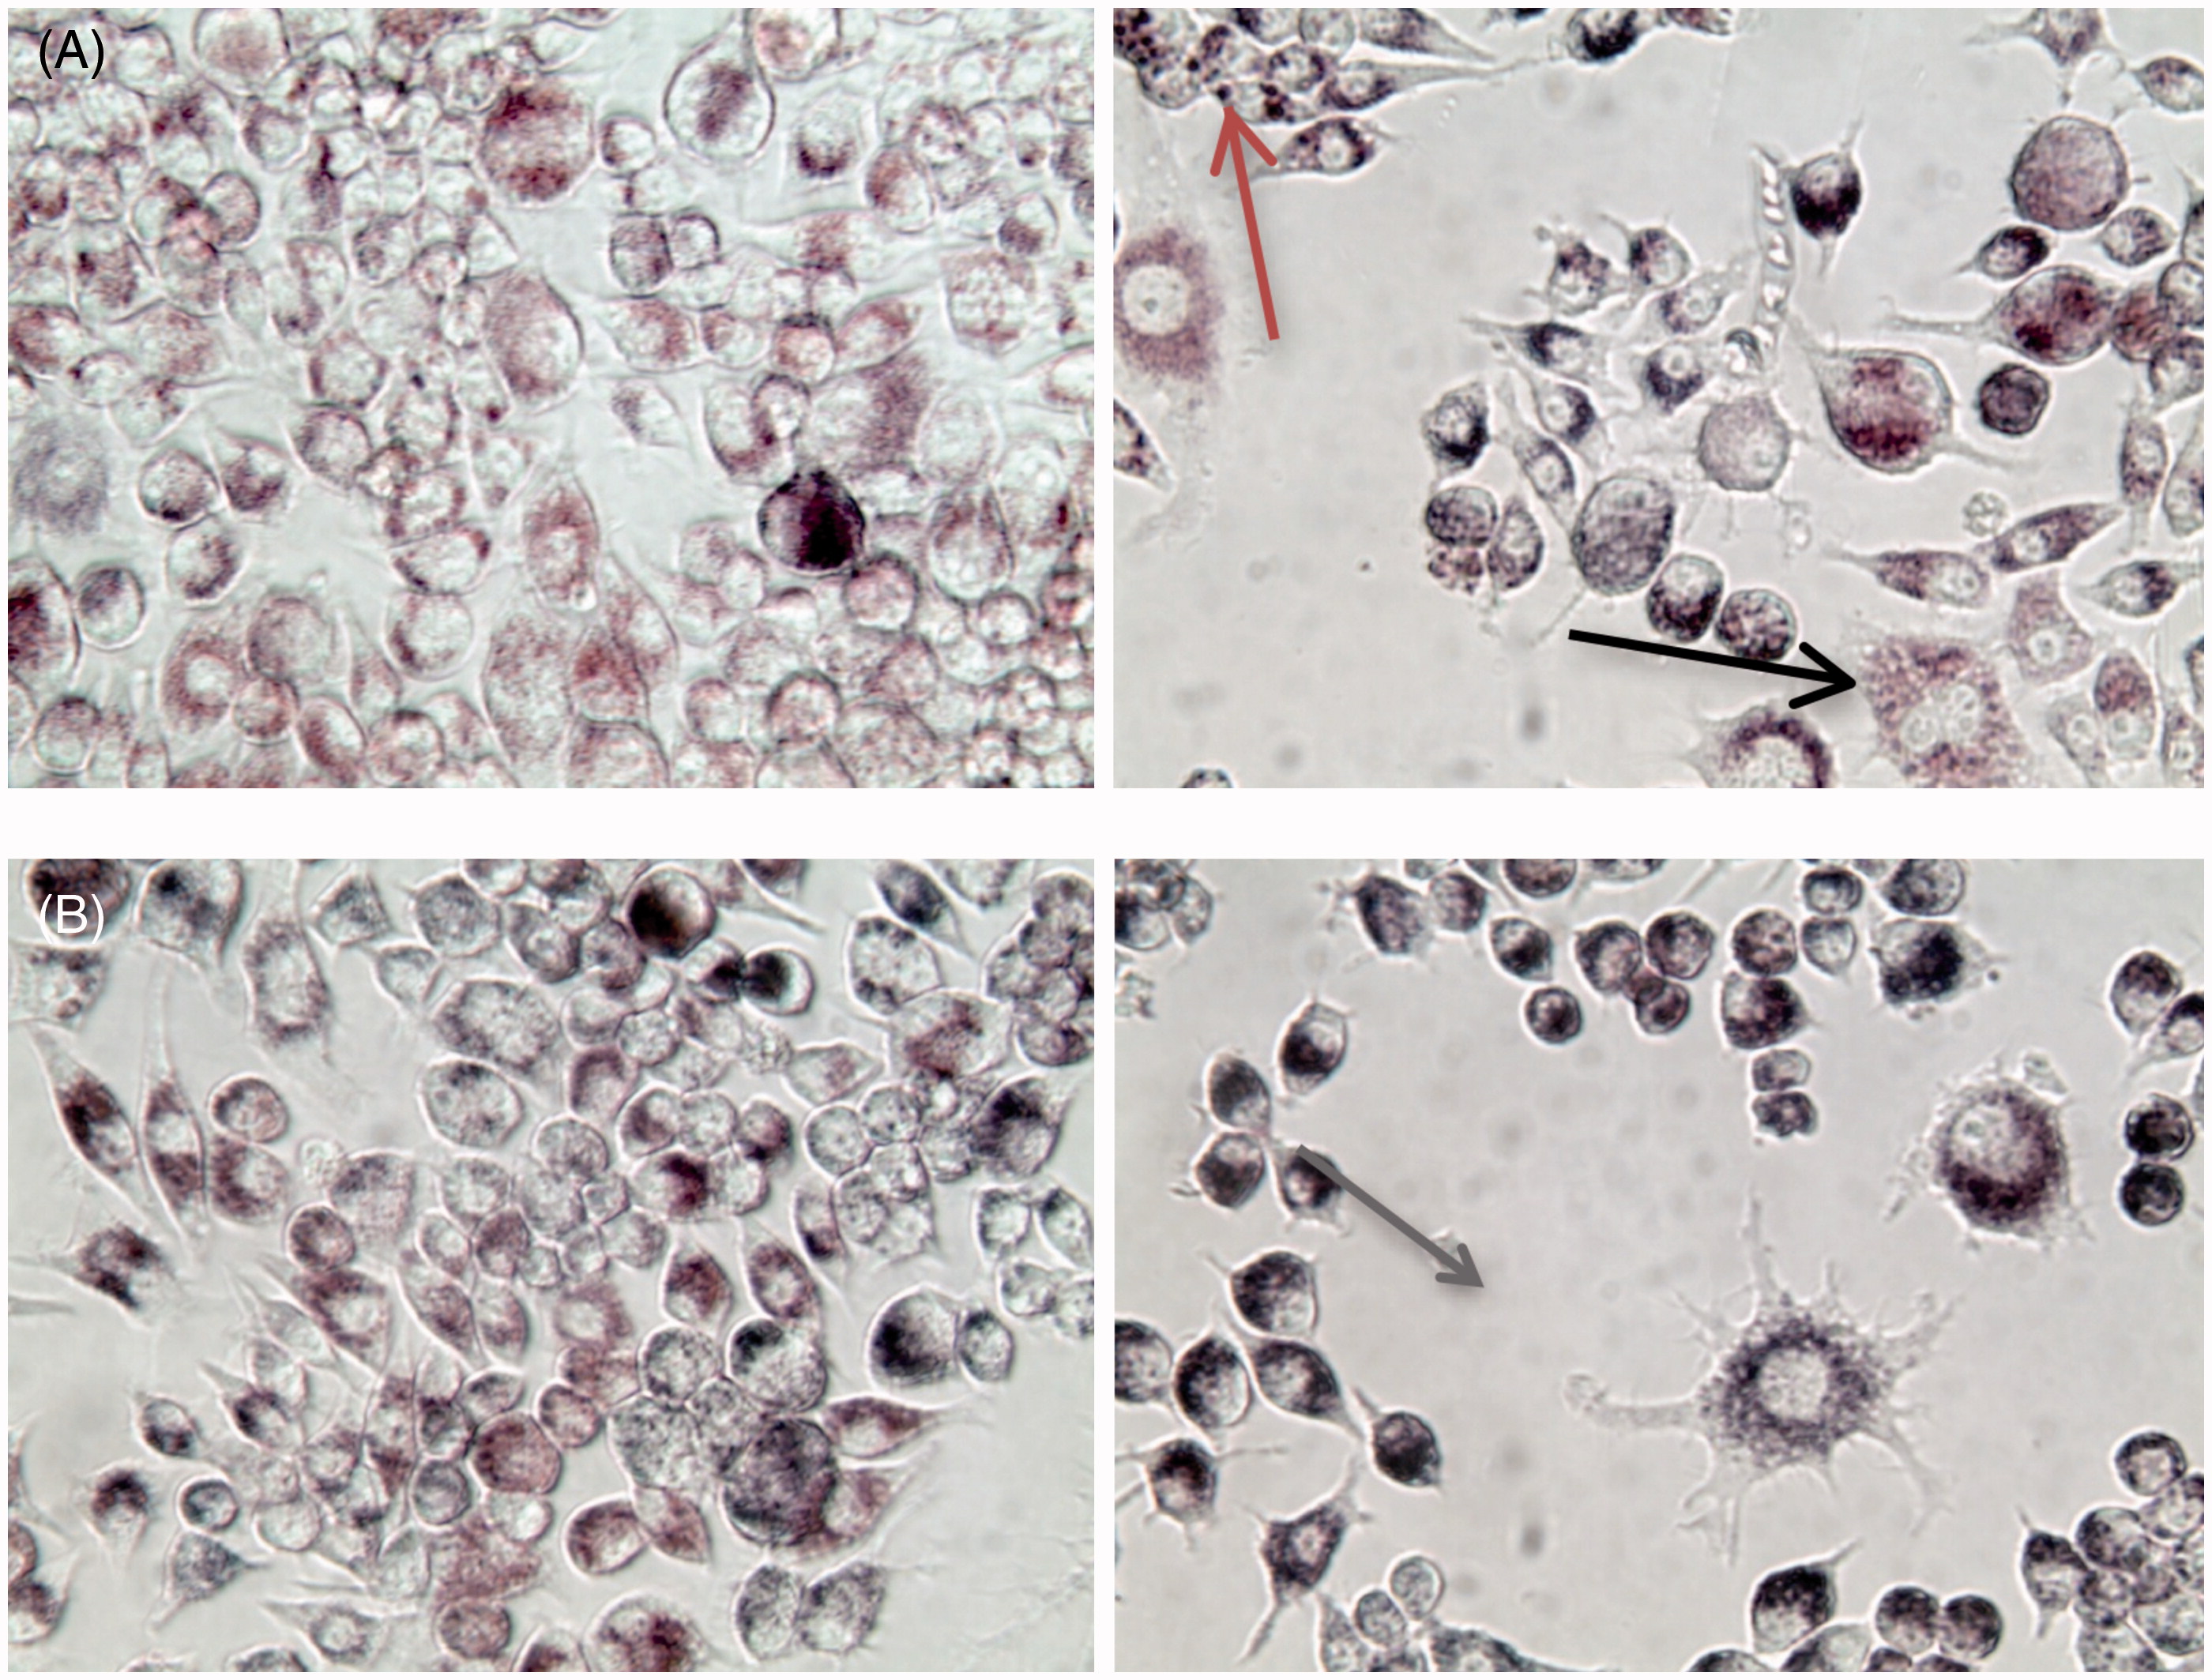
Visually, the mouse macrophage cells took up AuNP, regardless of the concentration of AuNP or treatment with LPS (). Cells without LPS treatment were more homogeneous in size and AuNP appeared to be dispersed throughout the cytoplasm (images on left). With LPS treatment, macrophages became activated, as seen by variations in size and cell division (black arrow), AuNP became concentrated in lysosomes (grey arrow, top right) and cells appeared highly phagocytic with extended pseudopods (grey arrow, bottom right).
Figure 1. RAW264.7 mouse macrophages treated for 24 h with (a) 25 µg/ml BioPure AuNP without LPS (left) and with LPS (right, 1 µg/ml). Red/Grey arrow = AuNP concentrated in phagosomes; Black arrow = cell division. (b) Cells treated for 24 h with 50 µg/ml Econix AuNP, with and without LPS. Gray arrow = activated macrophage. Total magnification = 400×.
Particle uptake: Flow cytometry
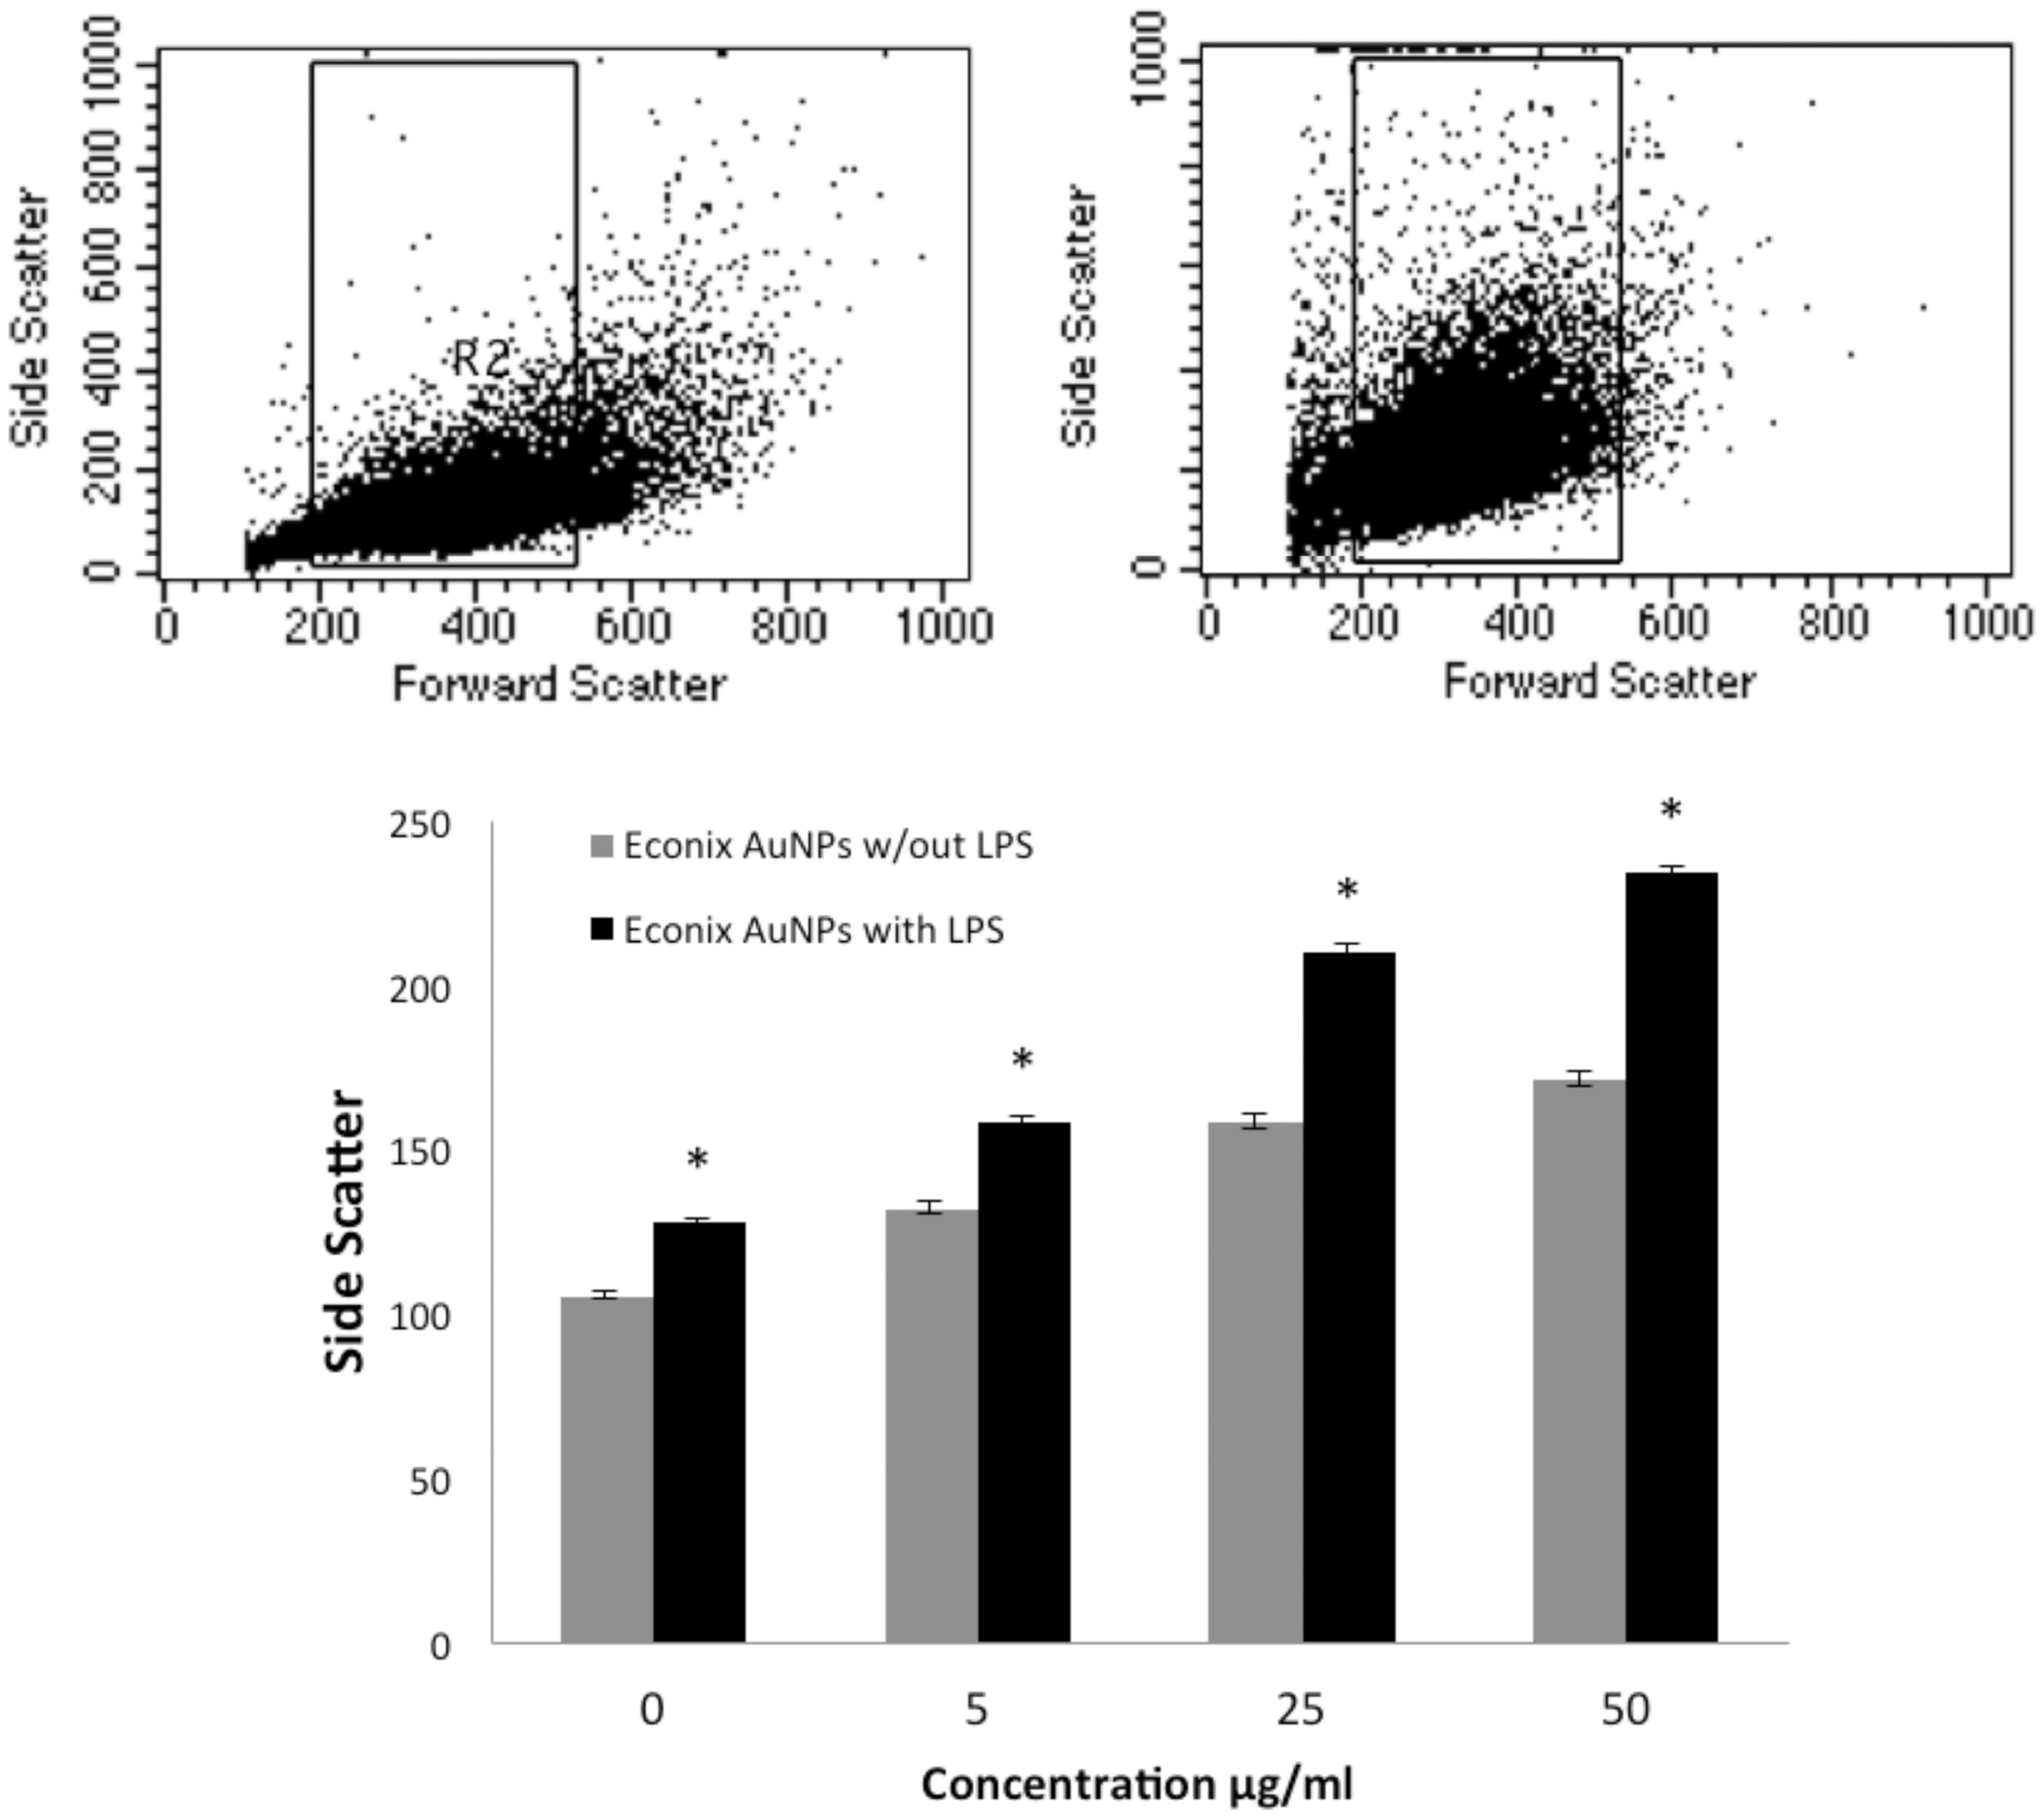
The AuNP uptake by the mouse macrophage cells was also confirmed using flow cytometry. As the concentration of AuNP increased, side scatter increased, verifying the uptake of the AuNP (). Representative dot-plots from the flow analyses are also shown in for macrophages treated with and without Econix AuNP at a very low concentration (100 ng/ml), showing the shift in side-scatter. Similar results were observed with the BioPure AuNP. LPS alone increased side-scatter, likely due to an increase in vacuoles within the activated cells.
Figure 2. Particle uptake was measured by flow cytometric detection of side scatter. The upper panel shows representative dot plots of untreated RAW macrophages (left) and with 100 ng/ml Econix AuNP (right). Graph shows concentration curves for Econix AuNP with and without LPS, both of which are statistically significant (ANOVA, p < 0.05). *p < 0.05 comparing with LPS to without LPS at each concentration (Bonferroni post-hoc analysis).
Cells remained viable at all treatment concentrations with and without LPS
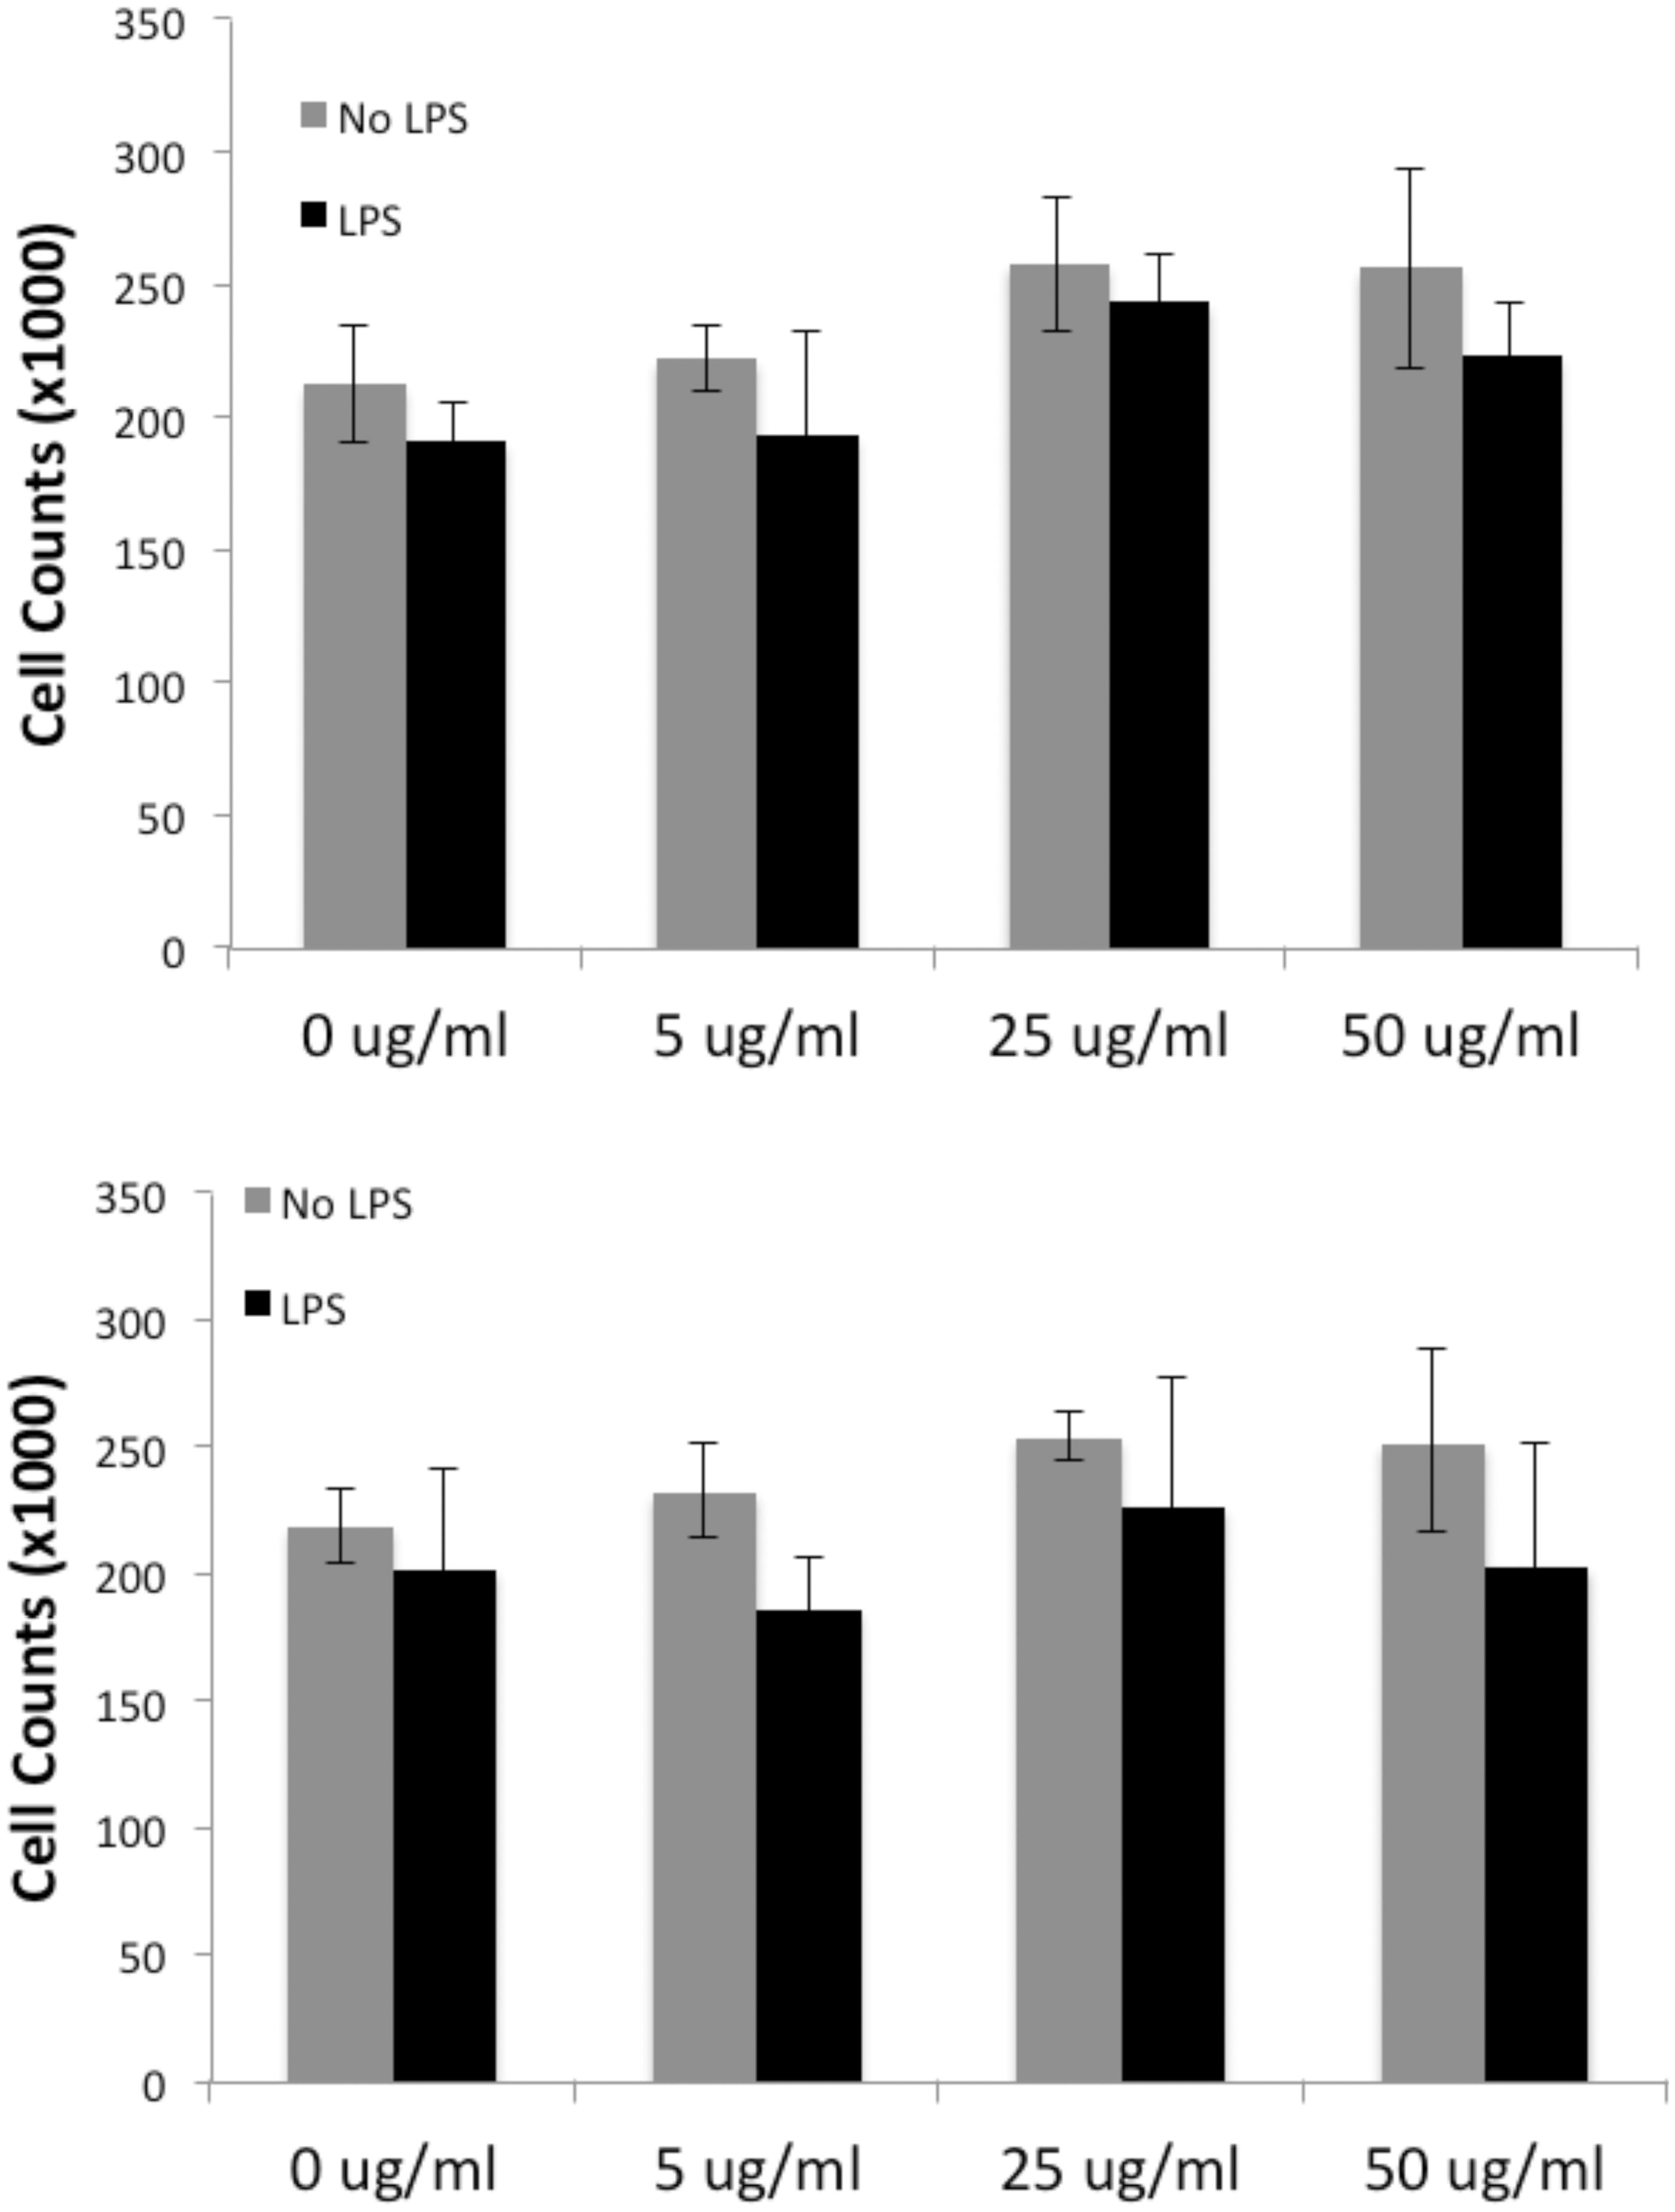
The effect of various concentrations of the BioPure and Econix AuNP with and without LPS was tested. It was found there was no statistically significant change in macrophage viability (). Therefore, it could be assumed that any subsequent experimental effects were not attributable to changes in cell number.
Figure 3. Neither BioPure (Top) nor Econix (bottom) AuNP affected cell viability, as measured by counting (Coulter) all cells in the well after 48 h treatment with particles at concentrations shown. LPS also had no effect on viability at 1 µg/ml.
Effects of AuNP on ROS production
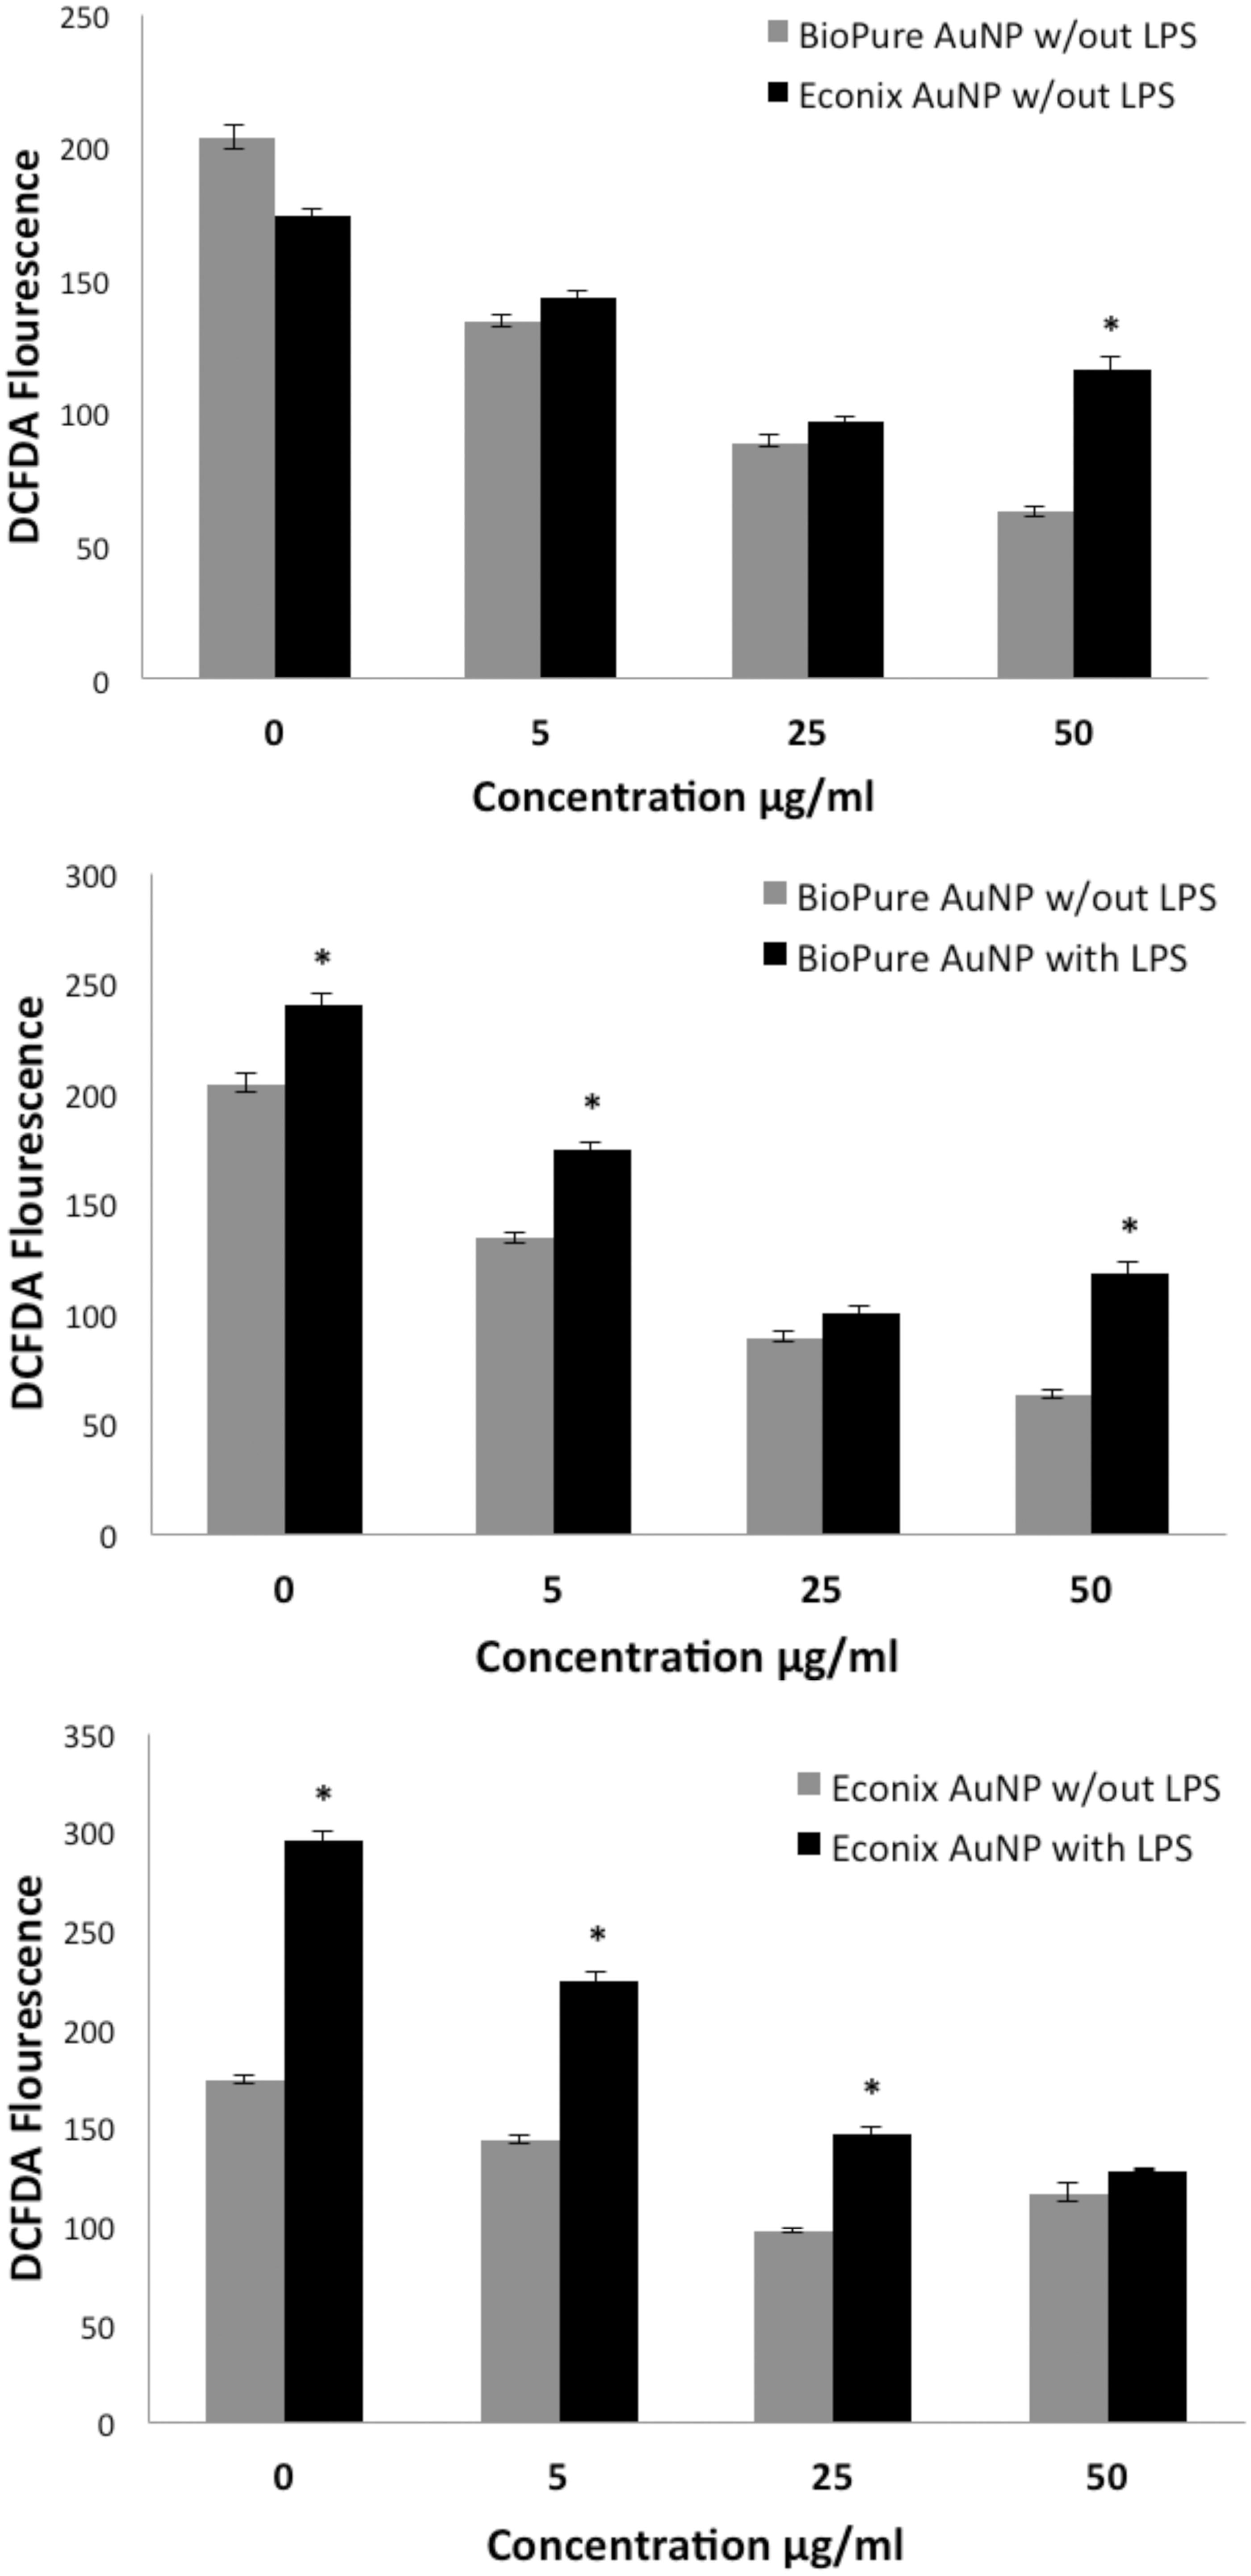
Both BioPure and Econix AuNP reduced ROS production compared to untreated cells as measured by the DCFDA assay and the dose response was significant (by ANOVA) for both the BioPure and Econix AuNP (, top). However, at the highest concentration, the cells treated with Econix had significantly more ROS production than BioPure treated cells (, top). It was questioned whether there might be undetectable endotoxin (LPS) in the Econix samples that was affecting the cellular response to the particles. Therefore, the BioPure and Econix AuNP were each tested in a DCFDA assay with and without 1 µg/ml LPS (, middle and lower graphs). In both cases, LPS significantly increased ROS production in the absence of AuNP and at low concentrations of both particles. However, at a high concentration (50 µg/ml), LPS only affected the response to BioPure AuNP. Thus, despite the overall composition of BioPure and Econix AuNP being identical, they induced different ROS responses, possibly due to endotoxin contamination of the Econix AuNP, as these particles were not certified endotoxin-free. However, as stated earlier, endotoxin was not detected to a level of 0.01 EU/ml in any of the cultures or stock suspensions of AuNP.
Figure 4. Increasing AuNP concentrations (both BioPure and Econix) reduced ROS production by cultured macrophages. RAW macrophages were treated with AuNP for 20 h and tested for ROS using the DCFDA assay. Top: Comparison of the response with BioPure compared to Econix. By ANOVA, the dose response was statistically significant for both BioPure and Econix AuNP. Middle: BioPure AuNP with and without LPS. By ANOVA, the dose response was statistically significant both with and without LPS. Bottom: Econix AuNP with and without LPS. By ANOVA, the dose response was statistically significant both with and without LPS. n = 4 in all experiments, *p < 0.05 comparing paired (black vs grey) bars.
In order to determine the effect of AuNP over time, in the absence of any residual endotoxin, ROS was measured in RAW macrophage cells treated with BioPure AuNP at different timepoints and concentrations (0, 5, 25 and 50 µg/ml) (). As expected, untreated values increased over time and were statistically different from all treatment groups after 18 h. However, the presence of AuNP prevented this increase at all concentrations and all timepoints.
Figure 5. AuNP quenched production of ROS. ROS was measured in RAW macrophage cells treated with BioPure AuNP at different timepoints and concentrations of 0, 5, 25 and 50 µg/ml. Untreated values increased over time and were statistically different from all treatment groups after 18 h. n = 4 in each group. *p < 0.001 [ANOVA].
![Figure 5. AuNP quenched production of ROS. ROS was measured in RAW macrophage cells treated with BioPure AuNP at different timepoints and concentrations of 0, 5, 25 and 50 µg/ml. Untreated values increased over time and were statistically different from all treatment groups after 18 h. n = 4 in each group. *p < 0.001 [ANOVA].](/cms/asset/c471875e-6fa3-4963-be61-b9fba7330f92/iimt_a_1035819_f0005_b.jpg)
TNFα levels
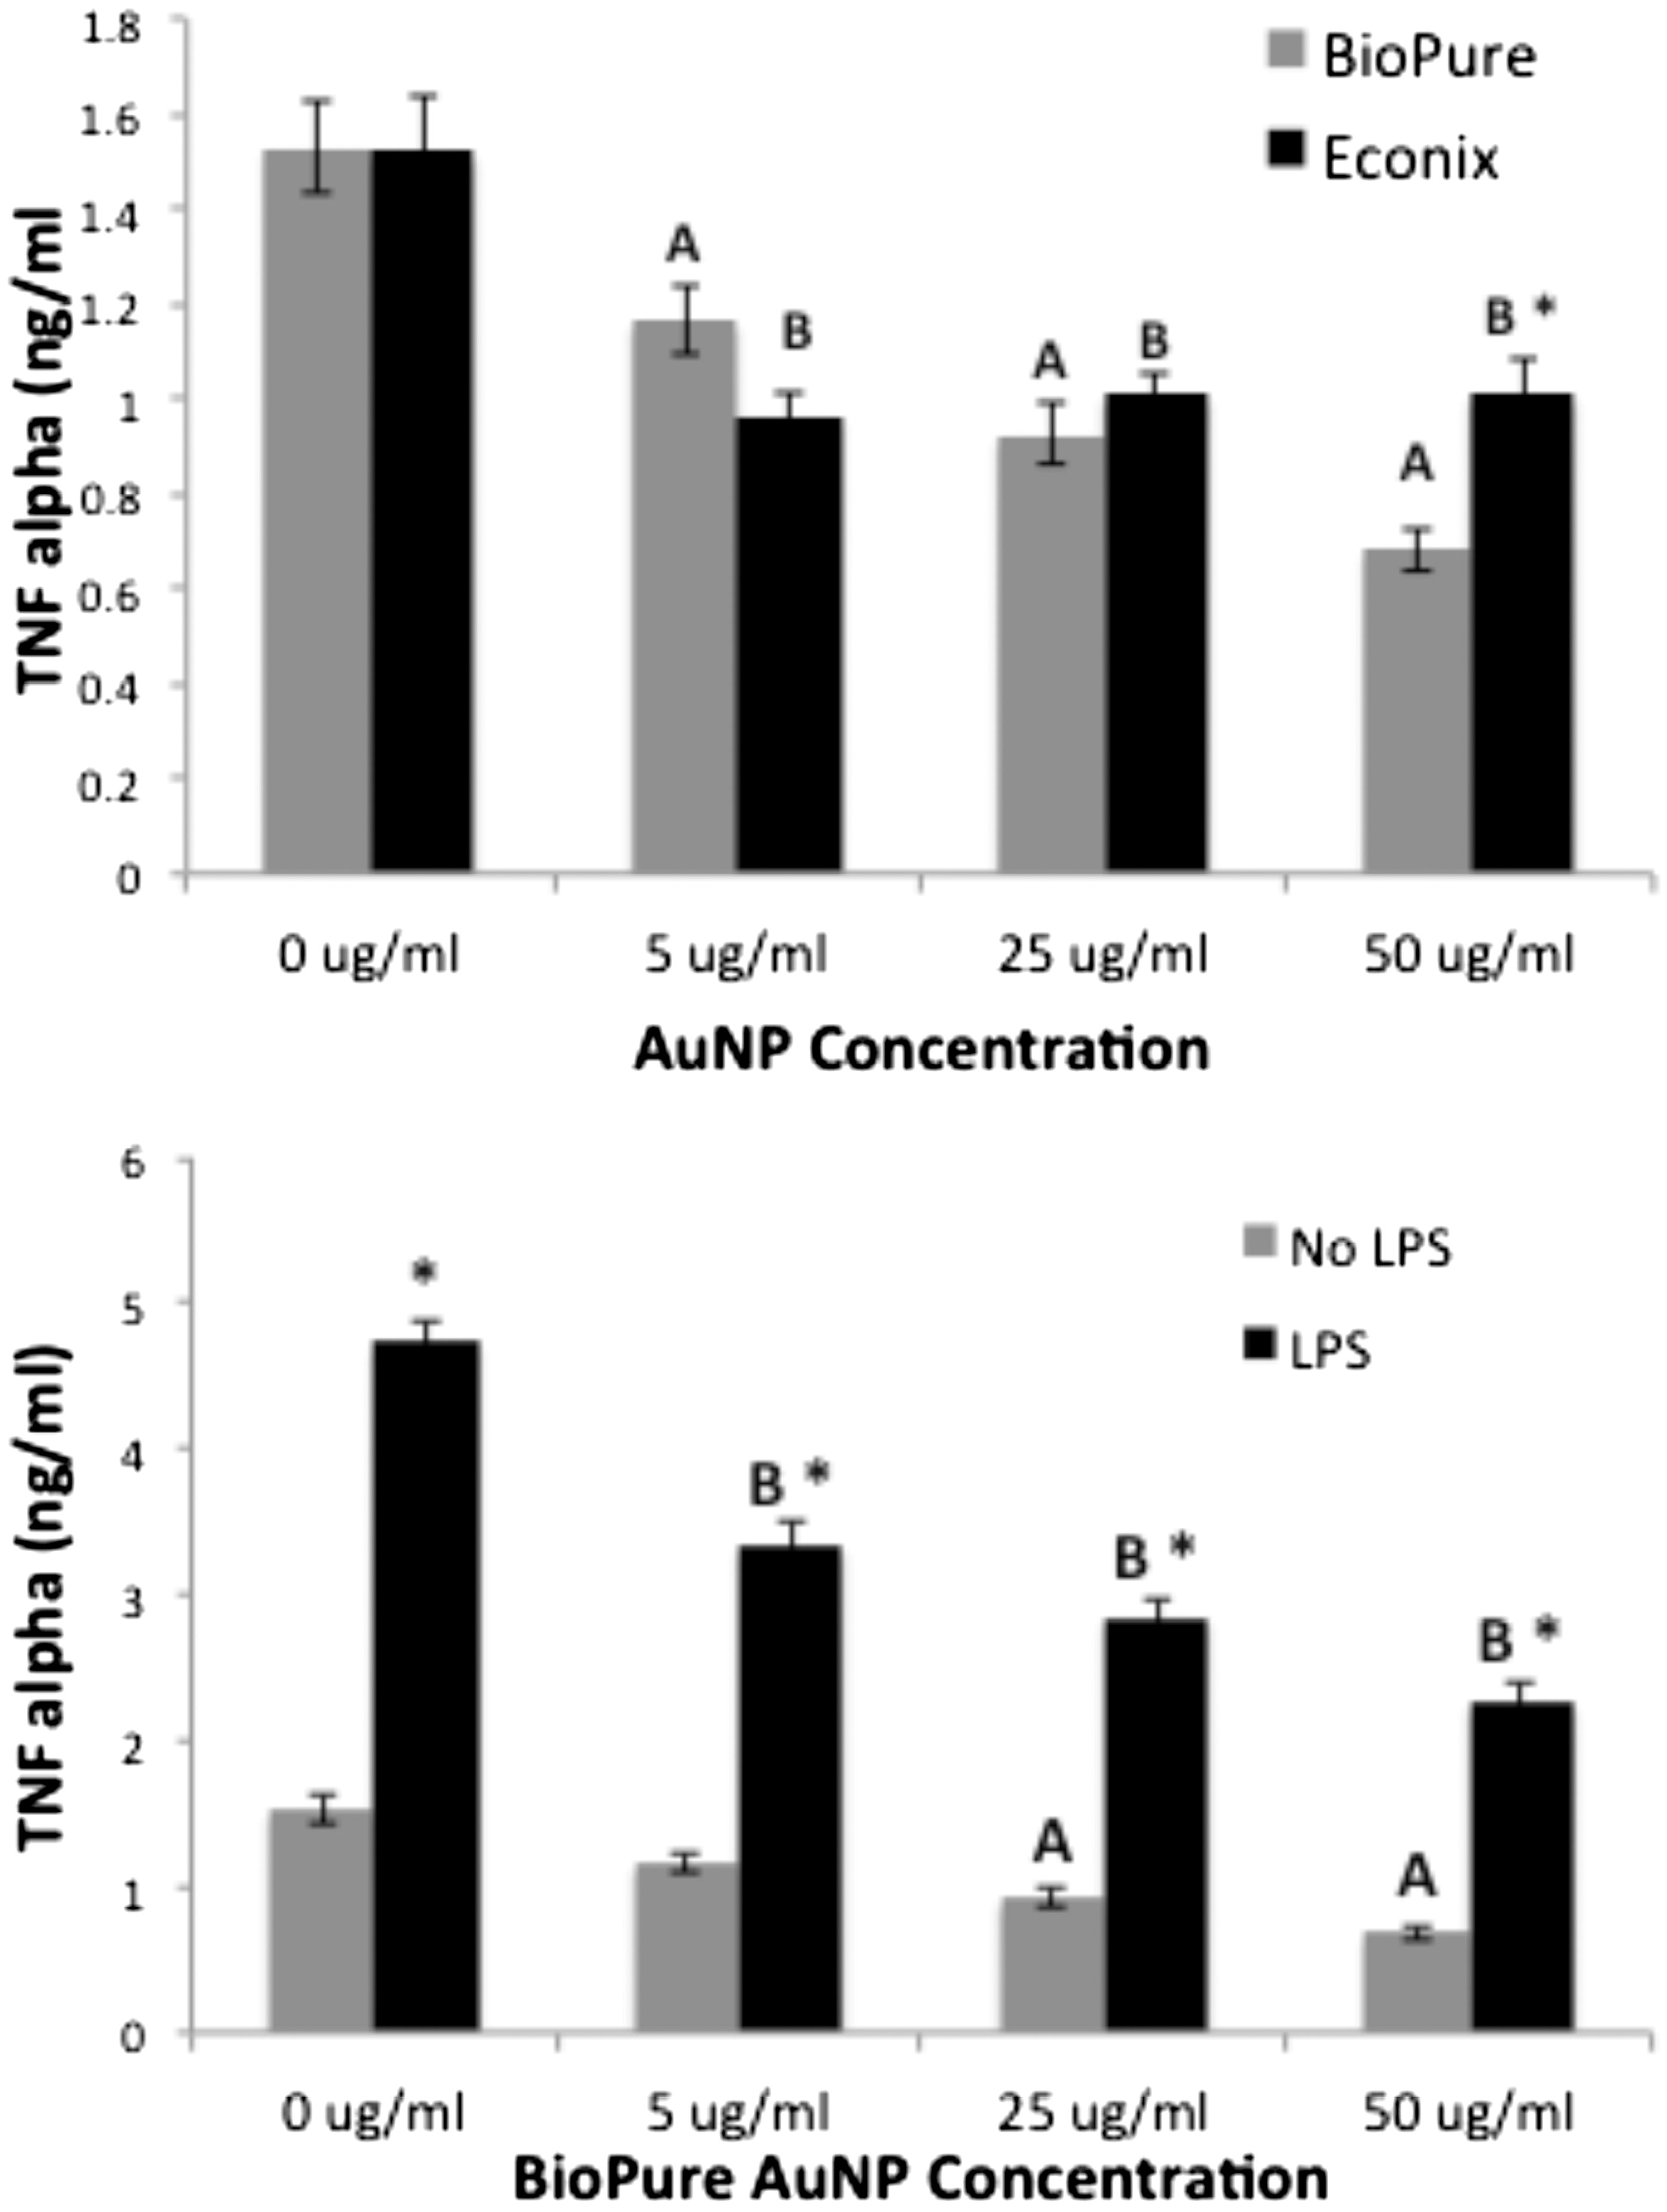
Culture media from RAW cells treated for 48 h with AuNP were assayed for TNFα. BioPure AuNP reduced cell production of TNFα in a dose-dependent manner compared to the amount made by untreated cells. Econix AuNP reduced TNFα at all concentrations as well, but there was no difference between the effects from concentrations of 5, 25 and 50 µg/ml. At 50 µg/ml, the TNFα level was higher for Econix than BioPure AuNP (, Top). A concern that evolved was whether this might be due to very low levels of endotoxin in the Econix preparation (that only became apparent at the high concentration). Therefore, the BioPure AuNP were tested for effects on production of TNFα with and without 1 µg LPS/ml added to the cultures at the same time as the particles. LPS significantly increased TNFα production by the macrophages and the AuNP decreased the amount of TNFα in a dose-dependent manner. However, as the levels did not reach those seen without LPS (, Bottom), it was not a complete inhibition of the stimulated cytokine production.
Figure 6. Both BioPure and Econix AuNP reduced TNF levels compared to control. Culture media from RAW cells treated for 48 h with AuNP and assayed for TNFα. Top: BioPure AuNP reduced TNFα in dose-dependent manner (p < 0.05, ANOVA); (a) significantly different from “no treatment” control in BioPure series. Econix AuNP reduced TNFα at all levels (b = change from control in Econix series), but there was no difference between effects from concentrations of 5, 25 and 50 µg/ml. TNFα level was higher for Econix than BioPure at 50 µg/ml (*p < 0.05, t-test). n = 4. Bottom: LPS increased TNFα at all concentrations of AuNP including control, *p < 0.01 compared to no LPS at that concentration. BioPure AuNP reduced the LPS-induced TNFα levels in a dose-dependent manner (B = p < 0.01).
TH1/TH2/TH17 array (CBA) analyses
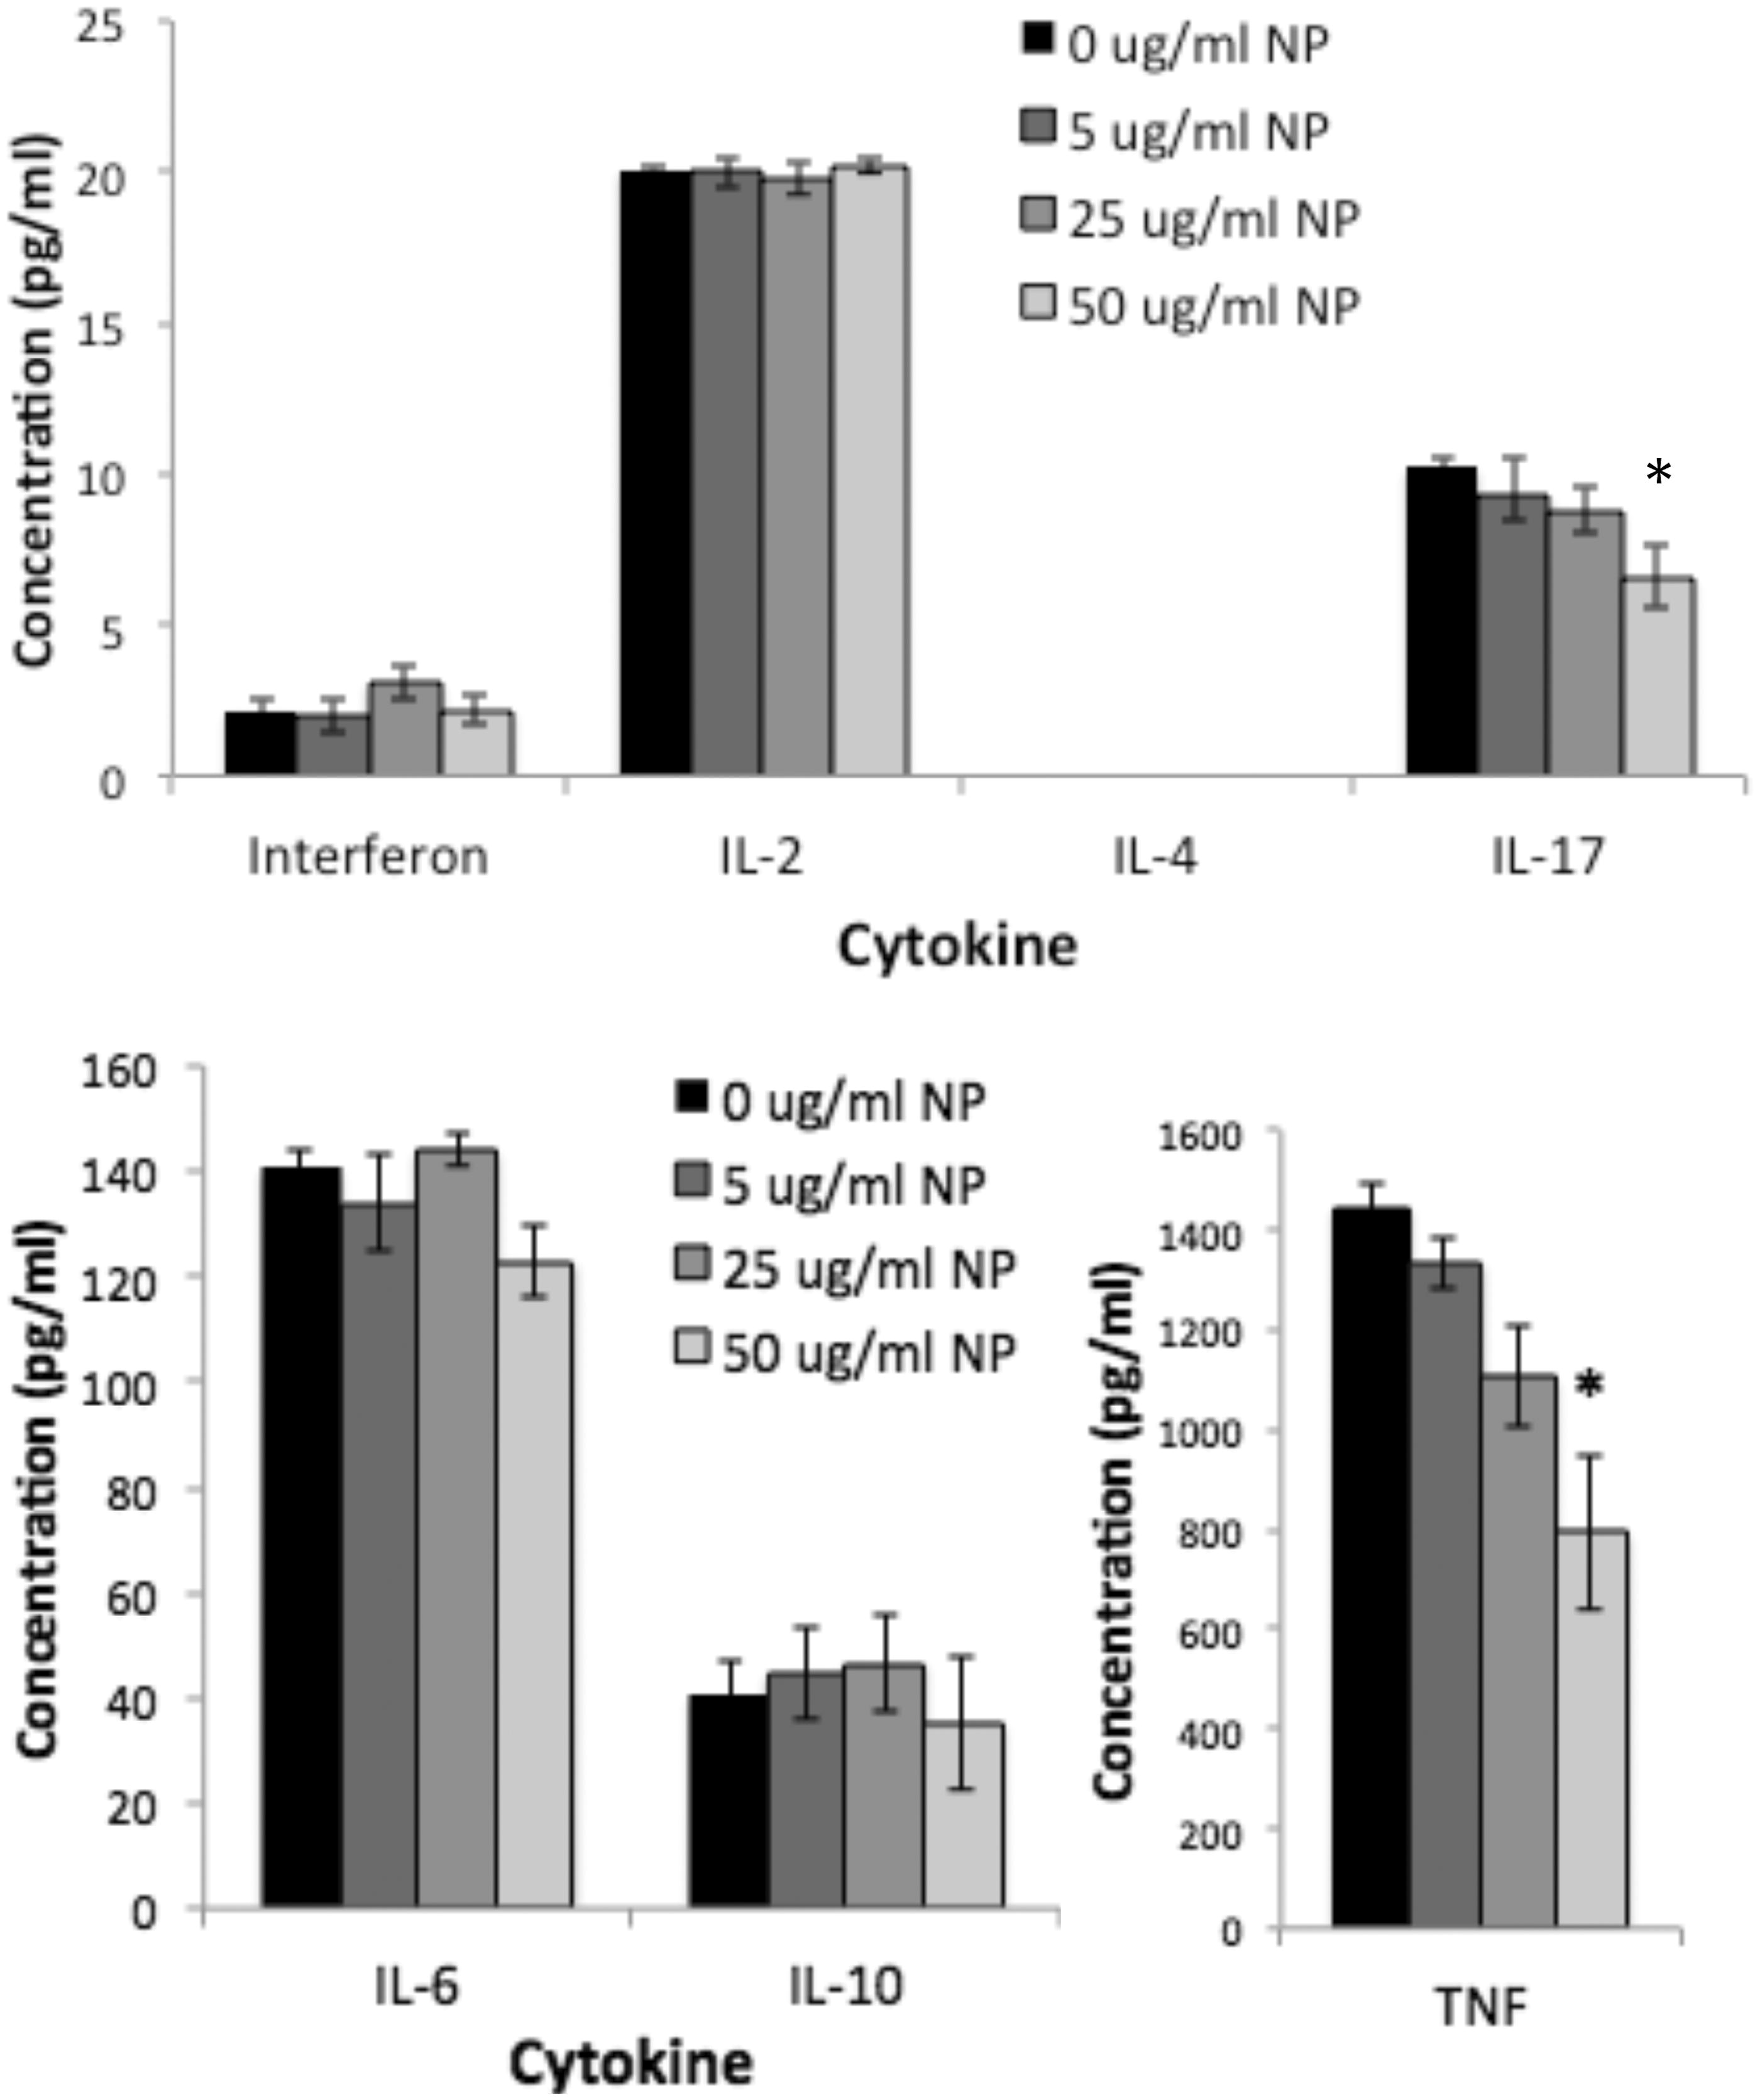
Levels of interleukin (IL)-2, −4), −6, −10 and −17 A, as well as of interferon (IFN)-γ and tumor necrosis factor (TNF)-α in the media recovered from splenocytes cultured for 48 h with BioPure AuNP were assessed. In the absence of LPS treatment, there were no statistically significant changes in the amount of cytokines release by the splenocytes, regardless of the AuNP concentration (). LPS significantly increased the amounts of all cytokines, except IL-2 and IL-4. Interestingly, the BioPure AuNP reduced these elevated cytokine levels for IL-17 and TNFα in a dose-dependent manner ().
Figure 7. AuNP alone had no effect on any of the cytokines tested by CBA. Data for the seven cytokines were split into two graphs with different y-axis ranges simply because of large differences in the amounts of the different cytokines produced by these cells under control conditions. n = 4, p > 0.05 for all cytokines and all concentrations.
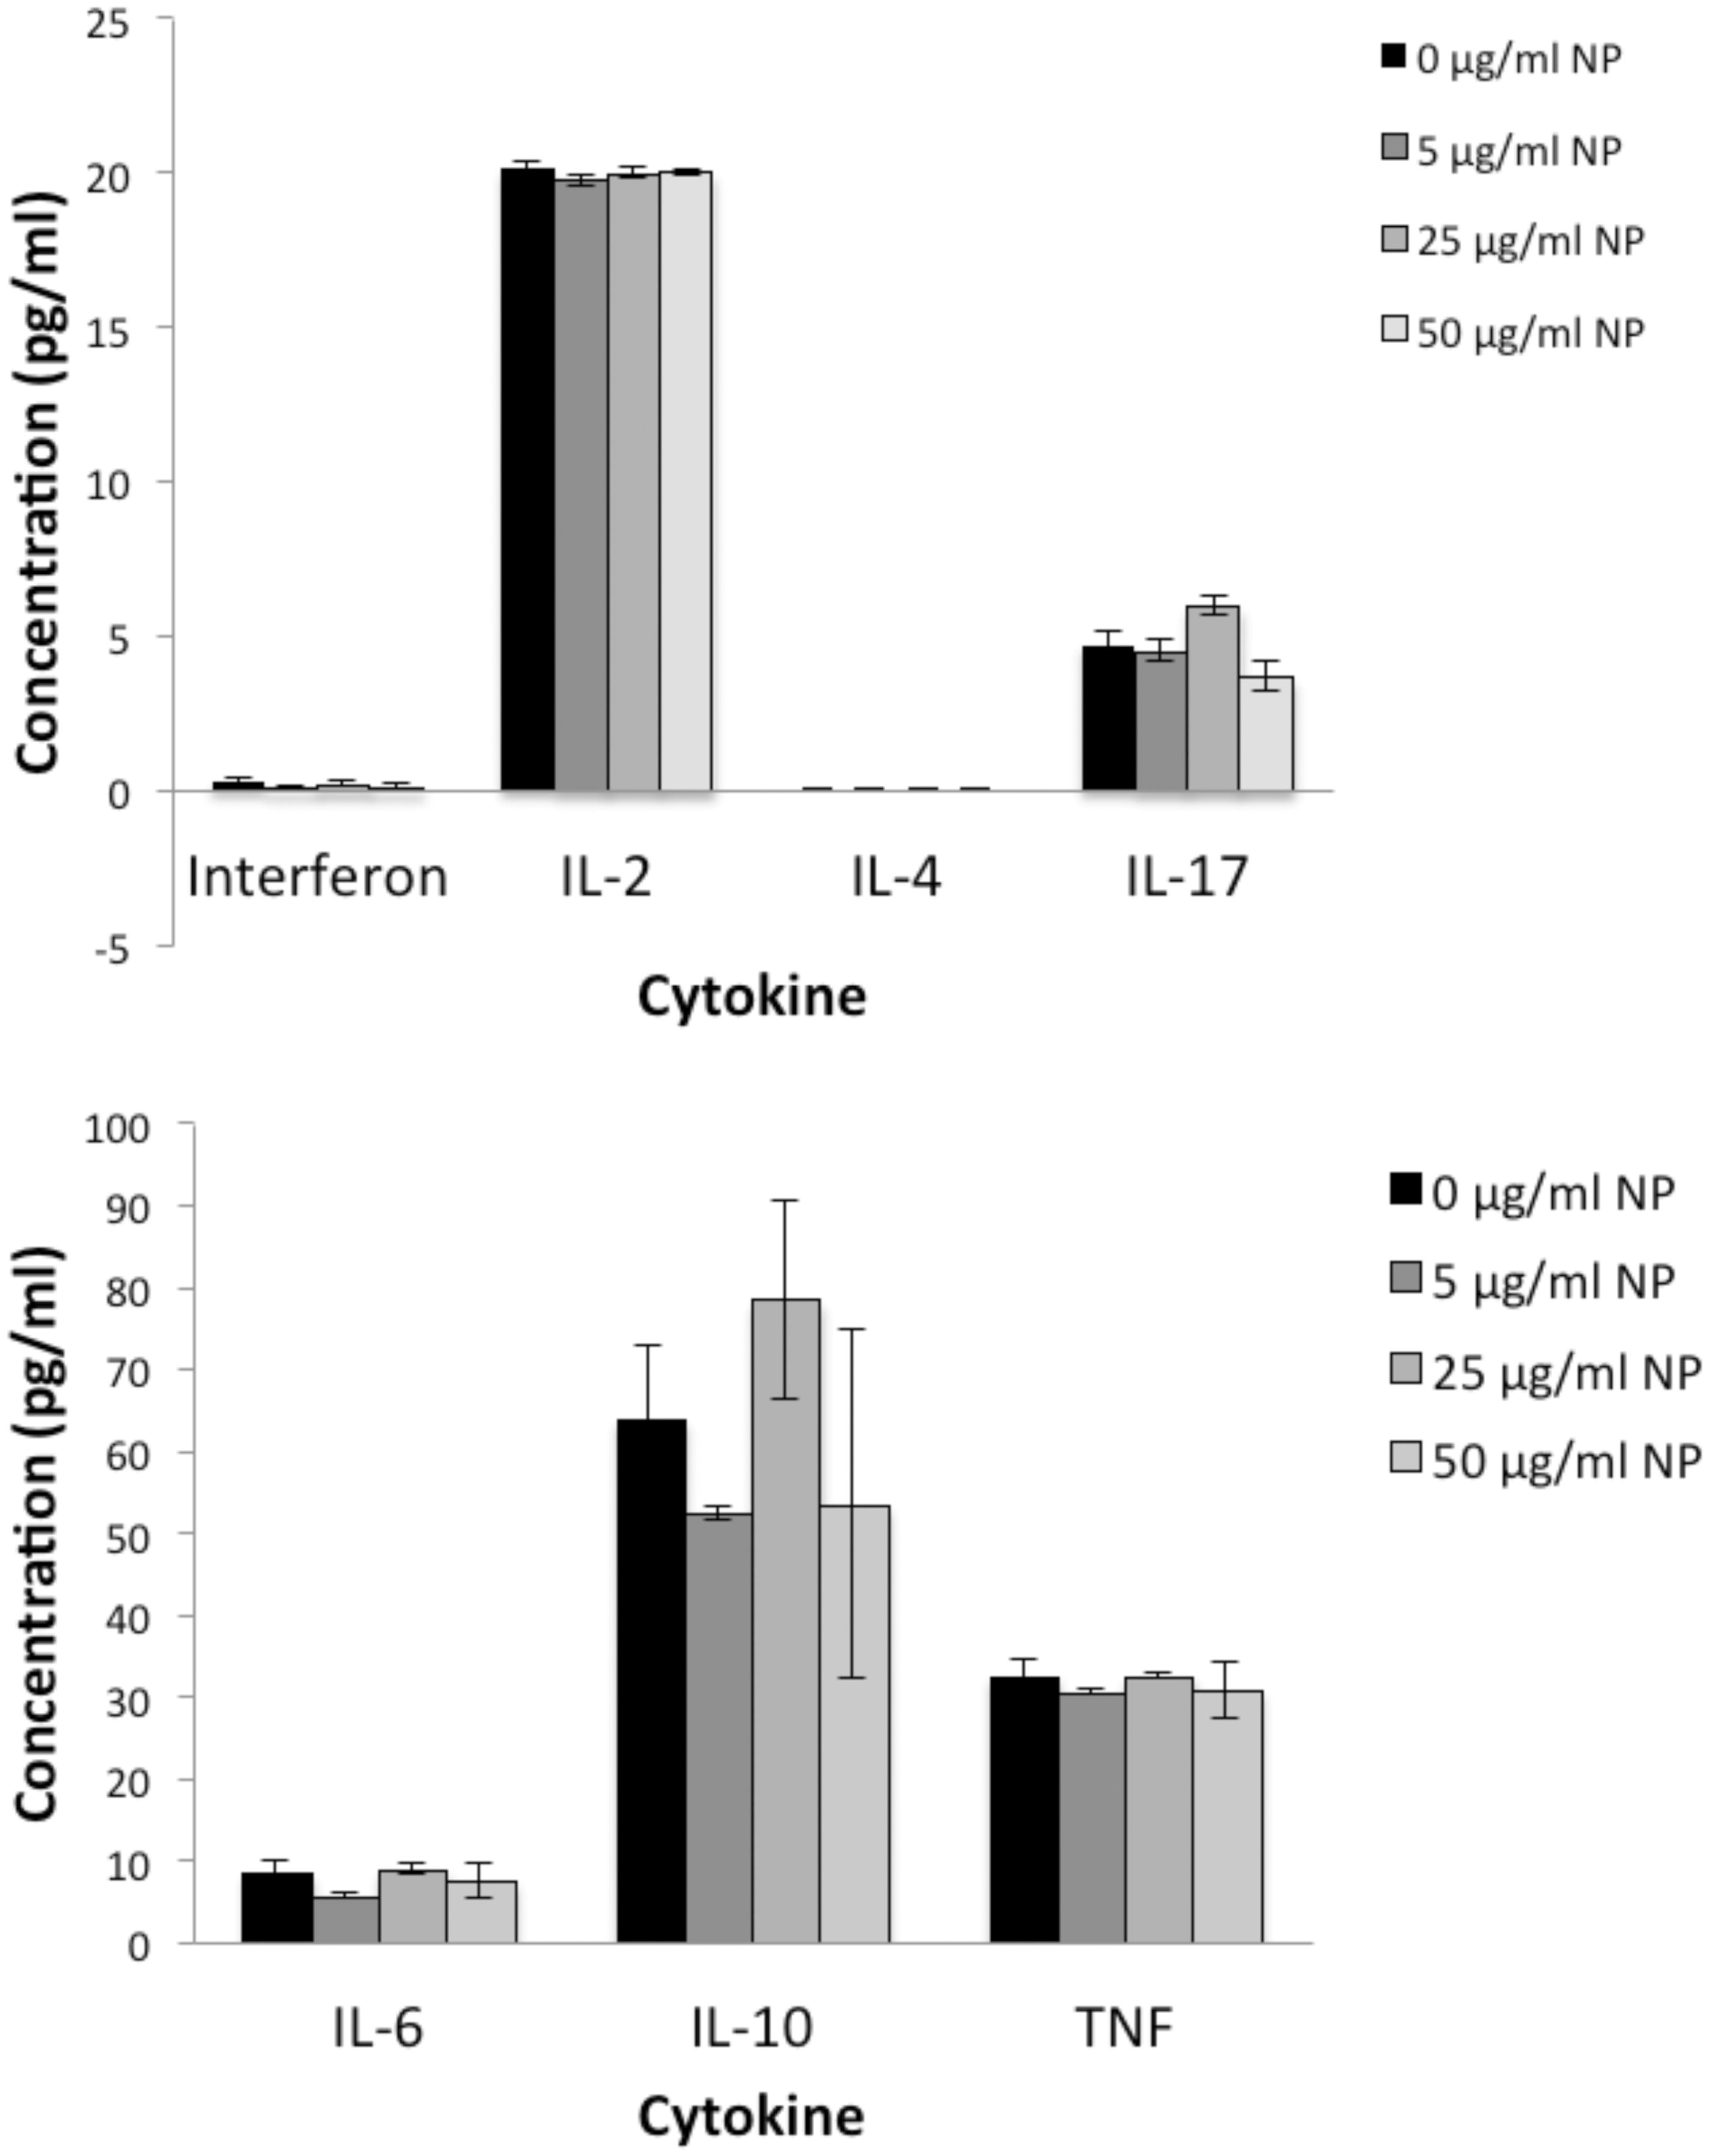
Figure 8. AuNP reduced LPS-induced IL-17 and TNFα production. LPS significantly increased production of all cytokines except IL-2 and IL-4 as compared to no LPS (shown in Figure 7). BioPure AuNP reduced levels of TNFα and IL-17 in a dose-dependent manner (p < 0.05, ANOVA). All cytokines were measured by CBA as in Figure 7. n = 4, *p < 0.01 compared to no AuNP treatment (0 µg/ml) for the particular cytokine (ANOVA, with Bonferroni post-hoc test). Separate graphs provided simply due to differences in scale for the various cytokines.
Discussion
Because there are many potential biomedical applications for AuNP, it is critical to understand the interaction of these materials with cells and tissues. Gold has historically been considered fairly inert, but little is known about potential effects of gold compounds at the nano scale. While some studies, including the one reported here, have demonstrated that AuNP are not particularly toxic in some systems, other cases (using different preparations of AuNP or models of toxicity) indicate a variety of risks, from hepatic toxicity to oxidative stress and inflammation (Gerber et al., Citation1998; Thakor et al., Citation2011). Very little is known about the effects of AuNP on the immune system. The immune system mediates not only local, short-term inflammatory responses, but also the ability to fight infection and control cancer. It also can become over-activated and lead to allergies, asthma and autoimmune diseases. So any effect of nanomaterials on cells of the innate and adaptive immune system could have dramatic side-effects when used for medical purposes.
Titanium dioxide NP, for example, is known to induce pro-inflammatory cytokines and reactive oxygen species in macrophages (Kang et al., Citation2008; Valles et al., Citation2006) and this translates to pulmonary inflammation in vivo (Liu et al., Citation2013a). Silver and zinc oxide NP also induced inflammatory responses (Liu et al., Citation2013a) but, clearly, the size and specific structure of the particles modified the response (Kang et al., Citation2008; Scherbart et al., Citation2011). Therefore, it is impossible to generalize regarding a response to a particular metal or metal oxide NP.
Effects on the immune system by AuNP are generally reported as minimal or anti-inflammatory (Downs et al., Citation2012; Villiers et al., Citation2010). Interestingly, gold in the form of colloid (Auranofin) was used for many years in the treatment of rheumatoid arthritis due to its ability to substantially decrease the inflammatory component of the disease (Madeira et al., Citation2012). AuNP show little cytotoxicity in vivo (Chen et al., Citation2013; Downs et al., Citation2012), but results in vitro have been mixed, with several studies indicating at least some immunostimulation (Du et al., Citation2012; Liu et al., Citation2012), dependent on coating and stabilization (Hashimoto et al., Citation2014). Nevertheless, the feasibility of using AuNP for the inhibition of inflammatory diseases has been considered, even though the precise mechanisms relating gold with anti-inflammatory effects remain unclear (Sumbayev et al., Citation2013). One possibility is inhibition of IL-12 production, shifting the immune response from the pro-inflammatory TH1 response to a more anti-inflammatory TH2 response (Kim et al., Citation2001). Sumbayev et al. (Citation2013) showed that AuNP could inhibit IL-1β-induced activation of inflammatory responses, but the response was dependent on AuNP size. In fact, one study demonstrated a down-regulation of inflammatory cytokines induced by LPS (Villiers et al., Citation2010), consistent with our results. This could have a negative impact if it limited the ability to respond to infection, but a positive impact if it limited pathogenic responses. Interestingly, in both the Villiers study and the results reported here, IL-6 was not affected by the presence of AuNP, while other highly inflammatory cytokines (IL-12 and TNF, respectively) were inhibited. This suggests that AuNP do not completely inhibit the ability to mount an inflammatory or immune response, but rather they selectively impact only a subset of cytokines. Because the results showed a specific inhibition of IL-17, a cytokine implicated in pathologic responses (Furuzawa-Carballeda et al., Citation2007), the inhibition by AuNP may be protective. These results require follow-up in specific infection and disease models.
IL-17 and TNFα are implicated in a TH17 response profile, which exists in several disease states (Afzali et al., Citation2007). As these cytokines and ROS were both inhibited in a dose-dependent manner by the AuNP, cytokine inhibition may be due to the ability of the AuNP to reduce the oxidative stress in these cells when stimulated with LPS. TNFα has been shown to be inducible via oxidative stress (Schreck et al., Citation1992). Since the AuNP reduced the ROS, this may be the mechanism of reduced TNFα from the macrophages. In turn, TNFα is one of the key cytokines involved in induction of the TH17 pathway and IL-17 production by T-cells. Therefore, by reducing ROS, AuNP may sequentially inhibit both TNFα and IL-17 after LPS stimulation.
The reduced ROS by AuNP was unexpected since macrophages generally undergo oxidative stress during phagocytosis of a variety of particles (Blake et al., Citation2007; Pfau et al., Citation2012; Scherbart et al., Citation2011; Valles et al., Citation2006). However, this may be highly affected by particle size. For example, AuNP mostly in the ranges of 5–10-nm that were coated with sodium citrate caused the release of ROS to increase 3-fold in exposed rainbow trout (Farkas et al., Citation2010). However, Ionita et al. (Citation2008) found that AuNP were able to both generate and scavenge short-lived free radicals, highly dependent on the local chemistry. This is consistent with the results of other studies that explored effects of AuNP on ROS using alternate means to measure them (i.e. Electron Paramagnetic Resonance Spectroscopy). The AuNP of both 2.5- and 15-nm diameters had an ability to adsorb oxygen radicals as effectively as therapeutic anti-oxidants like Tempo, Tempone and Tempamine (Zhang et al., Citation2003). The oxygen radical scavenging was increasingly effective as the concentration of the AuNP increased, which actually eliminated the radicals measured after a high enough concentration of AuNP was reached (Zhang et al., Citation2003).
The AuNP products used in the experiments reported here may have behaved similarly; absorbing any ROS produced by the cells by natural oxidative processes or induced by LPS, leading to a return to baseline ROS levels in the presence of the AuNP. However, the PVP coating would be expected to reduce the radical-scavenging ability of AuNP (Zhang et al., Citation2003). Further study is clearly needed to determine the physicochemical characteristics of the AuNP used here that led to what appears to be ROS scavenging from the cells. The observation is particularly important because (a) different particles have unique effects on cellular anti-oxidant mechanisms and (b) inflammatory cytokines are known to be differentially regulated by redox conditions (Murata et al., Citation2002; Overocker & Pfau, Citation2012). Therefore, particles that reduce ROS in macrophages would be expected to inhibit production of ROS-regulated cytokines.
Conclusions and future work
The 50-nm AuNP used here showed no cytotoxicity in mouse macrophages and specifically inhibited two cytokines associated with the TH17 pathogenic immune response, TNFα and IL-17, possibly via modulation of ROS. These results suggest that AuNP may have immune modulatory effects that could be beneficial in reducing inflammatory or pathogenic immune responses and illustrate a need for animal model studies to clarify the effects of different exposure modes in vivo.
The implications for possible health benefits of AuNP would need to be further studied for different sizes of AuNP as the surface interactions and, therefore, chemistry of NP are known to change at least somewhat as the size of the NP change, particularly as the AuNP diameter reaches 15-nm and below, which is small enough for Ostwald ripening to be significant. It would also be useful to study the effects of using coatings other than PVP to fully realize how much of an effect the coating has on the AuNP toxicity and what interactions actually occur.
Supplementary material available online
Supplementary Figures S1–S3
Gold_NP_Kingston_FigureS1.pdf
Download PDF (103.7 KB)Gold_NP_Kingston_FigureS2.pdf
Download PDF (73.6 KB)Gold_NP_Kingston_FigureS3.pdf
Download PDF (568.5 KB)Acknowledgments
The authors gratefully acknowledge the analyses performed by Nanocomposix, Inc. (San Diego, CA).
Declaration of interest
This work was supported in part by a grant from NIGMS: the Idaho INBRE program (P20 GM103408). The authors report no conflicts of interest. The authors alone responsible for the content and writing of the paper.
References
- Afzali, B., Lombardi, G., Lechler, R. I., and Lord, G. M. 2007. The role of T-helper 17 (TH17) and regulatory T-cells (Treg) in human organ transplantation and autoimmune disease. Clin. Exp. Immunol. 148:32–46
- Blake, D. J., Bolin, C. M., Cox, D. P., et al. 2007. Internalization of Libby amphibole asbestos and induction of oxidative stress in murine macrophages. Toxicol. Sci. 99:277–288
- Chen, H., Dorrigan, A., Saad, S., et al. 2013. In vivo study of spherical gold nanoparticles: Inflammatory effects and distribution in mice. PLoS One 8:e58208
- Downs, T. R., Crosby, M. E., Hu, T., et al. 2012. Silica nanoparticles administered at the maximum tolerated dose induce genotoxic effects through an inflammatory reaction while gold nanoparticles do not. Mutat. Res. 745:38–50
- Du, L., Miao, X., Jia, H., et al. 2012. Detection of nitric oxide in macrophage cells for the assessment of the cytotoxicity of gold nanoparticles. Talanta 101:11–16
- Dwivedi, C., and Paul, S. D. 2013. Nanotechnology to nanotoxicology: A review. J. Sci. Innov. Res. 2:458–470
- Eissa, S., Shawky, S. M., Matboli, M., et al. 2014. Direct detection of unamplified hepatoma upregulated protein RNA in urine using gold nanoparticles for bladder cancer diagnosis. Clin. Biochem. 47:104–110
- Farkas, J., Christian, P., Urrea, J. A., et al. 2010. Effects of silver and gold nanoparticles on rainbow trout (Oncorhynchus mykiss) hepatocytes. Aquat. Toxicol. 96:44–52
- Furuzawa-Carballeda, J., Vargas-Rojas, M. I., and Cabral, A. R. 2007. Autoimmune inflammation from the TH17 perspective. Autoimmun. Rev. 6:169–175
- Geiser, M., Quaile, O., Wenk, A., et al. 2013. Cellular uptake and localization of inhaled gold nanoparticles in lungs of mice with chronic obstructive pulmonary disease. Part. Fibre Toxicol. 10:19–29
- Gerber, H. P., Dixit, V., and Ferrara, N. 1998. Vascular endothelial growth factor induces expression of the anti-apoptotic proteins Bcl-2 and A1 in vascular endothelial cells. J. Biol. Chem. 273:13313–13316
- Ghosh, S. K., and Pal, T. 2007. Interparticle coupling effect on the surface plasmon resonance of gold nanoparticles: From theory to applications. Chem. Rev. 107:4797–4862
- Haiss, W., Thanh, N. T., Aveyard, J., and Fernig, D. G. 2007. Determination of size and concentration of gold nanoparticles from UV-Vis spectra. Anal. Chem. 79:4215–4221
- Hashimoto, M., Toshima, H., Yonezawa, T., et al. 2014. Responses of RAW264.7 macrophages to water-dispersible gold and silver nanoparticles stabilized by metal-carbon σ-bonds. J. Biomed. Mater. Res. 102:1838–1849
- Hussain, M. M., Samir, T. M., and Azzazy, H. M. 2013. Unmodified gold nanoparticles for direct and rapid detection of Mycobacterium tuberculosis complex. Clin. Biochem. 46:633–637
- Ionita, P., Spafiu, F., and Ghica, C. 2008. Dual behavior of gold nanoparticles, as generators and scavengers for free radicals. J. Mater. Sci. 43:6571–6574
- Jans, H., Liu, X., Austin, L., et al. 2009. Dynamic Light Scattering as a powerful tool for gold nanoparticle bioconjugation and biomolecular binding studies. Anal. Chem. 81:9425–9432
- Kang, J. L., Moon, C., Lee, H. S., et al. 2008. Comparison of the biological activity between ultrafine and fine titanium dioxide particles in RAW 264.7 cells associated with oxidative stress. J. Toxicol. Environ. Health 71:478–485
- Kim, T. S., Kang, B. Y., Lee, M. H., et al. 2001. Inhibition of IL-12 production by auranofin, an anti-rheumatic gold compound, deviates CD4+ T-cells from the TH1 to the TH2 pathway. Br. J. Pharmacol. 134:571–578
- Liu, H., Yang, D., Yang, H., et al. 2013a. Comparative study of respiratory tract immune toxicity induced by three sterilization nanoparticles: Silver, zinc oxide and titanium dioxide. J. Haz. Mater. 2013:478–486
- Liu, X. L., Xu, Y. J., Wu, Z. Q., and Chen, H. 2013b. Poly-N-vinylpyrrolidone-modified surfaces for biomedical applications. Macromol. Biosci. 13:147–154
- Liu, Z., Li, W., Wang, F., et al. 2012. Enhancement of lipopolysaccharide-induced NO and IL-6 production by PEGylated gold nanoparticles in RAW264.7 cells. Nanoscale 4:7135–7142
- Madeira, J. M., Gibson, D. L., Kean, W. F., and Klegeris, A. 2012. The biological activity of auranofin: Implications for novel treatment of diseases. Inflammopharmacology 20:297–306
- Murata, Y., Amao, M., Yoneda, J., and Hamuro, J. 2002. Intracellular thiol redox status of macrophages directs the TH1 skewing in thioredoxin transgenic mice during aging. Mol. Immunol. 38:747–757
- Nel, A., Xia, T., Madler, L., and Li, N. 2006. Toxic potential of materials at the nanolevel. Science 311:622–627
- Overocker, J., and Pfau, J. C. 2012. Cytokine production modified by system x(c)- after PM10 and asbestos exposure. J. Young Invest. 23:34–39
- Pfau, J. C., Seib, T., Overocker, J. J., et al. 2012. Functional expression of system x(c)- is up-regulated by asbestos but not crystalline silica in murine macrophages. Inhal. Toxicol. 24:476–485
- Scherbart, A. M., Langer, J., Bushmelev, A., et al. 2011. Contrasting macrophage activation by fine and ultrafine titanium dioxide particles is associated with different uptake mechanisms. Part. Fibre Toxicol. 8:31
- Schreck, R., Albermann, K., and Baeuerle, P. A. 1992. NF-κB: An oxidative stress-responsive transcription factor of eukaryotic cells (a review). Free Rad. Res. Commun. 17:221–237
- Sumbayev, V. V., Yasinska, I. M., Garcia, C. P., et al. 2013. Gold nanoparticles down-regulate IL-1β-induced pro-inflammatory responses. Small 9:472–477
- Suzuki, H., Toyooka, T., and Ibuki, Y. 2007. Simple and easy method to evaluate uptake potential of nanoparticles in mammalian cells using a flow cytometric light scatter analysis. Environ. Sci. Technol. 41:3018–3024
- Thakor, A. S., Jokerst, J., Zavaleta, C., et al. 2011. Gold nano-particles: A revival in precious metal administration to patients. Nano. Lett. 11:4029–4036
- Valles, G., Gonzalez-Melendi, P., Gonzalez-Carrasco, J. L., et al. 2006. Differential inflammatory macrophage response to rutile and titanium particles. Biomaterials 27:5199–5211
- Villiers, C. L., Freitas, H., Couderc, R., et al. 2010. Analysis of the toxicity of gold nanoparticles on the immune system: Effect on dendritic cell functions. J. Nanopart. Res. 12:55–60
- Voorhees, P. W. 1984. The theory of Ostwald ripening. J. Stat. Phys. 38:231–252
- Zebedeo, C. N., Davis, C., Peña, C., et al. 2014. Erionite induces production of autoantibodies and IL-17 in C57BL/6 mice. Toxicol. Appl. Pharmacol. 275:257–264
- Zhang, Z., Berg, A., Levanon, H., et al. 2003. On the interactions of free radicals with gold nanoparticles. J. Amer. Chem. Soc. 125:7959–7963