
Abstract
An important component of safety assessment of new pharmaceuticals is evaluation of their potential to increase the risk of developing cancer in humans. The traditional 2-year rodent bioassay often is not feasible or scientifically applicable for evaluation of biotherapeutics. Additionally, it has poor predictive value for non-genotoxic immunosuppressive compounds. Thus, there is a need for alternative testing strategies. A novel 3-stage tumor model in syngeneic C3H/HeN mice was evaluated here to study the effects of immunosuppressive drugs on tumor promotion and progression in vivo. The model employed a skin squamous cell carcinoma cell line (SCC VII) due to the increased prevalence of squamous cell carcinoma (SCC) in humans associated with immunosuppression after transplants. Local invasion, colonization and tumor progression were evaluated. The validation set of immunosuppressive drugs included: Cyclosporin (CSA), cyclophosphamide (CTX), azathioprine, etanercept, abatacept and prednisone. Local invasion was evaluated by histological assessment as well as fluorescence trafficking from Qdot®-labeled tumor cells from the site of inoculation to the draining lymph node. Colonization was evaluated by lung colony counts following intravenous inoculation. Tumor progression was assessed by morphometric analysis of lesion area, angiogenesis and growth fraction of established metastatic neoplasia. Immunosuppressive drugs in the validation set yielded mixed results, including decreased progression. The methods and results described herein using an in vivo syngeneic mouse tumor model can provide insight about the assessment of immunosuppressive drugs in carcinogenicity risk assessment.
Introduction
Since pioneering work in the 1950s (Hume et al., Citation1955), the use of immunosuppressive drugs in transplantation has dramatically grown. More recently, an increased number of patients have been exposed to immunosuppressive agents as they have been used for therapy of auto-immune diseases such as rheumatoid arthritis (RA) (Kurki, Citation1992), systemic lupus erythematosus (SLE) (Dooley & Ginzler, Citation2006) and psoriasis (Weischer et al., Citation2007).
Therapeutic drugs suppressing the immune system inherently increase the risk of infections to a greater or lesser extent based upon their mechanism of action. Labels of most marketed immunosuppressive drugs carry a warning concerning infectious diseases (Bugelski et al., Citation2010). Advances in the understanding of the role of immunosurveillance in neoplasia (Schreiber et al., Citation2011) and clinical experience with immunosuppressive agents has resulted in increased concern that this class of drug may increase the risk of neoplasia (Vial & Descotes, Citation2003). However, as reviewed by Bugelski et al. (Citation2010), only six of 13 immunosuppressive agents tested in 2-year bioassays in rats, mice or both were reported positive; of those, four were known mutagens.
Carcinogenesis can be conceptualized in three stages; initiation, promotion and progression (Hernandez et al., Citation2009). The murine squamous cell carcinoma cell line (SCC VII) is a squamous cell carcinoma (SCC) of low immunogenicity that spontaneously arose from the C3H/HeN mouse and is used as a model for human oral SCC (Wong et al., Citation2004). When injected intramuscularly (IM), SCC VII cells can form primary tumors at the injection site and metastasize to the draining lymph node (O’Malley et al., Citation1997). When injected intravenously (IV), SCC VII cells can form experimental metastases in the lung (Khurana et al., Citation2001).
In this work, a 3-stage model was used to assess the effect of known immunosuppressive agents on tumor promotion and progression with SCC VII cells. Inoculation with syngeneic tumor cells immediately establishes a tumor, thereby eliminating the initiation stage. The three stages evaluated in this model were local invasion, colonization and tumor progression. Local invasion was evaluated by histological assessment as well as fluorescence trafficking from Qdot®-labeled tumor cells from site of inoculation to the draining lymph node. Colonization was evaluated by lung colony counts following intravenous inoculation. Tumor progression was assessed by morphometric analysis of lesion area, angiogenesis and growth fraction of established metastatic neoplasia.
A panel of immunosuppressive drugs with different mechanisms of action was used to evaluate this model: cyclosporin (CSA), cyclophosphamide (CTX), azathioprine, etanercept, abatacept and prednisone. CSA, an immunosuppressive drug used in organ transplant, interferes with T-cell activation via binding to cyclophilin. CTX, used for treatment of cancer and autoimmune diseases, is an alkylating agent that interferes with B- and T-cell replication via DNA binding. Azathioprine, used for organ transplantation and autoimmune disease, is a purine analog and inhibits an enzyme required for DNA synthesis – targeting T- and B-cells. Etenercept, used to treat autoimmune diseases, is a fusion protein of the Fc portion of IgG1 and the tumor necrosis factor (TNF) receptor and functions via inhibition of TNF. Abatacept, used to treat RA, is a fusion protein of the Fc portion of IgG1 and the extracellular domain of CTLA-4 and inhibits T-cell activation via inhibition of CD80/CD86 signaling. Prednisone is a corticosteroid used to treat inflammatory disease; immune suppression is a well-described side effect of its use.
Effects of the various immunosuppressive compounds on the model were mixed and did not result in conclusive demonstration of increased neoplasia resulting from immunosuppression. The syngeneic SCC VII tumor model provided some insight into immunosuppression and immunosurveillance of SCC, but does not fulfil requirements for regulatory risk assessment.
Materials and methods
Cell culture
RPMI 1640 with L-glutamine, penicillin/streptomycin stock solution, sodium pyruvate and trypsin-versene (EDTA) were purchased from Lonza Walkersville, Inc. (Walkersville, MD). Fetal Bovine Serum (FBS) was purchased from Thermo Fisher Scientific (Waltham, MA). Hank's Balanced Salt Solution (HBSS) was purchased from Mediatech Inc. (Manassas, VA). CellTiter-Glo® Luminescent cell viability assay was purchased from Promega (Madison, WI).
Cell labeling
Qtracker® 655 cell labeling kit was purchased from Invitrogen (Carlsbad, CA). The stock concentration was 2 µM. Qdots® were reported by the supplier to be endotoxin-free.
Immunohistochemistry (IHC)
Polyclonal rabbit anti-cow cytokeratin wide-spectrum screening (WSS) antibody was purchased from Dako North America (Carpentera, CA). Biotinylated goat anti-rabbit IgG was purchased from Vector Laboratories (Burlingame, CA). Anti-von Willibrand Factor (vWF) was purchased from Millipore (Billerica, MA). The BrdU In-Situ Detection Kit was bought from Biosciences Pharmingen (San Diego, CA).
Immunosuppressive agents
CTX (Baxter, Deerfield, IL) in 500 mg vials was re-constituted with 25 ml diluent for injection to a concentration of 20 mg/ml (colonization) and further diluted with saline to a working concentration of 4 mg/ml (invasion and progression). Stocks were re-constituted once weekly, stored at 2–8 °C and protected from light. Azathioprine (Ben Venue Labs, Bedford, OH) in 100 mg vials was re-constituted with sterile water to a concentration of 10 mg/ml (colonization) and further diluted with saline to a working concentration of 5 mg/ml (invasion and progression). Stocks were re-constituted daily, stored at room temperature (15–25 °C) and protected from light. Etanercept (Enbrel®; Amgen, Thousand Oaks, CA) in 25 mg vials was re-constituted with 1 ml of diluent for injection to a concentration of 25 mg/ml and further diluted with saline to a working concentration of 12.5 mg/ml (colonization) or 2 mg/ml (invasion and progression). Stocks were re-constituted every other week, stored at 2–8 °C and protected from light. Prednisone (Sigma, St. Louis, MO) was supplied at a stock concentration of 20 mg/ml and further diluted with saline to a working concentration of 2 mg/ml (invasion and progression) or 1 mg/ml (colonization). Stocks were re-constituted daily, stored at room temperature (15–25 °C) and protected from light. Abatacept (Orencia® Injection; Bristol-Myers Squibb, New York, NY) in 250 mg vials was re-constituted with 10 ml sterile water for injection to a concentration of 25 mg/ml (colonization) and further diluted with saline to a working concentration of 4 mg/ml (invasion and progression). Stocks were re-constituted daily, stored at 2–8 °C and protected from light.
SCC VII cells
SCC VII cells were a gift from Dr R. Wong (Head and Neck Division, Department of Surgery, Memorial Sloan-Kettering Cancer Center, New York, NY) (Wong et al. Citation2001). The cell line was banked and cultured under standard conditions using RPMI 1640, 10% FBS, 2 mM glutamine, 1 mM sodium pyruvate and 1% penicillin/streptomycin. Cells were incubated at 37 °C, in a 5% CO2/95% air system and passaged when they reached ≈70% confluency. A fresh aliquot of cells was drawn from the cell bank after 10 passes.
Mice
C3H/HeN mice (female, 8–10-weeks-of-age) were obtained from Harlan Labs (Dublin, VA). On arrival, the mice were group housed in static micro-isolator caging at Janssen R&D (Radnor, PA) on autoclaved ALPHA-Dri™ Laboratory Animal Bedding in a specific-pathogen-free facility with a 12-h light cycle and maintained at 18–26 °C and with 30–70% relative humidity. All mice had ad libitum access to water (acidified with HCl to a pH of 2.5–3.0, then autoclaved) and LabDiet™ Laboratory Autoclavable Rodent Diet 5010 consisting of 23.0% crude protein, 4.5% crude fat and 6.0% crude fiber and housed. Janssen complies with the recommendations of the Guide for Care and Use of Laboratory Animals with respect to restraint, husbandry, surgical procedures, feed and fluid regulation and veterinary care. The animal care and use programs at Janssen are accredited by AAALAC, which assures compliance with accepted standards for the care and use of laboratory animals.
Preparation of cells
SCC VII cells were prepared for injection when they reached ≈70% confluency by rinsing once with complete media and then twice with HBSS followed by trypsinization with trypsin-versene for 2–3 min. Cell suspensions were washed three times with complete media and then re-suspended in HBSS. To select an optimal cell dose, dose–response experiments were conducted for each of the three models (data not shown).
In vitro cytotoxicty
SCC VII cells were plated into 96-well plates at 2000 cells/well and incubated at 37 °C for 24 h. On Day 2, decreasing half-logarithmic concentrations of CTX (range = 10−3–10−7.5 M), prednisone (range = 10−3–10−7.5 M), azathioprine (range = 10−3–10−7.5 M), etanercept (range = 10−5–10−9.5 M) or abatacept (range = 10−4–10−8.5 M) were added to the wells and the plates incubated at 37 °C for 24 h. Wells containing cells only and media only were also included as controls. On Day 3, CellTiter-Glo® reagent was prepared fresh according to manufacturer protocol and 80 µl added to each well. The luminescence signal was then quantitated using a VICTOR 1420 multi-label plate reader (PerkinElmer, Waltham, MA) to determine presence of adenosine triphosphate (ATP).
Model of local growth and metastases (invasion)
As described in Egenolf et al. (Citation2011), the invasion model measures the growth of the primary tumor, fluorescence traffic of Qdots® from the primary tumor to the sentinel lymph node and histological assessment of the lymph node for metastasis and growth of SCC VII cells following IM injection.
Labeling of SCC VII cells
Prior to injection, SCC VII cells were labeled with 10 nM Qtracker® 655 cell loading solution according to manufacturer protocols. In brief, the loading solution was prepared by mixing 1 μl Qtracker® reagent A + 1 μl Qtracker® reagent B for every 0.2 ml of media. The two components were incubated at room temperature for 5 min, complete media was added and the solution was vortexed for 30 s. The existing media was removed from the cells and the loading solution added to the flask when cells were at ≈50% confluency. The flask was then incubated at 37 °C (in 5% CO2/95% air) for ≈24 h.
Tumor cell injection
On Day 5 of the study (see for complete experimental design), all mice received 106 SCC VII cells (in 50 µl HBSS) by IM injection into the left gastrocnemius muscle. The mice were observed once daily for overt signs of metastasis and clinical signs recorded.
Table 1. Experimental design.
Drug administration
Starting on Day 1 of the study, mice were dosed with saline, azathioprine, etanercept, CTX, abatacept or prednisone. Dosing continued every 2–3 days for the duration of the study. All antibody injections were weight-adjusted and injected subcutaneously (SC) in a volume of 5 ml/kg. Body weights were monitored and recorded at each dosing timepoint.
Measurement of local tumor growth
Tumor size in the left gastrocnemius muscle of each mouse was measured using an Absolute Solar Digimatic Caliper (Mitutoyo America Corporation, Aurora, IL). Local growth of the primary tumors was measured by obtaining twice-weekly caliper measures in millimeters (mm) of the width of the left gastrocnemius muscle. Ellipsoid volume was calculated as [4π/3] × [radius1 × radius2 × radius3], where radius1 = ½ raw value of width from side to side, radius2 = ½ raw value of width from front to back and radius3 = ½ the length of tibia.
Imaging and analysis of 655 Qdots® in popliteal lymph nodes
On Day 24 of the study, all mice were euthanized by an overdose injection of sodium pentobarbital and the popliteal lymph nodes and the primary tumors were removed and fixed in 10% neutral buffered formalin (NBF). From the lymph nodes, fluorescence intensity was then calculated (as mean intensity × area). For these measures, individual lymph nodes were transferred into wells of a sterile clear-bottom 96-well plate and 100 µl of 10% NBF was added to each well. Digital images of each well were then taken using a Nikon Eclipse Ti microscope fitted with a 4 × objective, a 0.7 × reduction lens and a customized Qdot® 655 fluorescence cube (Nikon, Melville, NY). All images were captured using Nikon Elements Software, a CoolSNAP EZ monochrome camera and a 500 ms exposure. Each image was individually analyzed in Nikon Elements Software and the fluorescence intensity for each lymph node calculated.
Histology
The same samples used in the Qdot® imaging and analysis were used for histology. The primary tumors and lymph nodes were processed for paraffin sections following fixation using routine methods on an ATP1™ (Triangle Biomedical Sciences, Inc., Durham, NC) system, embedded in paraffin TEC™ (Triangle Biomedical Sciences, Inc.), sectioned on Microm HM355S microtome (Richard-Allan Scientific®, Kalamazoo, MI) and, finally, stained with hematoxylin and eosin (H&E) on a Tissue Tek DRS™ system (Sakura, Torrance, CA).
Immunohistochemistry
All IHC staining was performed on a i6000™ automated stainer (Biogenex Laboratories, Inc., San Ramon, CA). Lymph node sections for IHC staining were deparaffinized and re-hydrated following standard protocols. To stain cells expressing cytokeratins, sections of primary SCC VII tumors and popliteal lymph nodes were subjected to heat-induced epitope retrieval (HIER) in antigen retrieval Citra Solution (BioGenex, San Ramon, CA) by microwave irradiation. Non-specific binding of proteins was blocked with normal goat serum (BioGenex) and tissue sections were incubated with polyclonal rabbit anti-cow cytokeratin WSS at a manufacturer recommended 0.01 µg/ml dilution for 2 h. Any edogenous peroxidase activity was quenched by treatment of the samples with Peroxide Block (BioGenex). Signal amplification was then done using biotinylated goat anti-rabbit IgG (H + L) at a manufacturer recommended 3 µg/ml dilution for 30 min. Cells expressing cytokeratins were ultimately detected with peroxidase-conjugated streptavidin, visualized with 3,3’diaminobenzidine tetrahydrochloride (DAB) reagent and then counterstained with Mayer’s Hematoxylin (all BioGenex).
Model of colonization (colonization)
The colonization model enumerates the number of experimental metastases that arise on the surface of the lung following IV injection of SCC VII cells.
Tumor cell injection
On Day 5 of the study (see for complete experimental design), all mice received an IV injection of 3 × 10⁵ SCC VII cells (in 0.2 ml HBSS) into the tail vein. The mice were observed once daily for overt signs of metastasis and clinical signs were recorded.
Drug administration
Mice were dosed with saline, azathioprine, etanercept, CTX, abatacept or prednisone on Days 1 and 3 of the study. All antibody injections were weight-adjusted and injected SC in a volume of 10 ml/kg.
Colony counts
On Day 24 of the study, all mice were euthanized by an overdose injection of sodium pentobarbital. At necropsy, the lungs were removed en bloc and then inflated with – and immersion fixed in – 10% NBF. Lungs were macroscopically evaluated for evidence of metastasis using a dissecting microscope (2 × magnification). Visible SCC VII tumor colonies on the surface of each lung were manually counted. A value of 200 colonies was considered “too numerous to count” (TNC). For specimens graded as TNC, lungs were ranked for relative abundance of tumor burden that was macroscopically visible.
Model of progression (progression)
The progression model evaluates the progression of established lung metastases by quantifying the growth fraction and angiogenesis of these metastases following the IV injection of the SCC VII cells.
Tumor cell injection
On Day 1 of the study (see for the complete experimental design), all mice received an IV injection of 3 × 10⁵ SCC VII cells (in volume of 0.2 ml HBSS) via the tail vein. Mice were observed once daily for overt signs of metastasis and clinical signs were recorded.
Drug administration
Mice were dosed with saline, azathioprine, etanercept, CTX, abatacept or prednisone on Days 7, 10, 14, 17, 21 and 23 after SCC VII cell injection. All antibody injections were weight-adjusted and injected SC in a volume of 5 ml/kg.
Tissue samples and termination of study
On Day 23 after SCC VII cell injection, all mice were dosed with BrdU at 40 mg/kg (1 mg/ml) via intraperitoneal injection (IP). On Day 24, all mice were euthanized by an overdose injection of sodium pentobarbital and the lungs were removed, inflated with 10% NBF and immersed in 10% NBF.
Histology
All tissues were processed for paraffin sections using routine methods on the ATP1™ system, embedded in paraffin TEC™, sectioned on the Microm HM355S microtome and stained with H&E on the Tissue Tek DRS™ system.
Immunohistochemistry
All IHC staining was performed on the i6000™ automated stainer. Tissue sections for IHC staining were deparaffinized and rehydrated following standard protocols. To stain cells expressing vWF, sections of lung were subjected to protease induced epitope retrieval by incubating with proteinase K for 25 min at room temperature. Non-specific binding of proteins was blocked with normal goat serum. Sections were incubated with rabbit anti-vWF (4 µg/ml) for 1 h at room temperature. Endogenous peroxidase activity was quenched as above, followed by amplification with biotinylated goat anti-rabbit IgG (H + L) (at recommended 3 µg/ml dilution) for 30 min. Cells expressing vWF were detected using peroxidase conjugated streptavidin, visualized by DAB and counterstained with Mayer’s Hematoxylin. To stain for cellular incorporation of BrdU, sections of lung were stained using a BrdU In-Situ Detection Kit, according to manufacturer directions.
Morphometry
Six lesions per animal (72 lesions per group) were captured using a Nikon Eclipse E800 microscope fitted with a 4 × objective and a 0.63 × reduction lens (Nikon). An Evolution™ MP color camera (Media Cybernetics, Inc., Bethesda, MD) and associated Image-Pro Plus V 5.1 software was used to perform the morphometric analysis on the collected images. Measurements acquired from lesions included: area (vWF stained lungs), growth fraction (BrdU-stained lungs) and tumor vasculature (vWF-stained lungs). All data generated from Image-Pro Plus was imported into Microsoft Excel software (Microsoft Corporation, Redmond, VA). Microsoft Excel and Prism 6 (GraphPad Software, La Jolla, CA) were then used to analyze and graph the raw data. Custom macros were designed in Image-Pro Plus to perform each measure consistently.
Data analysis and statistics
Data was exported into Microsoft Excel for data analyses and Prism 6 was used for graphical and statistical analyses. For primary tumor volume data, a repeated-measures analysis of variance (ANOVA) was used to assess the effect of time, treatment and time × treatment interaction. A Dunnett’s test was used to control for multiple comparisons, for the comparison of each treatment to control, at each timepoint. For all other data, a 1-way ANOVA was used to compare groups and the Dunnett’s test was used to adjust for multiple comparisons versus control. If assumptions of test were violated, the Kruskal-Wallis (non-parametric) test was used. When Kruskal-Wallis was used, a Dunn’s test was used to adjust for multiple comparisons versus control. Although some graphs depict multiple experiments, treatment groups were always compared to their respective control. A p value < 0.05 was considered statistically significant.
Results
Test drug toxicity toward SCC VII cells in vitro
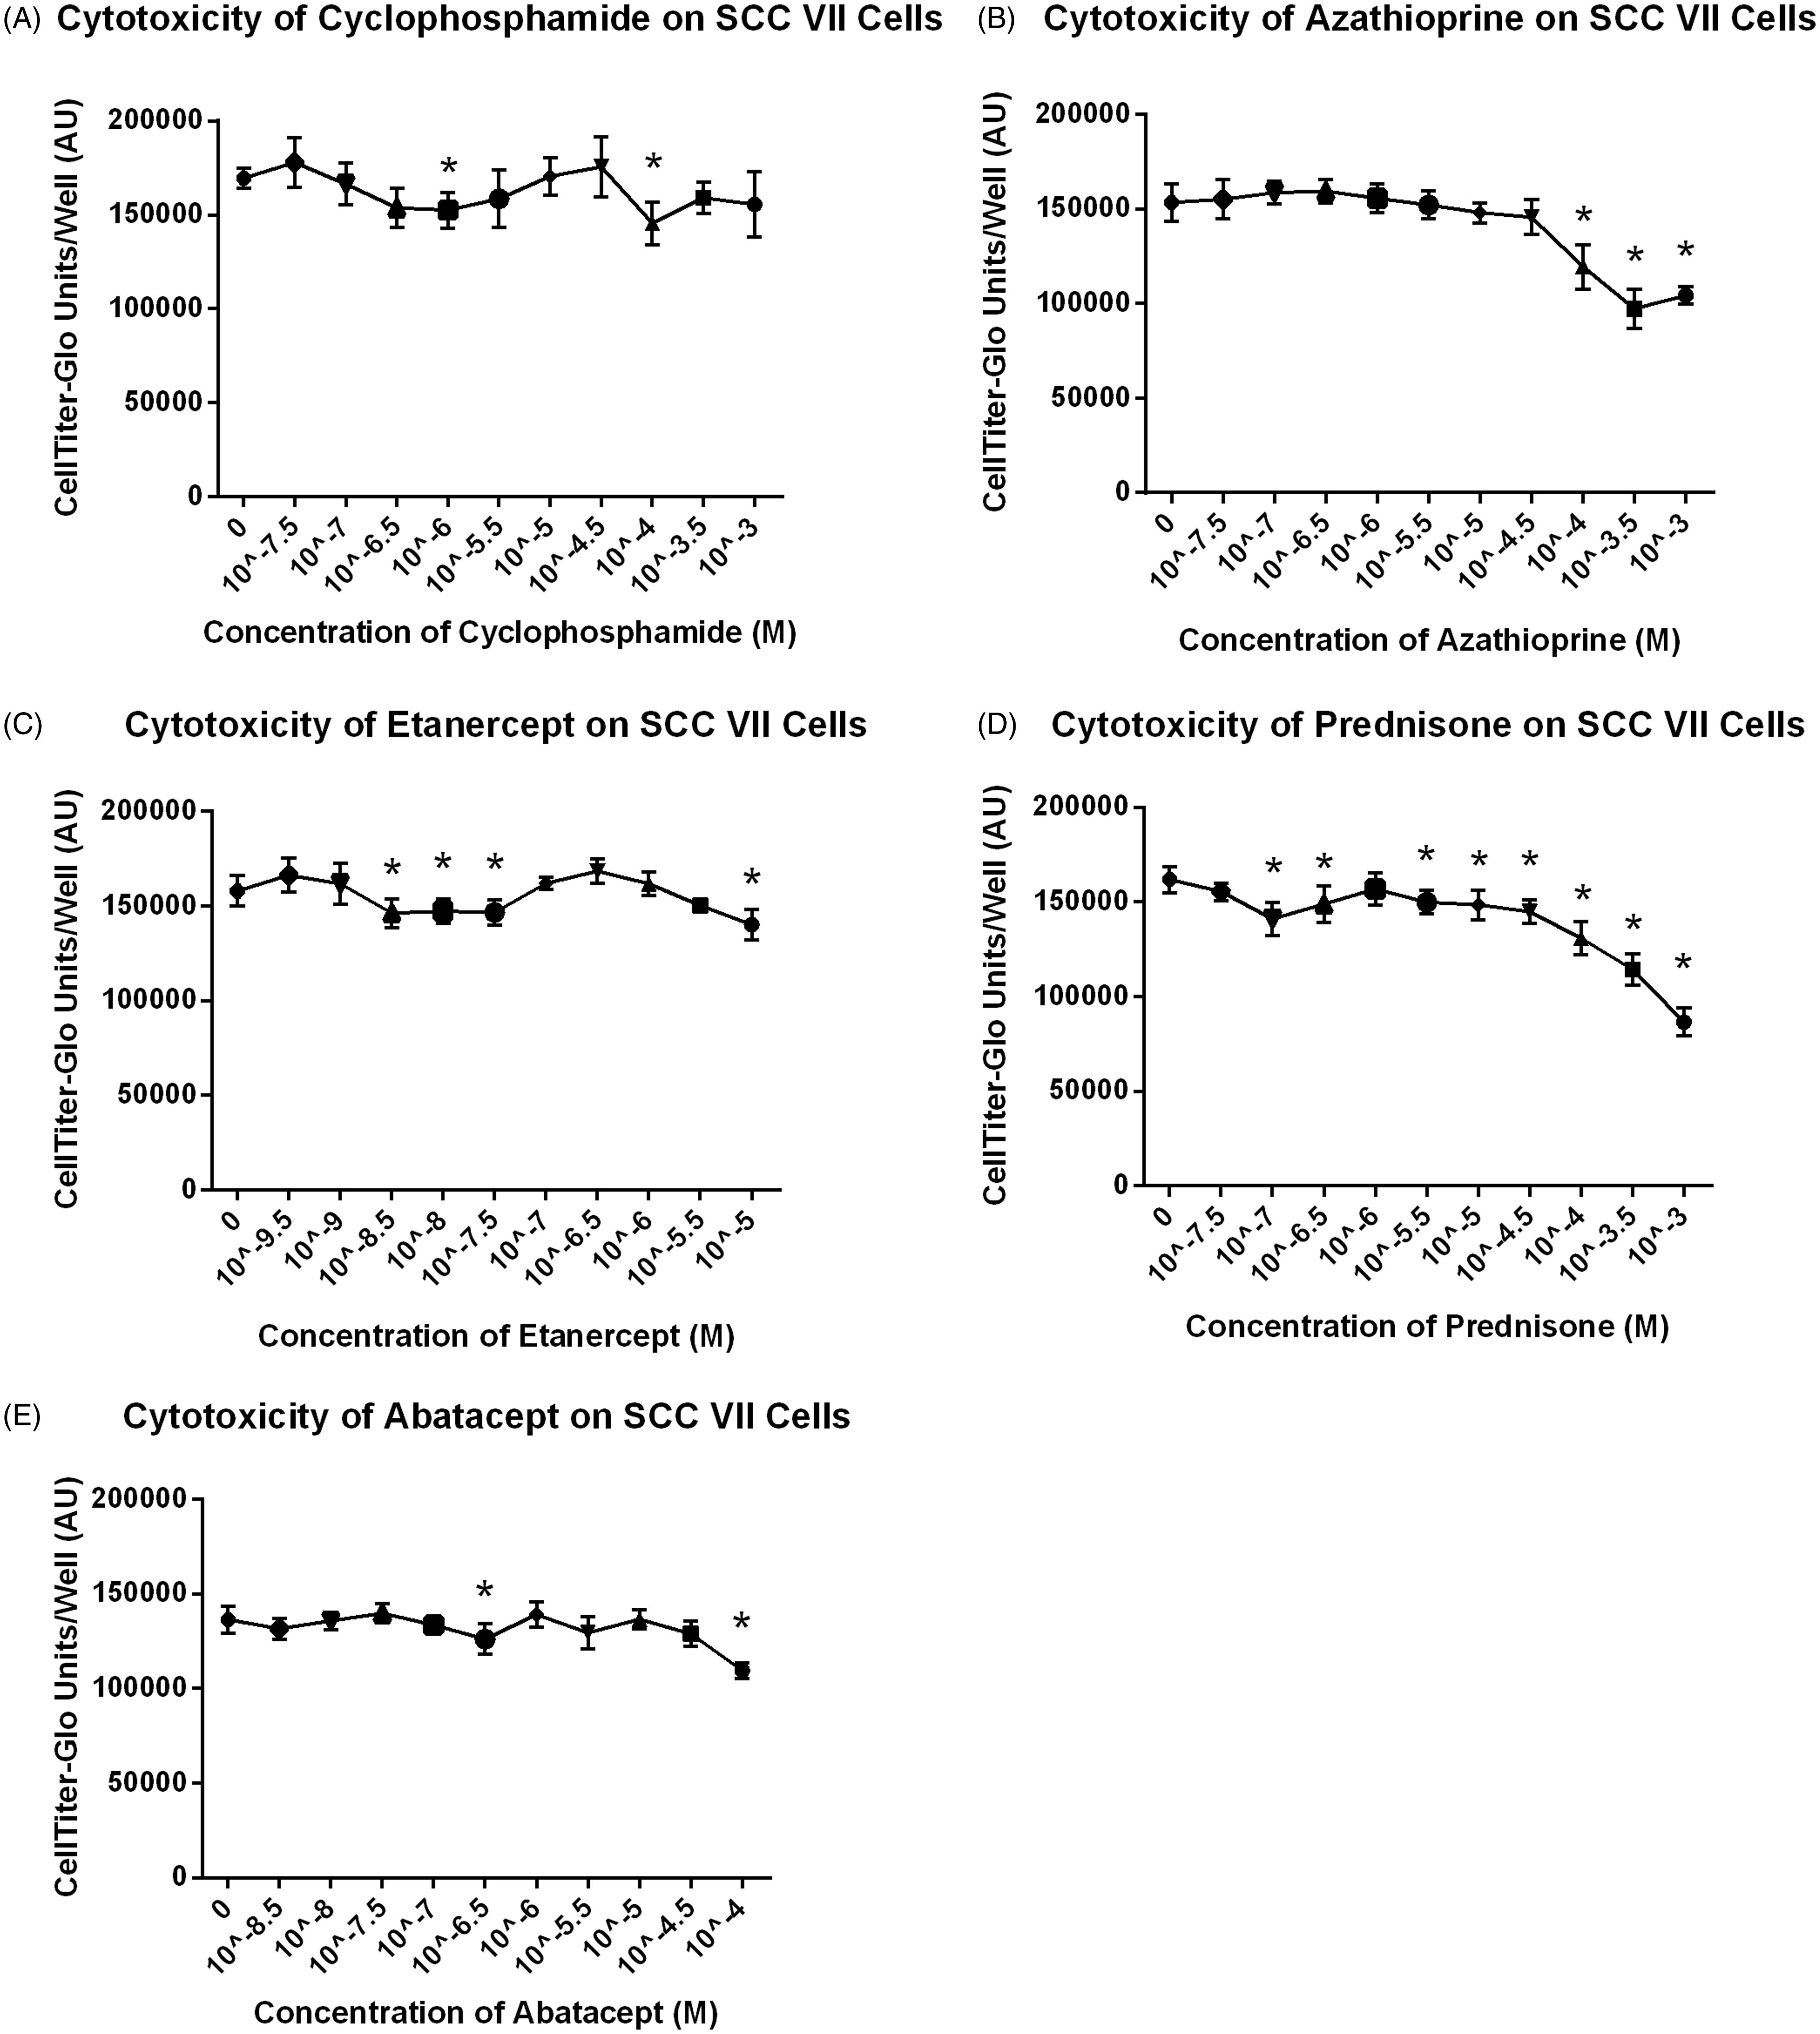
To determine if azathioprine, etanercept, abatacept, prednisone or CTX had a direct effect on the growth of SCC VII cells, SCC VII cells were incubated with varying concentrations of each drug for 24 h. All drugs showed significant effects on the growth of SCC VII cells in vitro at various concentrations (). Dose-related effects were observed with azathioprine and prednisone.
Figure 1. Drug effects on SCC VII cells in vitro. Azathioprine and Prednisone show dose responsive effects on SCC VII cells in vitro at high concentrations. Data shown are mean ± SD. * Cell count was significantly less than control (p < 0.05).
Effect of test drugs on local growth and metastases
Experiments were conducted to assess local growth of primary tumor, fluorescence traffic of Qdots® and SCC VII tumor cell metastasis to the popliteal lymph node. Assessments included meaures of tumor volume at the injection site, fluorescence intensity within popliteal lymph nodes (re: Qdot® trafficking) and histological assessment of primary tumor and popliteal lymph nodes (cytokeratin staining to confirm metastasis).
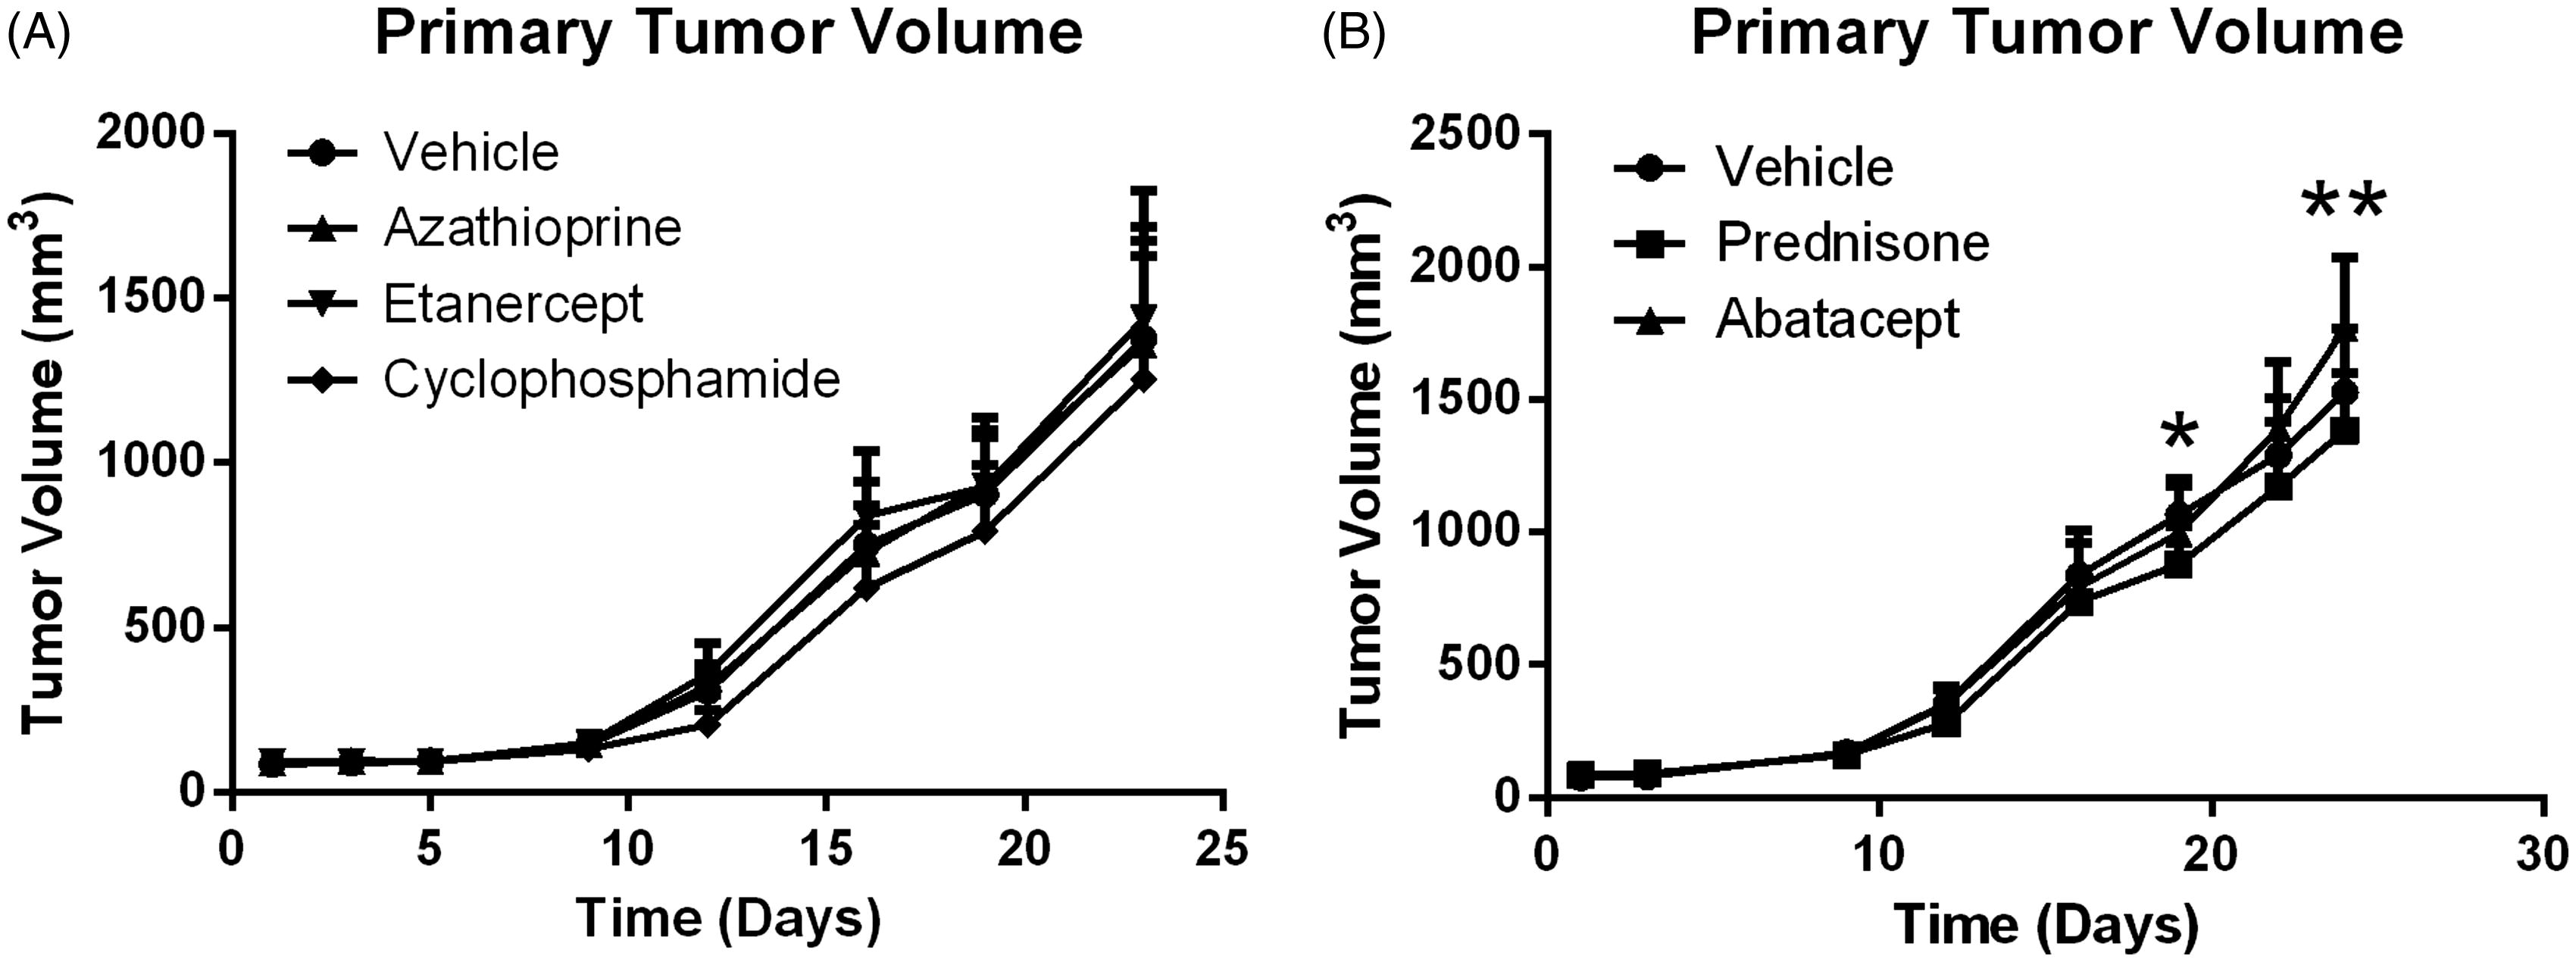
To determine if there was a difference in growth kinetics between primary tumor growth in mice that were treated versus those in mice that were untreated, tumor volumes were measured throughout the study. The mean tumor volumes shown in illustrate that the primary tumor volume increased over time with all treatments. On Days 19 and 24 of the study, the size in hosts that received prednisone was statistically less than that in control mice. On Day 24, tumor size in mice that had received abatacept was statistically greater than that in control hosts.
Figure 2. Primary tumor volume increases over time with and without treatment. Data shown are mean ± SD. *At Day 19, Prednisone is significantly less than vehicle control (p < 0.05); n = 12/group. **At Day 24, Prednisone is statistically less than vehicle control and Abatacept is significantly greater than control (p < 0.05); n = 12/group.
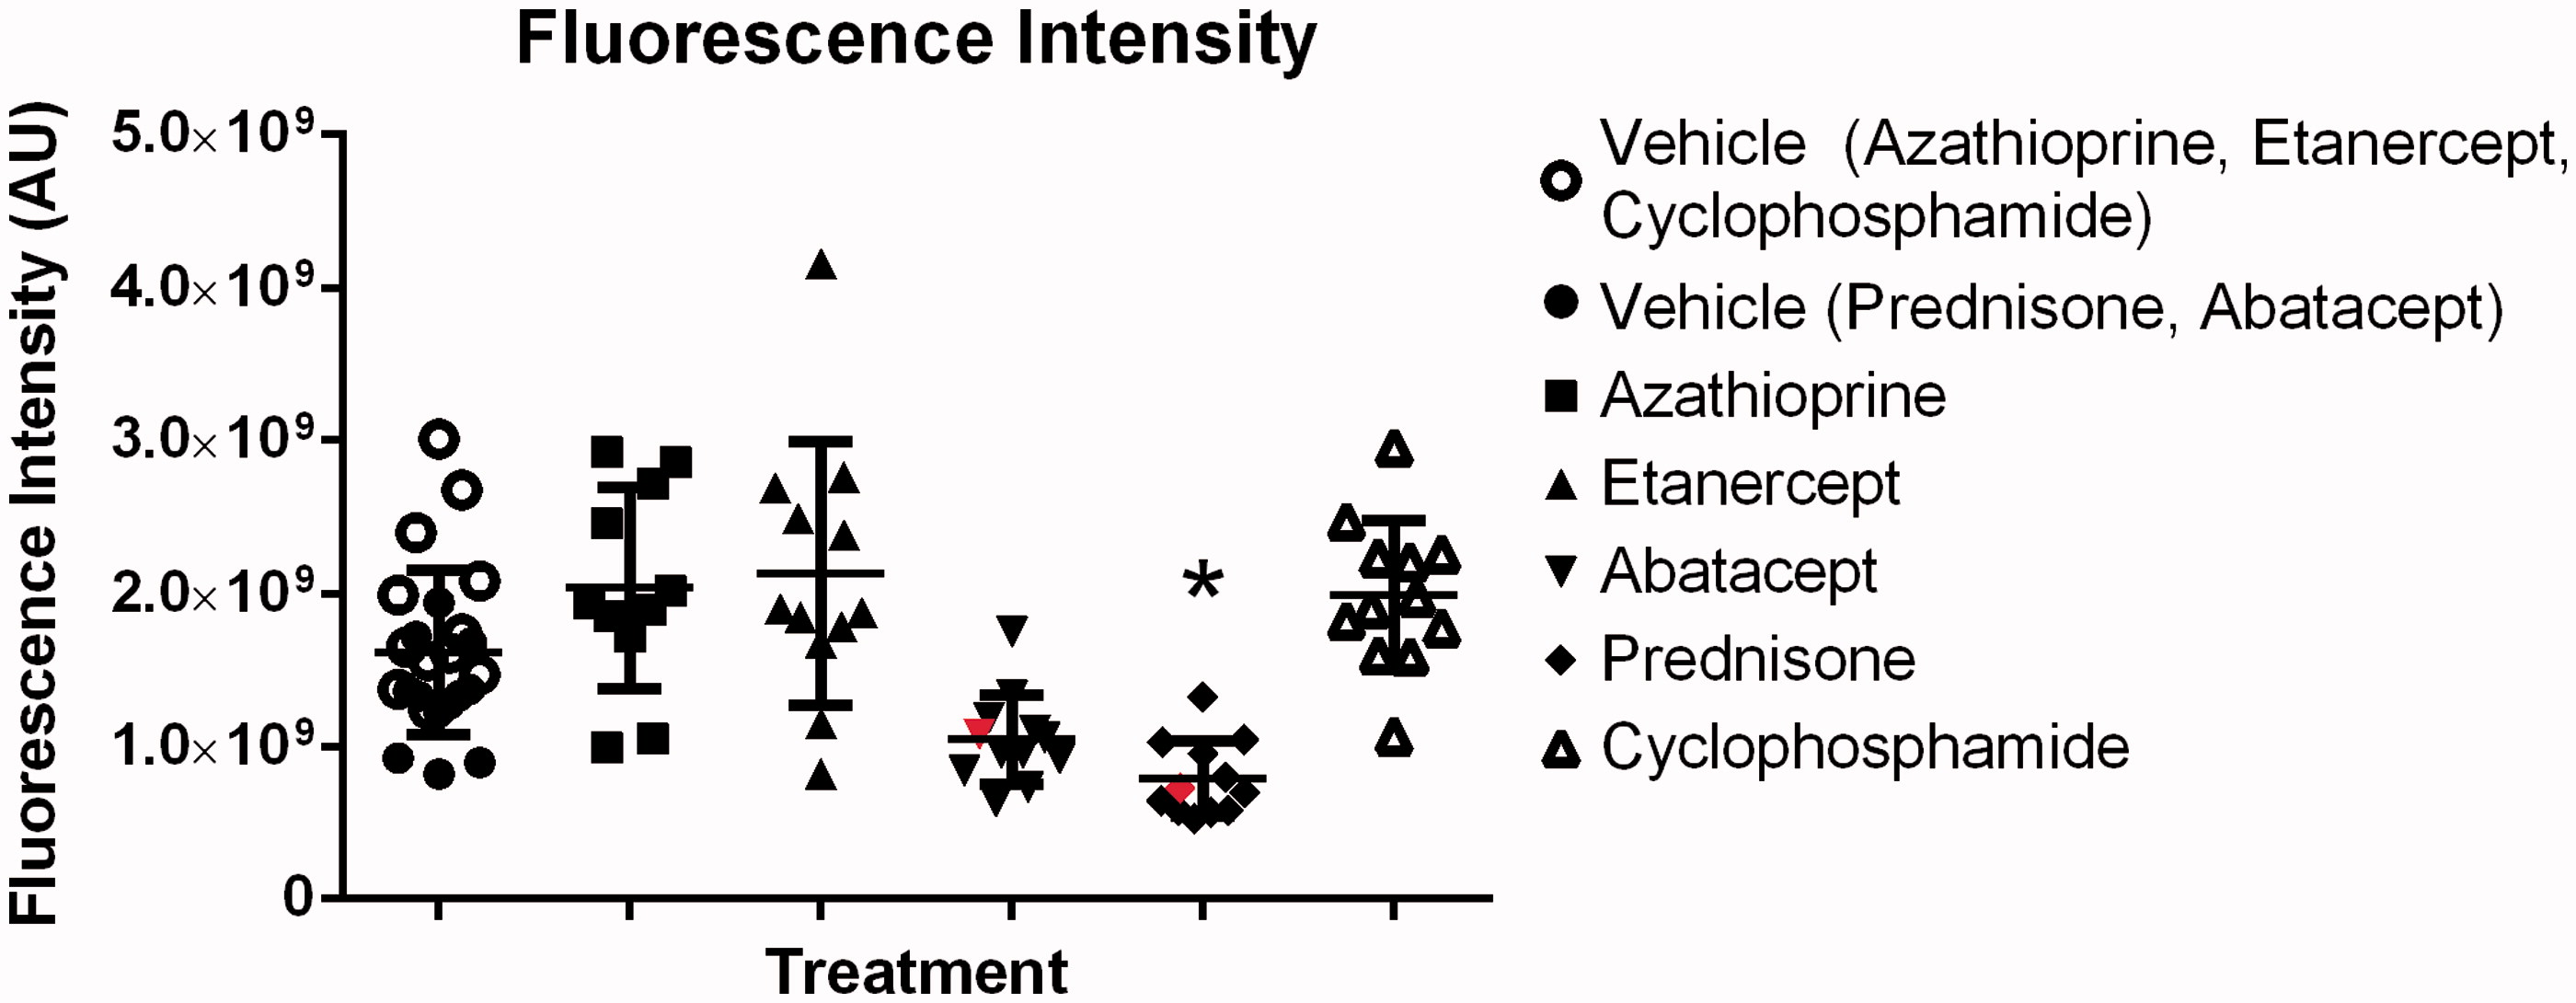
To measure the traffic of 655 Qdots® to the draining lymph nodes, the fluorescence intensity of the left lymph node was measured on Day 24 of the study. Treatment of SCC VII tumor-bearing mice with abatacept or prednisone resulted in a reduction of fluorescent intensity in the popliteal lymph node (versus levels noted in samples from saline control hosts; ). However, a significant effect in Qdot® traffic was observed only with prednisone. In addition, only two lymph nodes – one from the abatacept-treated group and one from the prednisone-treated group – were histologically positive for metastasis and growth of the SCC VII tumor cells. These positive lymph nodes are displayed in (in red).
Figure 3. Fluorescence traffic to popliteal lymph node. Abatacept and Prednisone decrease fluorescence traffic to the popliteal lymph nodes, while Azathioprine, Etanercept and CTX have no effect on traffic. Line at mean ± SD is shown. *Significantly less than vehicle control (p < 0.05); n = 12/group. Treatment group always compared to respective control. Red lymph nodes are positive for growth (histological assessment).
Effect of test drugs on colonization
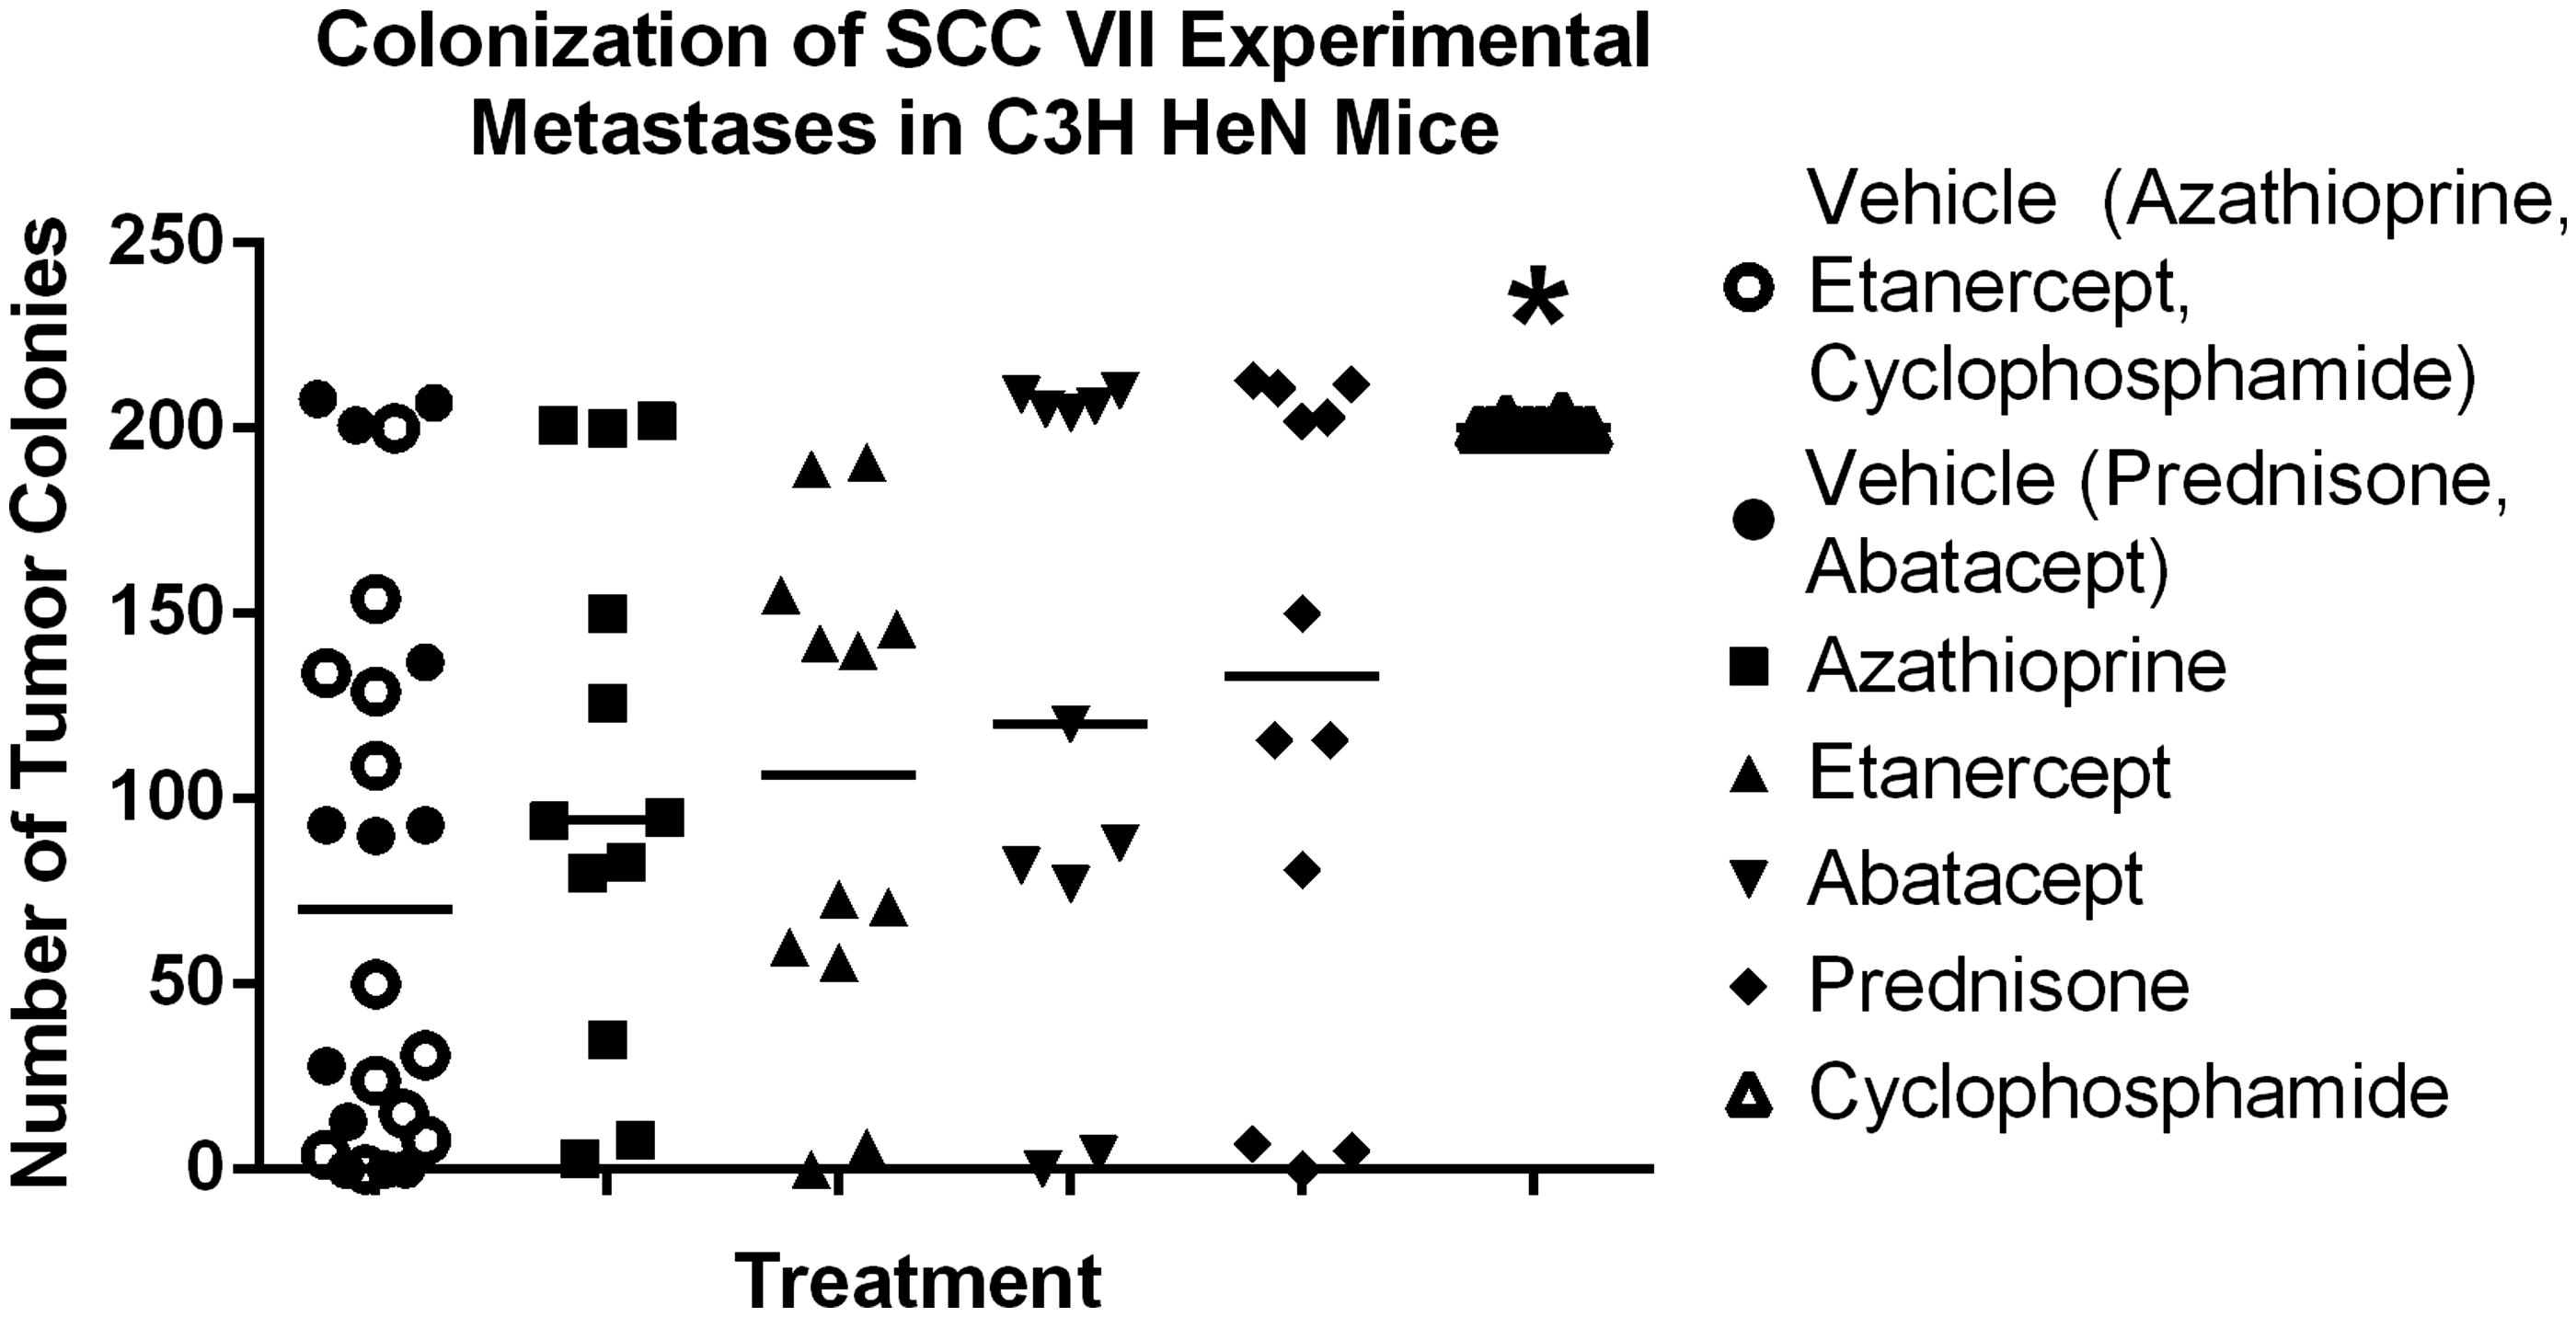
Mice were dosed SC with prednisone (10 mg/kg), abatacept (20 mg/kg), azathioprine (25 mg/kg), etanercept (10 mg/kg), CTX (20 mg/kg) or saline on Days 1 and 3 of the study. On Day 5, these mice were then injected IV in the tail vein with 3 × 10⁵ SCC VII cells. As shown in , pre-treatment with CTX caused a statistically significant (p < 0.05) increase in experimental metastases of the SCC VII cells to the lungs compared to that seen in vehicle control mice.
Figure 4. Experimental metastases. CTX increases experimental metastases. Line at median. *Significantly less than vehicle control (p < 0.05); n = 12/group. Treatment group always compared back to respective control.
Effect of test drugs on progression
Mice were IV injected in the tail vein (on Day 1) with 3 × 10⁵ SCC VII cells and subsequently treated on Days 7, 10, 14, 17, 21 and 23 after SCC VII cell injection with prednisone (10 mg/kg), abatacept (20 mg/kg), azathioprine (25 mg/kg), etanercept (10 mg/kg), CTX (20 mg/kg), or saline. This timeline allowed for pulmonary metastases to be established within the first 7 days post-SCC VII cell injection prior to initiation of the drug treatments.
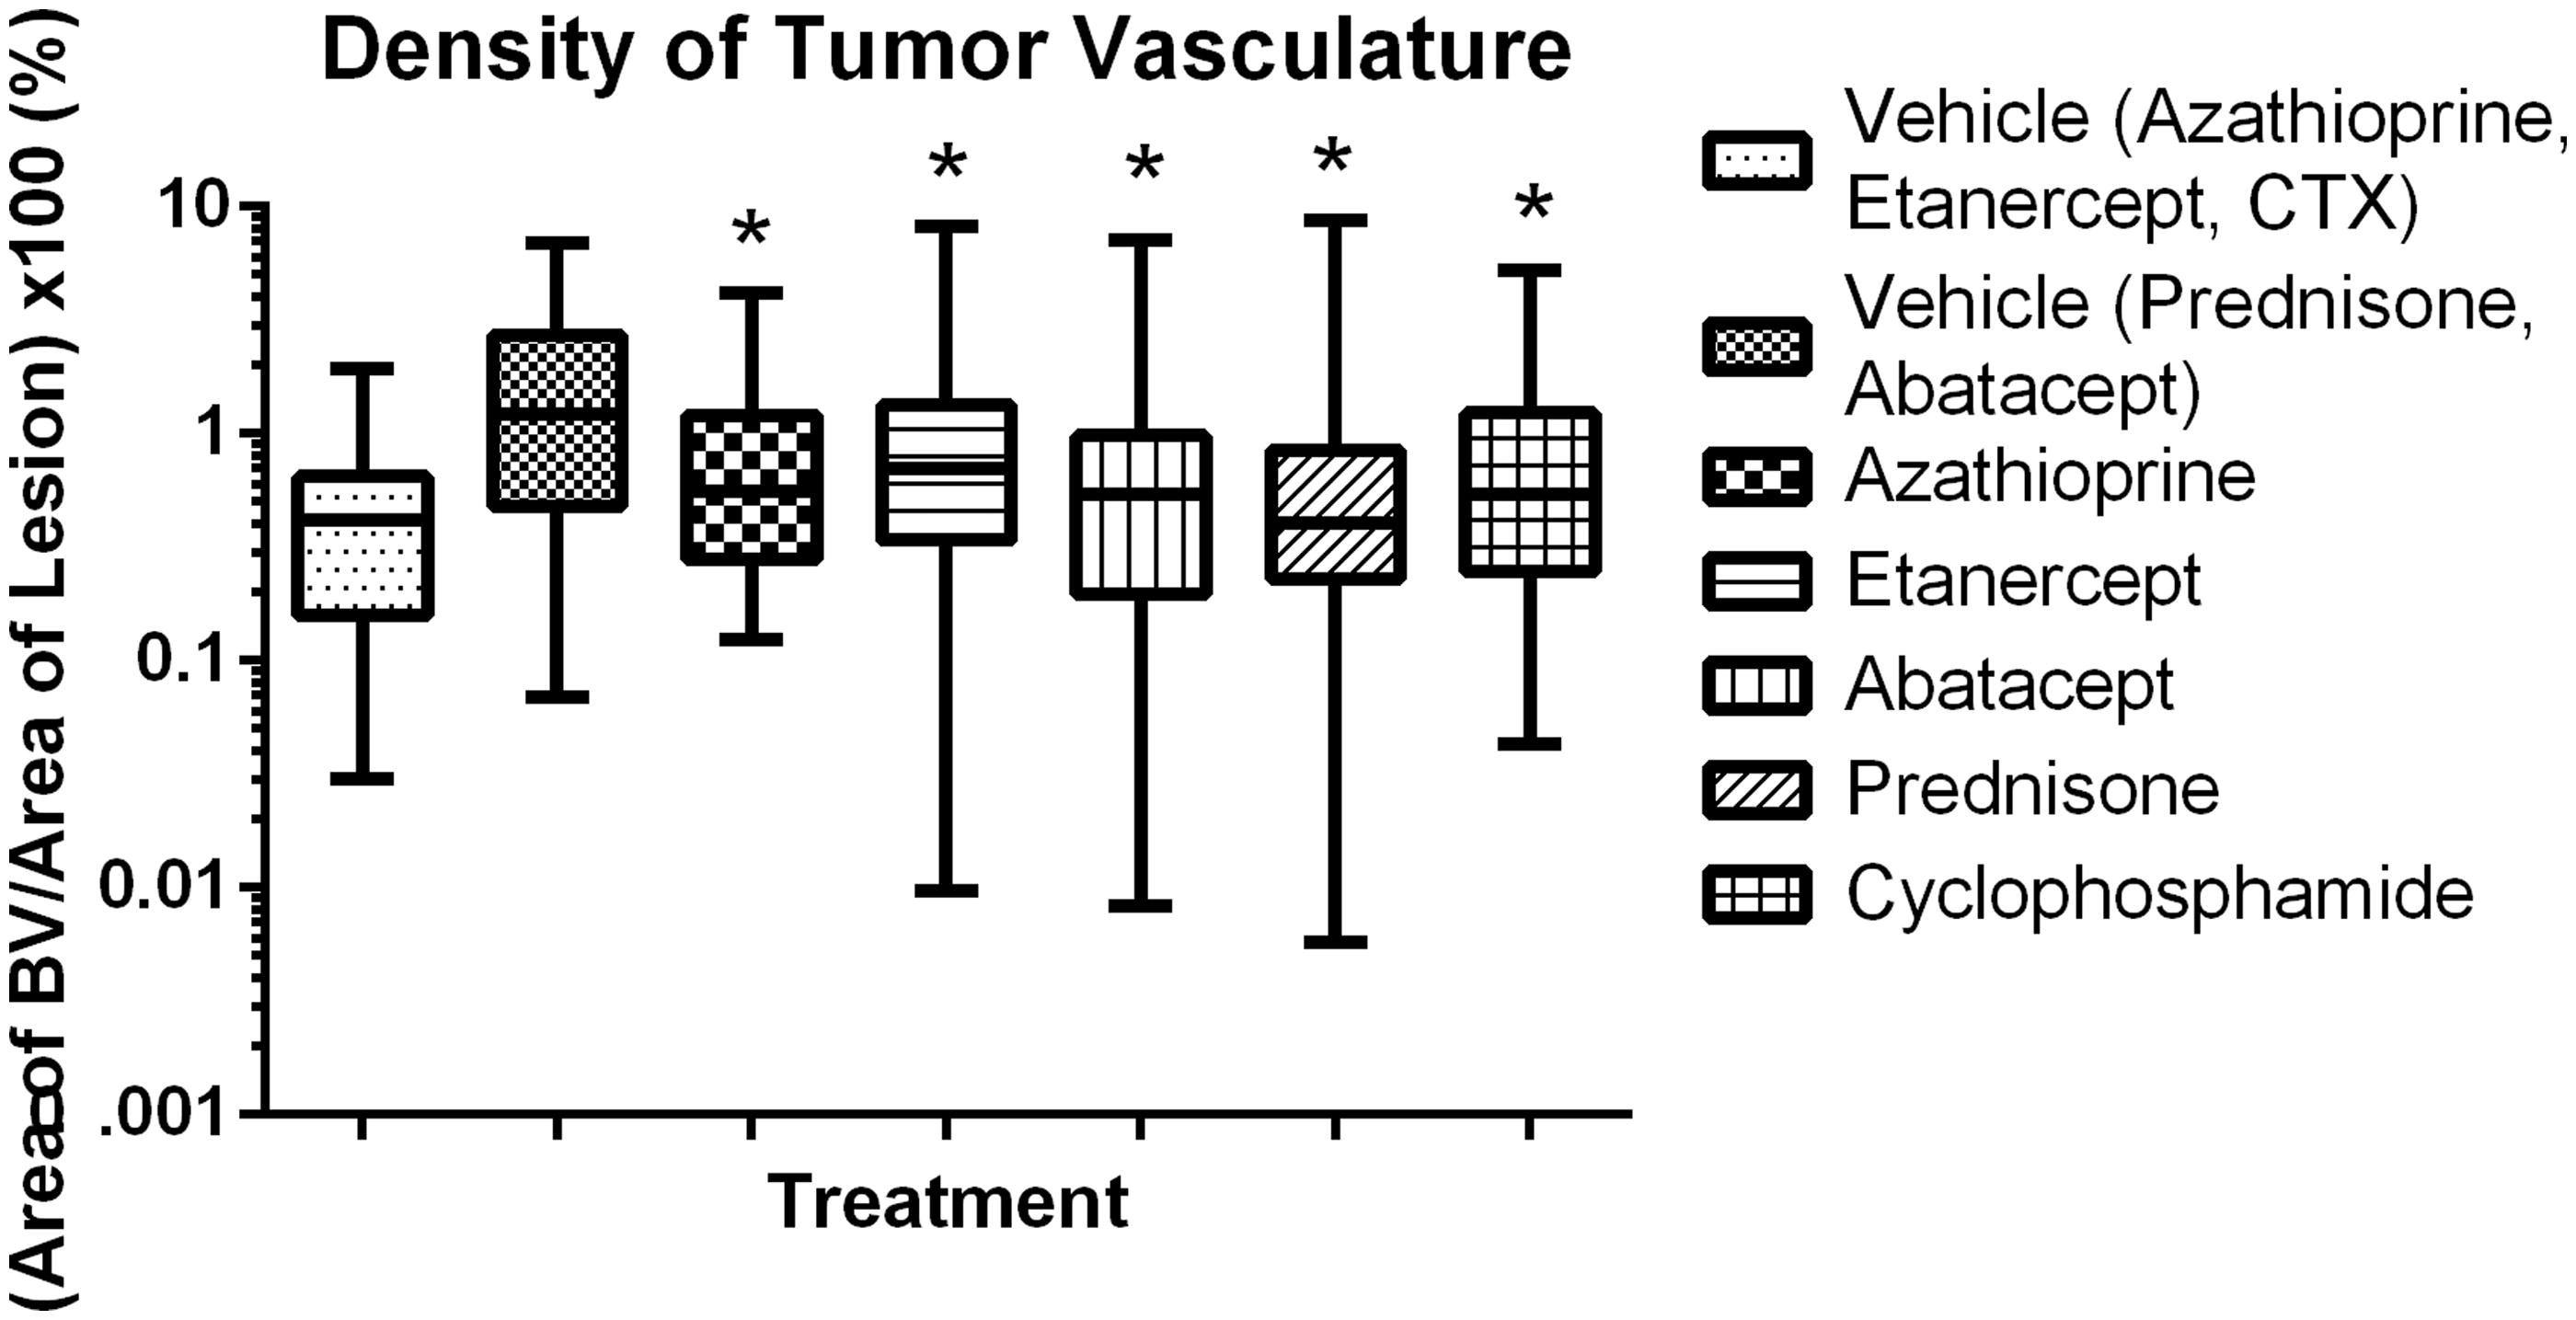
Morphometric assessments of lesion size, proliferation index and angiogenesis were then conducted on stained tissue sections of the lungs (). Treatment of the tumor-bearing mice with azathioprine, etanercept, prednisone or CTX had no significant effect on tumor size; in contrast, mice treated with abatacept had a significant decrease in tumor size (). Treatment with etanercept, abatacept or prednisone had no significant effect on proliferation index (), while treatment with azathioprine or CTX significantly increased the growth fraction. Treatment with prednisone or abatacept () led to a significant decrease in angiogenesis (when compared to in control mice); treatment with CTX, azathioprine or etanercept led to a significant increase in angiogenesis compared to levels in control mice.
Figure 5. Representative IHC images of SCC VII cells in lung, (a) IHC for BrdU, (b) IHC for vWF. 20X Magnification.
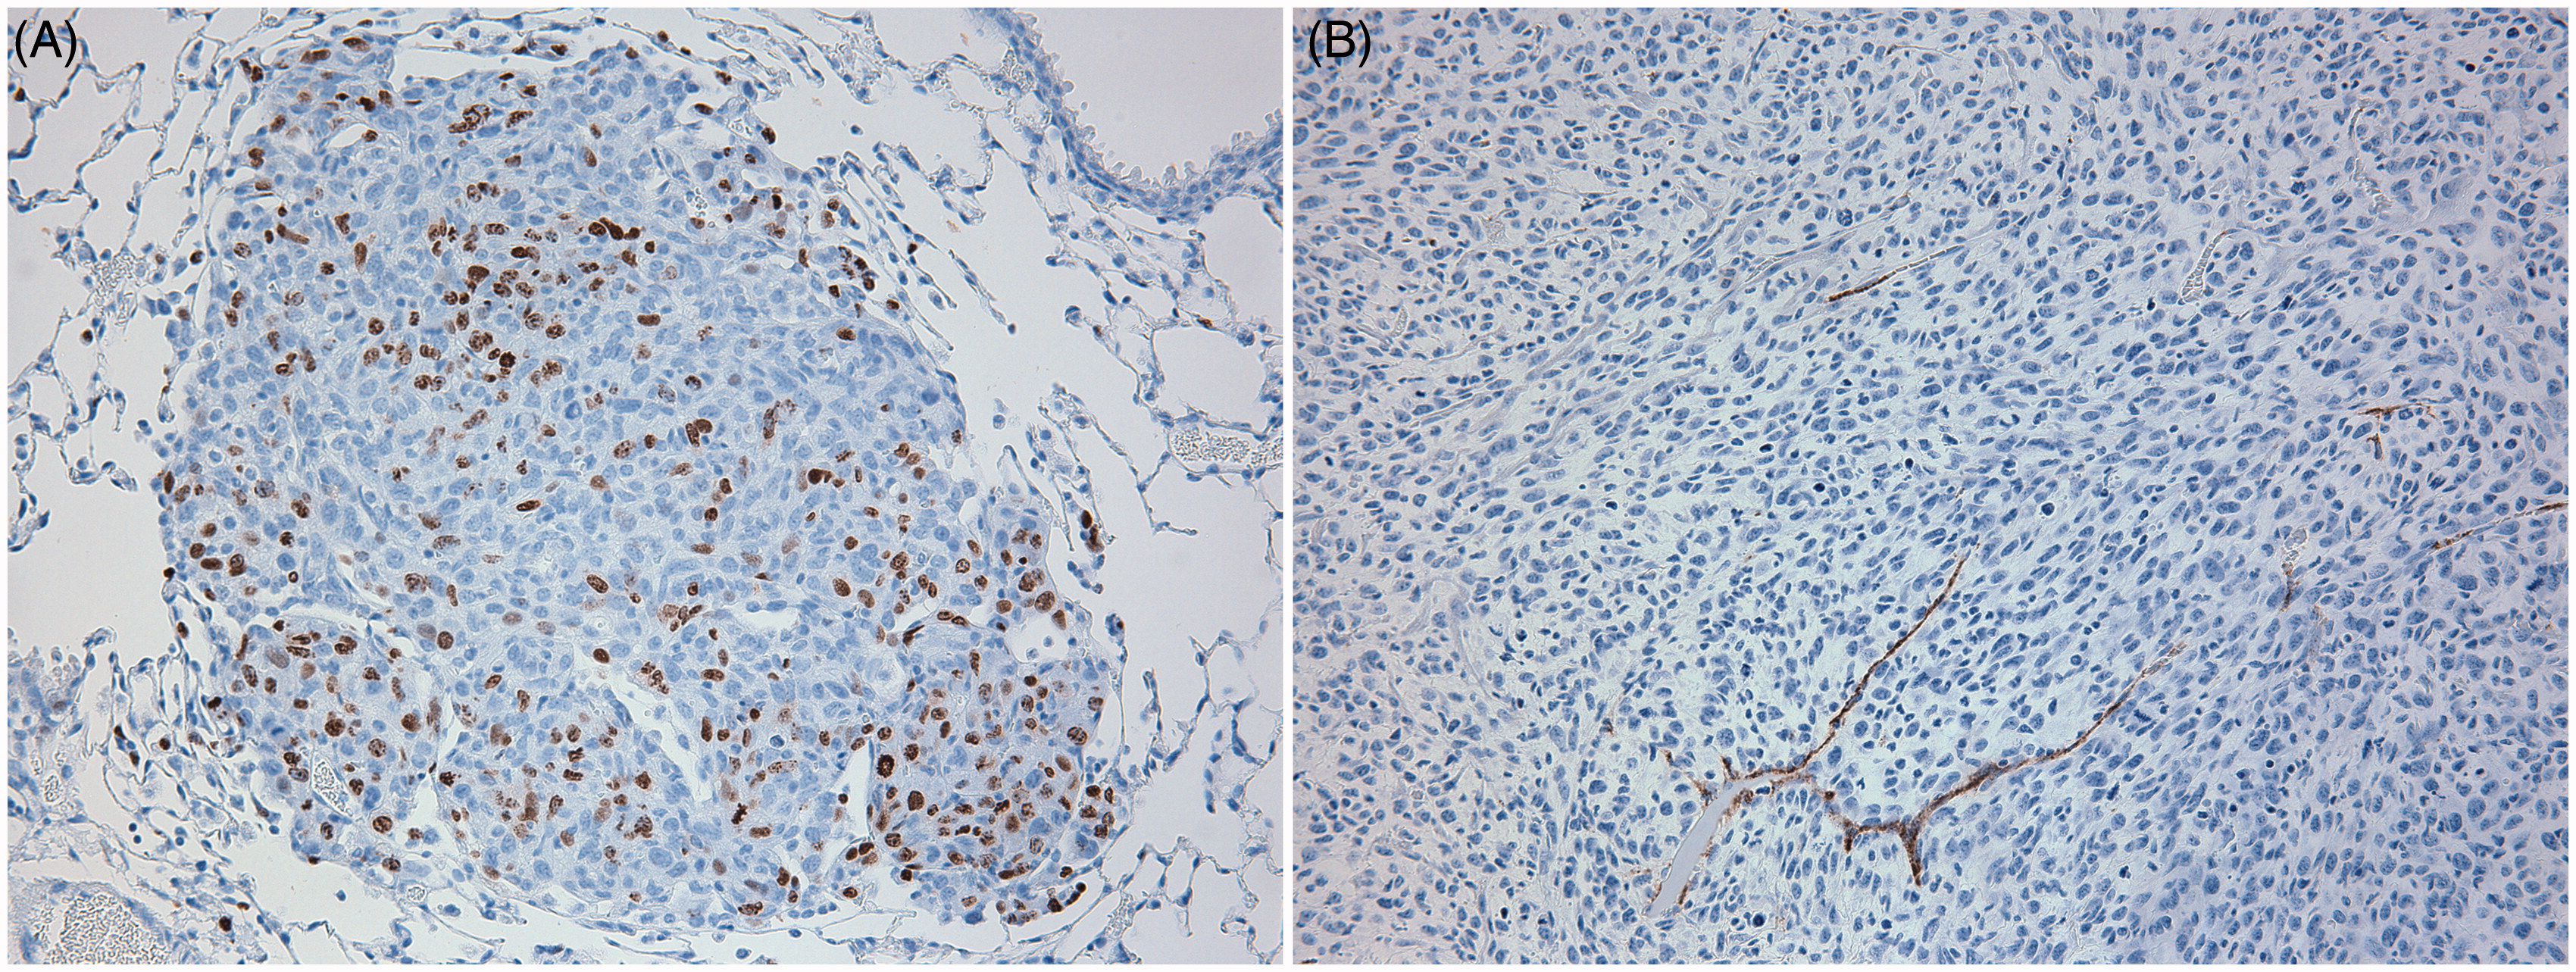
Figure 6. Lesion area for established lung colonies. Abatacept decreases lesion area in established lung colonies. Box and whiskers, Min to Max. *Significantly different from control (p < 0.05); n = 12/group. Treatment group always compared back to respective control.
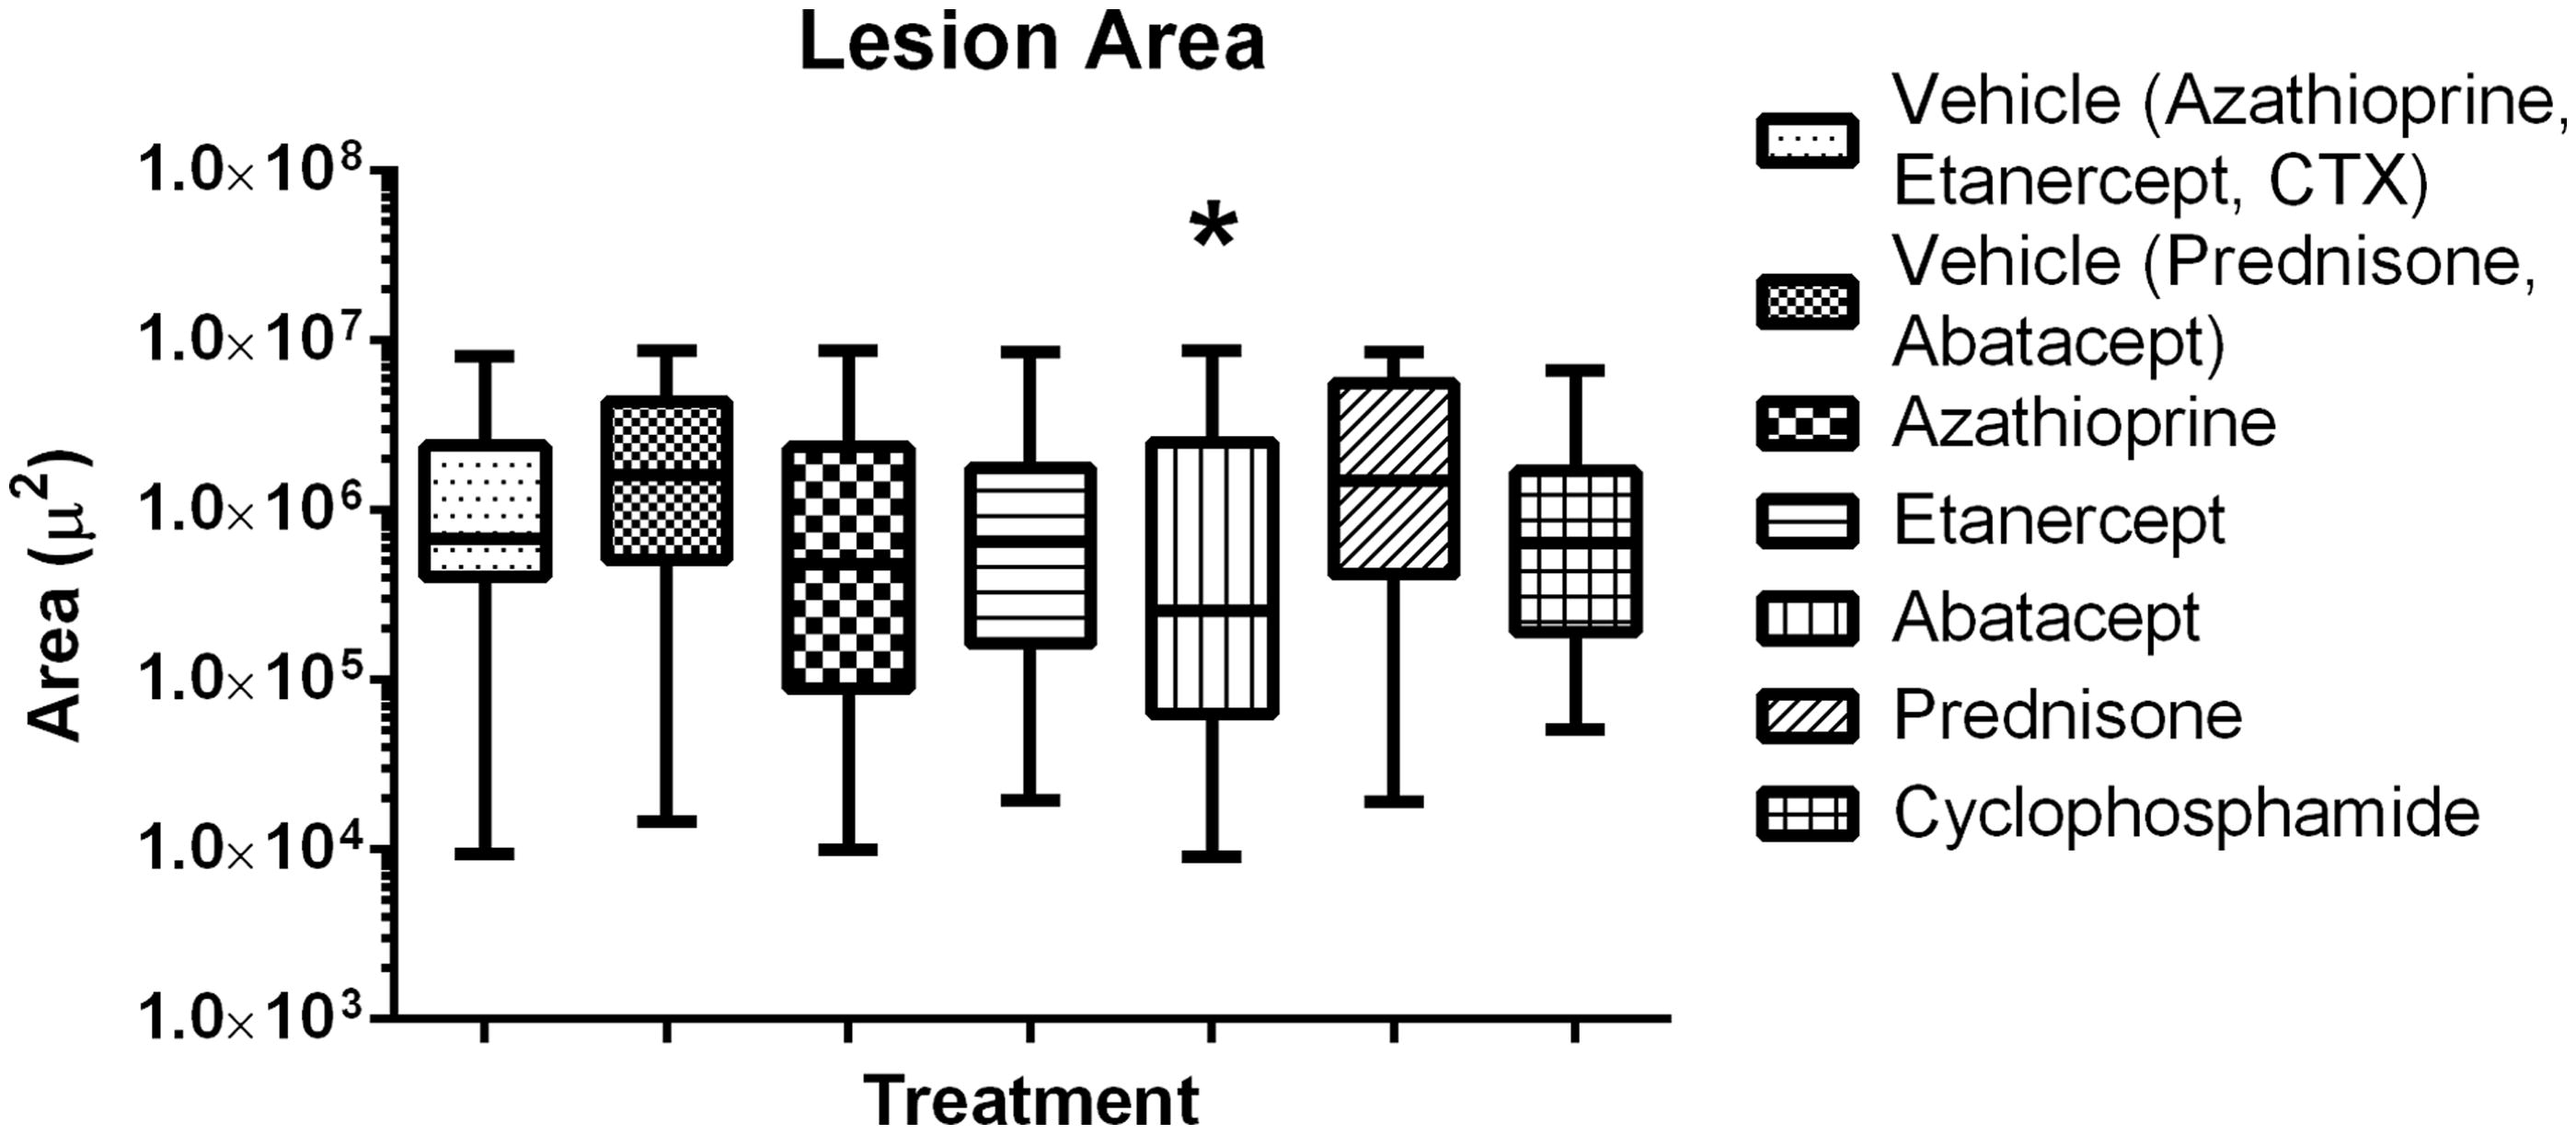
Figure 7. Growth fraction in established colonies. CTX and Azathioprine increase growth fraction in established colonies. Box and whiskers, Min to Max. *Significantly different from control (p < 0.05); n = 12/group. Treatment group always compared back to respective control.
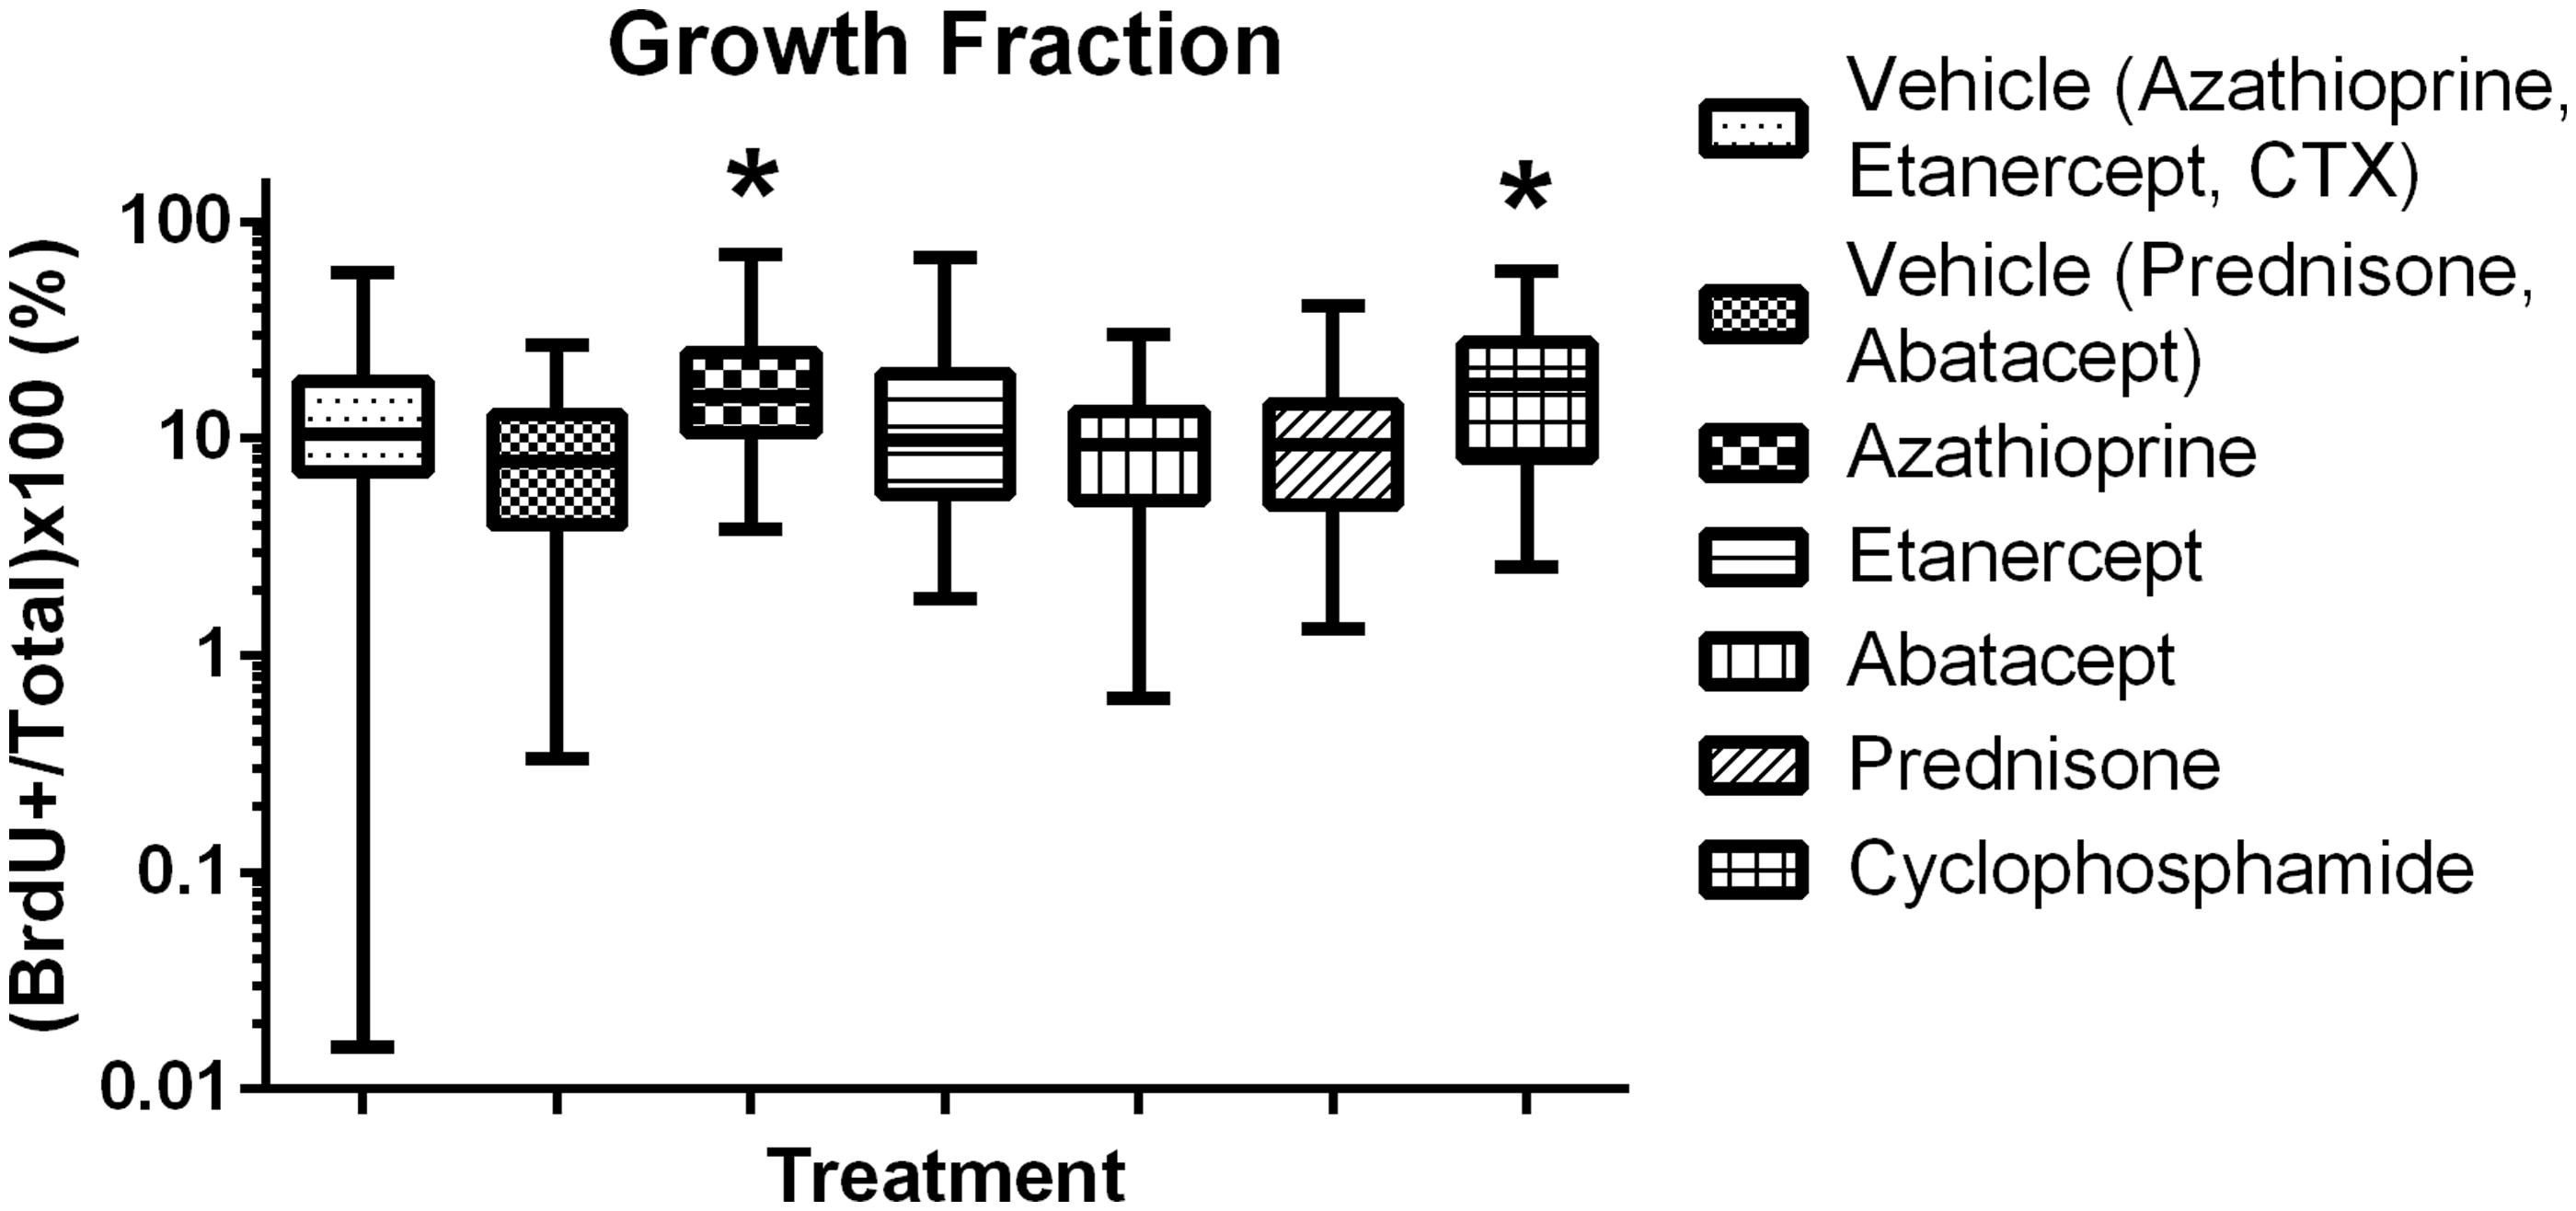
Figure 8. Immunosuppressive drug effects on angiogenesis in established lung colonies. Box and whiskers, Min to Max. *Significantly different from control (p < 0.05); n = 12/group. Treatment group always compared back to respective control.
Effect of agents on models of local growth and metastases, colonization and progression
A summary of results in shows the predictiveness of the immunosuppressive drugs used in the experiments outlined here as well of immunosuppressive drugs that have previously been tested (Egenolf et al., Citation2011; Rafferty et al., Citation2012) in this 3-stage model of carcinogenesis.
Table 2. Immunosuppressive drugs tested had varying effects on models of invasion, colonization and progression: Summary of results.
Discussion
Critical review of pre-clinical assays to evaluate immunosuppressive drugs for risk of carcinogenesis in humans identified shortcomings of conventional assessments and proposed that a combination of primary tumor and metastasis assays using transplanted cells may have value in hazard identification (Bugelski et al., Citation2010). SCC VII cells in syngeneic C3H/HeN mice were evaluated as a model to assess immune surveillance during the promotion and progression phases of carcinogenesis. The work reported in this publication is meant to extend and complete previously reported work investigating the use of SCC VII cells in a syngeneic mouse model of tumor invasion (Egenolf et al., Citation2011) and the effects of CSA in SCC VII invasion, colonization and progression (Rafferty et al., Citation2012).
In vitro cytotoxicity data showed the direct effect of the immunosuppressive compounds on cells. The usefulness of in vitro assays was limited in that some compounds require in vivo metabolism for activity, e.g. CTX, which therefore should not be active in an in vitro model. Data should be interpreted with caution in that in vitro statistical significance does not always correlate with in vivo biological significance as seen by direct cytotoxicity of CTX and statistical significance attributed to datapoints of other compounds in a non-dose-dependent fashion (). Direct cytotoxic effects were observed for azathioprine and prednisone at higher concentrations that were not considered to be biologically relevant.
Treatment with immunosuppressive agents here had minimal effects on the local growth of tumor cells inoculated IM in the gastrocnemius muscle. This is consistent in that induction of adaptive immune surveillance has not occurred at this early timepoint. These results suggest that the effects of the evaluated immunosuppressive compounds have little effect on innate immunity or that innate immunity plays a lesser role in this model.
Invasion was assessed using two endpoints; fluorescence trafficking to draining lymph node and histologic assessment of tumor cells in draining lymph node. The role of immunosurveillance was previously demonstrated by increased invasion in immunocompromised SCID and SCID/beige mice (Egenolf et al., Citation2011). In that study, increased invasion measured by histology and/or fluorescence was seen via treatment with CTX, but that observation was not replicated in this study with no effect on fluorescence or histologic endpoints. Timing and dose of CTX varied between the two studies, 200 mg/kg on Days 1 and 3 (Egenolf et al., Citation2011) versus in this work, 20 mg/kg administered on 8 days throughout the study, and resulted in different outcomes for invasion. The effect of dose on invasion was also noted using CSA in a previous study (Rafferty et al., Citation2012). Dose and timing of drug administration are identified as significant considerations for pre-clinical assessments. Lastly, fluorescence migration and histologic endpoints in the invasion assay have not been concordant (Rafferty et al., Citation2012). Multiple possibilities exist for the independent movement of tumor cells and fluorophore, but were not further explored. Histology is considered a stronger endpoint and further use of fluorophore labeled tumor cells is not considered useful in this model.
Colonization and progression assays exploit different dosing and timing of administration of compound for effect on intravenously injected tumor cells. Pre-treatment of immunosuppressive agent prior to tumor cell injection assesses implantation and establishment of metastases (colonization), while chronic treatment in concurrence of tumor cell administration assesses progression of established metastases (progression). CTX increased colonization, presumably via decreased immune surveillance. This effect of CTX was repeated in additional experiments (data not shown). The remaining immunosuppressive compounds had no effect. The effect of immune surveillance on progression was demonstrated by increased lesion area in SCID/beige mice in two experiments (data not shown). All treatments except CSA and abatacept showed no effect on lesion area, suggesting that compound-induced immunosuppression in this current model was not severe enough to impair tumor immunosurveillance treatment with CSA and abatacept decreased lesion size. These results are paradoxical and unexplained. A previously reported study showed no effect of CSA administration in a SCC VII mouse model (Khariwala et al., Citation2006) and clinical observations report increased incidence of SCC in CSA treated patients (Schulz, Citation2009; Ulrich et al., Citation2008). More detailed discussions of CSA induced immunosuppression in mouse syngeneic tumor models are reported in the literature (Rafferty et al., Citation2012).
Growth fraction and blood vessel area were investigated here to address potential mechanisms of action for increased or decreased growth of tumor cells. Positive or negative changes in these endpoints did not consistently correlate with lesion number or size. In addition, a repeatable increase in lesion area was observed in the progression model with SCID/beige mice, but data for growth fraction or area of vasculature was not consistent or repeatable (data not shown). In these models, growth fraction and blood vessel area do not add value to the risk assessment paradigm for immunosuppressive agents.
The results reported here characterize the effects of immunosuppressive drugs on three stages of tumor pathogenesis. The strength of this mouse model is the use of syngeneic transplanted tumor cells of a tumor that is clinically relevant in humans. The absence of a clearly demonstrated increase in neoplasia with the immunosuppressive therapeutics evaluated questions the robustness of the model.
Conclusions
Oncogenesis in patients receiving immunosuppressive drugs is recognized as an important issue; however, the traditional 2-year rodent bioassay is not optimal if testing immunosuppressive drugs (Bugelski et al., Citation2010; Vahle et al., Citation2010). A science-based, mechanistic approach dissecting the steps of carcinogenicity using mouse models of immune surveillance may be an appropriate way to more fully address the issues. This approach may allow a data-based risk assessment for better communication of hazard. The syngeneic SCC VII tumor model reported here provides some insight into immunosuppression and immunosurveillance of SCC, but does not fulfill requirements for regulatory risk assessment.
Declaration of interest
This work was supported by Janssen Research & Development, LLC. The authors report no conflict of interest. The authors alone are responsible for the content and writing of the paper.
Acknowledgements
The authors would like to acknowledge the late Dr Peter J. Bugelski for identifying the shortcomings of the 2-year rodent bioassay and passionately and innovatively developing these novel SCC VII tumor immunosurveillance models.
References
- Bugelski, P. J., Volk, A., Walker, M. R., et al. 2010. Critical review of pre-clinical approaches to evaluate the potential of immunosuppressive drugs to influence human neoplasia. Intl. J. Toxicol. 29:435–466
- Dooley, M. A., and Ginzler, E. M. 2006. Newer therapeutic approaches for systemic lupus erythematosus: Immunosuppressive agents. Rheum. Dis. Clin. North. Am. 32:91–102
- Egenolf, D. D., Rafferty, P., Brosnan, K., et al. 2011. Development of a murine model of lymph node metastases suitable for immunotoxicity studies. J. Pharmacol. Toxicol. Meth. 63:236–249
- Hernandez, L. G., van Steeg, H., Luijten, M., and van Benthem, J. 2009. Mechanisms of non-genotoxic carcinogens and importance of a weight of evidence approach. Mutat. Res. 682:94–109
- Hume, D. M., Merrill, J. P., Miller, B. F., and Thorn, G. W. 1955. Experiences with renal homo-transplantation in the human: Report of nine cases. J. Clin. Invest. 34:327–382
- Khariwala, S. S., Kjaergaard, J., Lorenz, R., et al. 2006. Everolimus (RAD) inhibits in vivo growth of murine squamous cell carcinoma (SCC VII). Laryngoscope 116:814–820
- Khurana, D., Martin, E. A., Kasperbauer, J. L., et al. 2001. Characterization of a spontaneously-arising murine squamous cell carcinoma (SCC VII) as a prerequisite for head and neck cancer immunotherapy. Head Neck 23:899–906
- Kurki, P. T. 1992. Safety aspects of the long term cyclosporin A therapy. Scand. J. Rheumatol. Suppl. 95:35–38
- O’Malley B.W. Jr, Cope, K. A., Johnson, C. S., and Schwartz, M. R. 1997. A new immuno-competent murine model for oral cancer. Arch. Otolaryngol. Head Neck Surg. 123:20–24
- Rafferty, P., Egenolf, D., Brosnan, K., et al. 2012. Immunotoxicologic effects of cyclosporine on tumor progression in models of squamous cell carcinoma and B-cell lymphoma in C3H mice. J. Immunotoxicol. 9:43–55
- Schreiber, R. D., Old, L. J., and Smyth, M. J. 2011. Cancer immunoediting: Integrating immunity's roles in cancer suppression and promotion. Science 331:1565–1570
- Schulz, T. F. 2009. Cancer and viral infections in immunocompromised individuals. Intl. J. Cancer 125:1755–1763
- Ulrich, C., Kanitakis, J., Stockfleth, E., and Euvrard, S. 2008. Skin cancer in organ transplant recipients - where do we stand today? Am. J. Transplant. 8:2192–2198
- Vahle, J. L., Finch, G. L., Heidel, S. M., et al. 2010. Carcinogenicity assessments of biotechnology–derived pharmaceuticals: A review of approved molecules and best practice recommendations. Toxicol. Pathol. 38:522–553
- Vial, T., and Descotes, J. 2003. Immunosuppressive drugs and cancer. Toxicology 185:229–240
- Weischer, M., Rocken, M., and Berneburg, M. 2007. Calcineurin inhibitors and rapamycin: Cancer protection or promotion? Exp. Dermatol. 16:385–393
- Wong, R. J., Chan, M. K., Yu, Z., et al. 2004. Angiogenesis inhibition by an oncolytic herpes virus expressing IL-12. Clin. Cancer Res. 10:4509–4516
- Wong, R. J., Patel, S. G., Kim, S., et al. 2001. Cytokine gene transfer enhances herpes oncolytic therapy in murine squamous cell carcinoma. Human Gene Ther. 12:253–265