
Abstract
In the body, there is a natural three-dimensional (3D) microenvironment in which immune cells, including dendritic cells (DC), play their functions. This study evaluated the impact of using collagen-chitosan 3D nano-scaffolds in comparisons to routine 2D culture plates on DC phenotype and functions. Bone marrow-derived DC were cultured on scaffolds and plates and then stimulated with lipopolysaccharide (LPS) or chitosan-based nanoparticles (NP) for 24 h. Thereafter, DC viability, expression of maturation markers and levels of cytokines secretion were evaluated. In another set of studies, the DC were co-cultured with allogenic T-lymphocytes in both the 2D and 3D systems and effects on DC-induction of T-lymphocyte proliferation and cytokine release were analyzed. The results indicated that CD40, CD86 and MHC II marker expression and interleukin (IL)-12, IL-6 and tumor necrosis factor (TNF)-α secretion by DC were enhanced in 3D cultures in comparison to by cells maintained in the 2D states. The data also showed that DNA/chitosan NP activated DC more than LPS in the 3D system. T-Lymphocyte proliferation was induced to a greater extent by DNA/NP-treated DC when both cell types were maintained on the scaffolds. Interestingly, while DC induction of T-lymphocyte interferon (IFN)-γ and IL-4 release was enhanced in the 3D system (relative to controls), there was a suppression of transforming growth factor (TGF)-β production; effects on IL-10 secretion were variable. The results here suggested that collagen-chitosan scaffolds could provide a pro-inflammatory and activator environment to perform studies to analyze effects of exogenous agents on the induction of DC maturation, NP uptake and/or cytokines release, as well as for the ability of these cells to potentially interact with other immune system cells in vitro.
Introduction
Dendritic cells (DC) are found in most tissues, are the main antigen-presenting cells (APC) and play a crucial role in initiation of immune responses. In peripheral tissues, immature DC (iDC) can capture antigens, process them and – after migration to secondary lymphoid organs – present them to T-lymphocytes. For many purposes, DC are cultured, such as in generation of DC vaccines and cell therapies, evaluation of potent antigens and vaccines, shifts in immune responses, basic pathophysiology of diseases, etc. (Dudek et al., Citation2013; Tel et al., Citation2014). In conventional two-dimensional (2-D) cultures, there are limitations such as need of the cells to adjust to an artificial linear surface and direct interference with normal cellular morphology, polarity, metabolism and motility (Lee et al., Citation2008). Due to these problems, recent studies have increasingly attempted to employ 3-D cell culture matrices that better represent the geometry, chemistry and signaling environment of natural extracellular matrices. In the body, native extracellular matrices (ECM) include an interstitial matrix and basement membranes. Gels of polysaccharides and fibrous proteins (collagen in particular) fill the interstitial space and act as a compression buffer against stresses placed on the ECM. To mimic natural ECM in vitro, polysaccharides and fibrous proteins are often employed (Alberts et al., Citation2010).
Collagen is a fibrous protein that contains both acidic and basic amino acid residues and may bear either a positive or negative charge, depending on pH (Hayashi et al., Citation2012; Wang et al., Citation2003). Chitosan is a biodegradable semi-crystalline polysaccharide obtained by N-deacetylation of chitin harvested from marine crustacean exoskeletons. As collagen and chitosan are amongst the most abundant polymers in nature, each has been used in the design of drug delivery systems and for the formation of scaffolds in tissue engineering applications (Lee et al., Citation2008). Some studies have reported beneficial uses of collagen/chitosan scaffolds in the culturing of several cell types, including endothelial cells (Mori et al., Citation1998), fibroblasts (Mori et al., Citation1997), mesenchymal stem cells (Ragetly et al., Citation2010), nerve cells (Li et al., Citation2014) and chondrocytes (Lahiji et al., Citation2000). These scaffolds also have been used for tissue/organ engineering, including skin, bones, blood vessels and nerve conduits. Surprisingly, there is little information on the use of such scaffolds for immune cell cultures or on potential interactions with and modulation of immune cell functions/responsivity caused by their use.
In this regard, the study reported here utilized collagen-chitosan scaffolds to compare potential effects on DC following culturing on 3D platforms (i.e. collagen-chitosan scaffolds) vs when maintained on routine 2D plates. To that end, the study evaluated effects on DC phenotype, cytokine secretion, nanoparticle uptake and interactions with T-lymphocytes as a function of the growth support system.
Materials and methods
Animals, cell line and materials
C57BL/6 and Balb/c mice (female, 6–8-weeks-of-age) were obtained from the Pasteur Institute (Tehran, Iran). Chitosan (100–300 kDa; 75–85% degree of deacetylation) and lipopoly-saccharides from Escherichia coli type 0111:B4 were purchased from Sigma (St. Louis, MO). Flat-bottomed plates were bought form Nunc (Kamstrup, Denmark). Recombinant mouse GM-CSF and IL-4 was purchased from R&D Systems (Minneapolis, MN). PE-conjugated anti-CD40, PE anti-CD86 and PE anti-MHC-II, PE and PE Cy5-conjugated anti-CD11c flow cytometry antibodies, as well as mouse cytokine ELISA kits, were obtained from eBiosciences (Frankfurt, Germany). RPMI 1640 and fetal bovine serum (FBS) were bought from Invitrogen (Gibco, Grand Island, NY). Collagen type Ι was isolated from fresh bovine tendon using a method of trypsin digestion and acetic acid dissolution described previously in Ma et al. (Citation2003).
Preparation of collagen-chitosan scaffold
Collagen or chitosan were dissolved in 1% acetic acid solution to prepare 2% (w/v) solutions. The chitosan solution was then slowly dripped into the collagen suspension to achieve a final collagen:chitosan ratio of 9:1; thereafter, the materials were homogenized to obtain a collagen-chitosan blend. This blend was then injected into a mold (diameter = 15 mm, depth = 3 mm), frozen at −20 °C for 1 h and then placed at −70 °C. The samples were then dried in a lyophilizer (Edwards MicroModulyo, Bristol, UK).
Cross-linking treatment
Lyophilized scaffolds were re-hydrated and stabilized in ethanol. In this process, scaffolds were immersed in absolute ethanol for ∼1 h and then sequentially in 70% (v/v) and then 50% ethanol for 30 min periods. The scaffolds were finally equilibrated in phosphate-buffered saline (PBS, pH 7.4) prior to mechanical testing.
Swelling test
The scaffolds were placed in distilled water at room temperature and the wet weight (w) determined after incubation for 24 h. Swelling ratio was defined as the ratio of weight increase to initial weight, i.e. (W − W0)/W0. Each value was averaged from three parallel measurements.
Depolymerization of chitosan
Oxidative degradation with sodium nitrite (NaNO2) at room temperature was performed to prepare low molecular weight chitosan. Chitosan was dissolved in 1% acetic acid solution to prepare a 2% (w/v) solution. When the chitosan was completely dissolved, an appropriate amount of 0.1 M NaNO2 was added drop-wise and the solution mixed at room temperature for 3 h. The reaction mixture was subsequently neutralized with 1 N NaOH (to pH 8) to precipitate chitosan oligomers. The precipitated chitosan was recovered by filtration, washed several times with deionized water and then by methanol. Thereafter, the material was dried for 12 h in a freeze-dry lyophilizer (Edwards MicroModulyo).
Chitosan/DNA nanocomplex preparation
pEGFP-N1 (Invitrogen) (4.7 kb) was used as the DNA sample molecule. Chitosan/DNA charge ratio was expressed as ratio of moles of chitosan amine groups:DNA phosphate moieties. To form nanocomplexes, chitosan oligomer (0.1% [w/v]) was dissolved in aqueous acetic acid (0.1% [v/v]) and then the chitosan solution and a DNA solution (100 µg/ml in acetic acid (0.1% v/v) were each separately pre-heated to 50–55 °C. Equal volumes of each solution were quickly mixed, vortexed for 15–30 s, then incubated at room temperature for 30 min. To yield uniform nanoparticles (NP), the final volume of the mixture was limited to ≤500 ml. NP complex formation was confirmed by electrophoresis of the product over a 1% agarose gel (in TBE buffer [Tris-Borate-EDTA (pH 8.3)]) at 100 V for 30 min. The DNA in the particles was visualized using ethidium bromide.
Assessment of nanoparticle uptake efficacy
To evaluate the efficacy of chitosan NP uptake by cultured DC, a nanocomplex of FITC-labeled scrambled siRNA with chitosan oligomers was constructed using the same methodology as in the DNA/chitosan preparation. The labeled siRNA was synthesized by the Bioneer Company (Bioneer, Daejeon, South Korea). After 6 h of DC exposure with siRNA (10 µg siRNA/106 cell/ml), the cells were washed and fluorescent microscopy and flow cytometry then performed. Assessments of DC nanoparticle uptake were performed a minimum of five times.
Scanning electronic microscopy (SEM)
Size and uniformity of prepared DNA/chitosan NP were evaluated using SEM analysis. Dried NP were mounted on aluminum and adhered to double-sided carbon tape. The sample was then coated with a 10-nm thick gold film using a sputter coater and then analyzed by an electron acceleration voltage of 20 KeV in a DSM 940A SEM system (Zeiss, Hamburg, Germany)
Fourier-transformed infrared spectroscopy (FTIR)
In a freshly-cleaned plastic dish, the test NP were maintained under vacuum overnight at 50 °C to allow for film formation. A FTIR spectra of the samples was then measured over the range of 4000–400 cm−1 in a Nicolet IR 100 spectrophotometer (Thermo Scientific, Nicolet, WI).
Bone marrow-derived DC preparation
Marrow-derived DC were derived from bones of BALB/c mice. In brief, bone marrow cells were flushed from isolated femurs and, after washing, counted. Samples were suspended in complete RPMI 1640 and then placed in culture dishes at 1.0–1.5 × 10⁶ cells/ml. To the cultures, 20 ng mGM-CSF/ml and 10 ng IL-4/ml (both from R&D Systems) were both added and the cells incubated at 37 °C. Fresh medium containing both the mGM-CSF and mIL-4 was added after 3 and 6 days of culture. Immature DC (iDC) were harvested on Day 6.
Dendritic cell culture, analyses of maturation and cytokine production
iDC (8 × 10⁵ cells/ml) were cultured in 10% FBS-RPMI medium on collagen-chitosan scaffolds and 24-well flat plates in three groups, i.e. DC alone, DC + LPS (5 µg/ml) and DC + NP (10 µg/ml) in 1 ml final volumes. LPS and NP treatments were begun at the same time. After fixed periods of time, DC maturation markers and phenotypes were determined (via FACS analysis) using PE-conjugated mAb against CD40, CD86 and MHC II and PE Cy5-conjugated anti-CD11c. Isotype-matched control mAb were also used. DC viability was determined using an MTT-based method and the relative viability calculated as DC test group OD/DC only OD (with the DC only OD value accepted ultimately as 1.0 for graphical purposes). Supernatants of the cultures were measured for levels of tumor necrosis factor (TNF)-α, interleukin (IL)-6 and IL-12 (by ELISA). The limits of sensitivity of the kits were 3.7 pg TNFα/ml, 6.5 pg IL-6/ml and 10 pg IL-12/ml.
Mixed-leukocyte reaction (MLR) on chitosan-collagen (3D) microenvironment
To evaluate the function of the cultured DC on the 3D or 2D environments, lymph node T-lymphocytes were isolated from C57BL/6 mice and purified over nylon wool. After counting, 2 × 10⁵ T-lymphocytes and 2 × 10⁴ harvested DC were co-cultured for 72 h at 37 °C on the 3D/2D systems in three groups, i.e. DC alone, DC + LPS (5 µg/ml) or DC + NP (irradiated by Cs137). LPS and NP treatments were begun at the same time. T-Lymphocyte proliferation was estimated using a cell proliferation assay kit I (Roche, Nutley, NJ); outcomes were expressed in terms of Stimulation Index (SI), where SI = OD test system/OD control. T-Lymphocyte secretion of interferon (IFN)-γ, IL-4, IL-10 and transforming growth factor (TGF)-β was measured using ELISA kits (eBiosciences). Limits of sensitivity of the kits were 5.3 IFNγ pg/ml, 0.3 IL-4 pg/ml, 5.0 IL-10 pg/ml and 8.0 TGFβ pg/ml.
Statistics
All experiments contained at least three replicates. Data were analyzed for within and between group statistical differences using, respectively, Kruskal Wallis and Mann-Whitney U-tests (SPSS 15 Software, Chicago, IL). A p value < 0.05 was considered as significant.
Results
Scaffold structures and properties
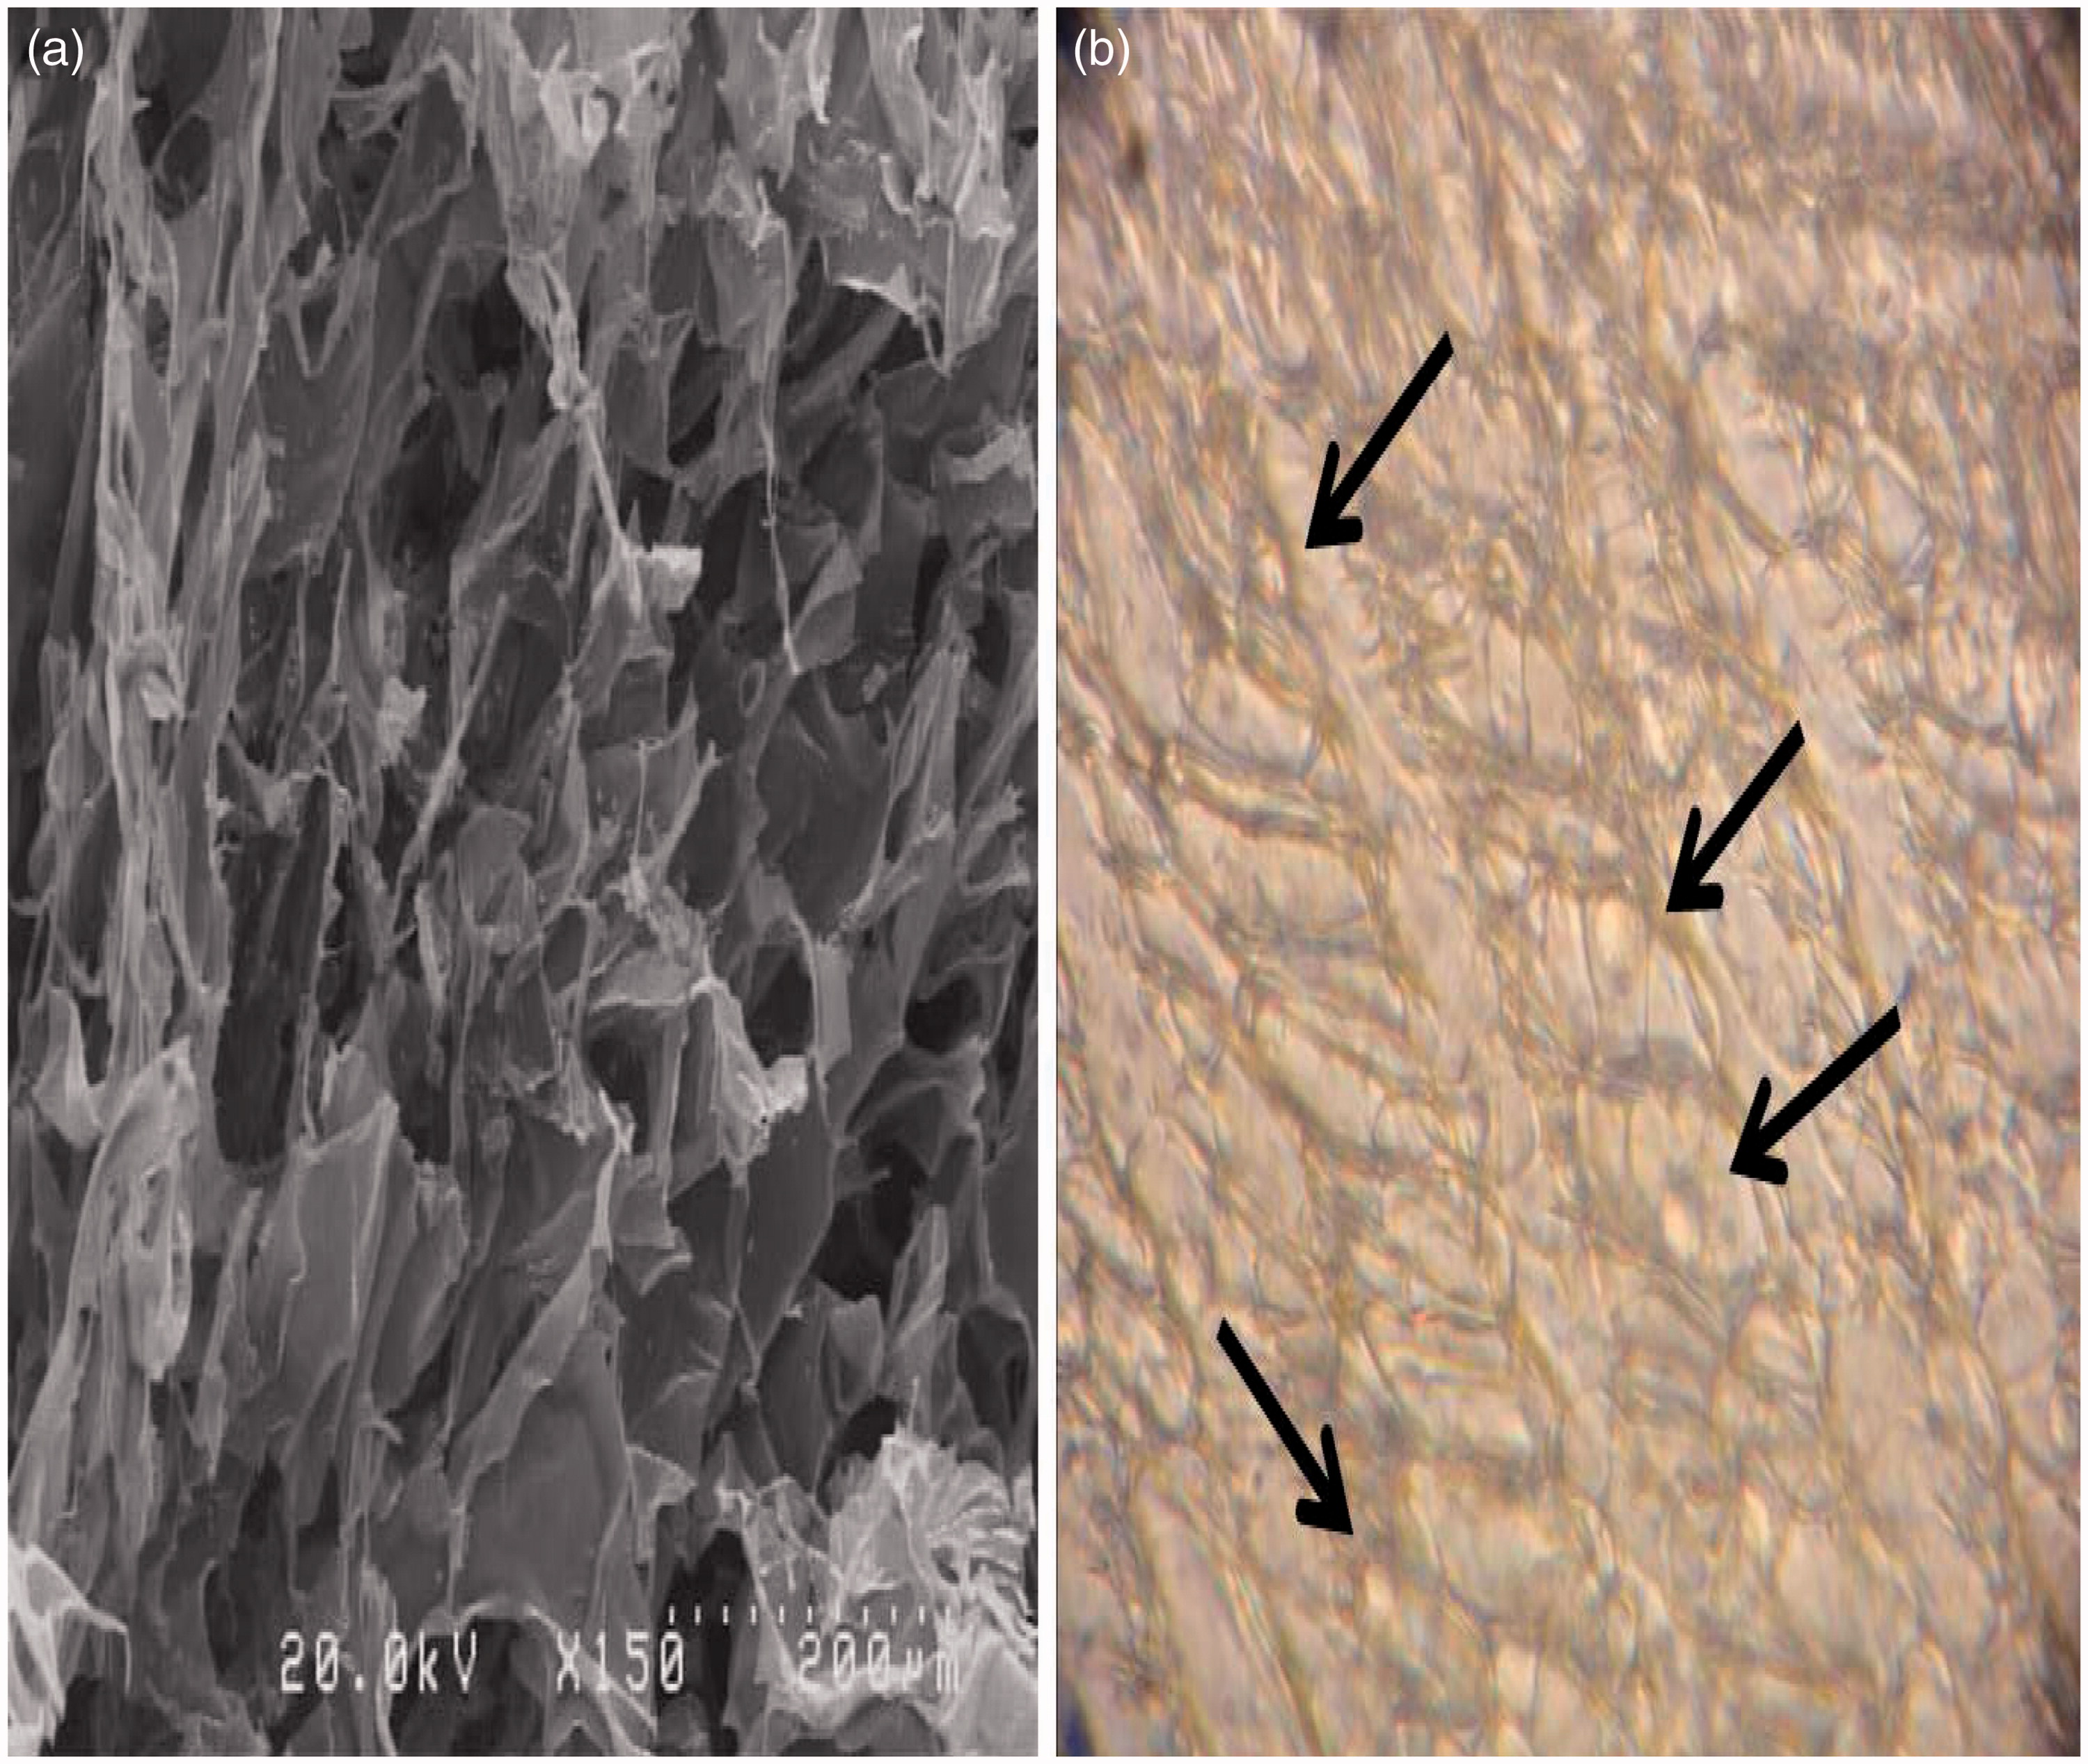
Electronic microscopy (EM) analysis of the collagen-chitosan scaffolds revealed the systems had a porous surface (). Water absorption evaluation indicated there was a 7.55-fold swelling [(0.1026–0.0120)/0.0120 = 7.55] of the prepared scaffolds.
Figure 1. Porous chitosan-collagen scaffold structure. (a) SEM photograph. (b) Cultured DC integration into scaffold pores (under light microscope; 40× magnification).
DNA/chitosan nanoparticle (NP) preparation and DC nanoparticle uptake
Plasmid DNA/chitosan NP were evaluated by electrophoresis, FTIR and SEM. Agarose gel electrophoresis and FTIR assays showed there was >95% integration of plasmid DNA into the chitosan NP (data not shown). EM evaluations demonstrated the integrated NP were uniform and spherical (average diameter of 45–50 nm) (). FITC-labeled siRNA/chitosan NP uptake into the DC were also taken up quite well (); flow analyses indicated that >80% of the DC were positive and had detectable amounts of labeled NP (over a series of at least five repetitions).
Figure 2. SEM demonstration of DNA-chitosan nanoparticles (NP), DC nanoparticle uptake and DC viability (as relative viability, i.e. viability of treated DC/untreated DC). (a and b) After 6 h exposure with FITC-labeled siRNA-chirosan NP, >80% of DC had taken up the NP and expressed green light. (c) SEM analysis of aggregates (due to drying of materials for SEM) of the NP that each had uniform spherical forms (45–50 nm diameters). (d) DC viability was approximately the same in different groups as well as within and between the two culture systems (2D [plate] vs 3D [scaffold]).
![Figure 2. SEM demonstration of DNA-chitosan nanoparticles (NP), DC nanoparticle uptake and DC viability (as relative viability, i.e. viability of treated DC/untreated DC). (a and b) After 6 h exposure with FITC-labeled siRNA-chirosan NP, >80% of DC had taken up the NP and expressed green light. (c) SEM analysis of aggregates (due to drying of materials for SEM) of the NP that each had uniform spherical forms (45–50 nm diameters). (d) DC viability was approximately the same in different groups as well as within and between the two culture systems (2D [plate] vs 3D [scaffold]).](/cms/asset/3180ed90-55a6-4e3e-8c37-cf02dd4ba94c/iimt_a_1045636_f0002_c.jpg)
Viability of DC cultured on scaffolds
The DC cultured on collagen-chitosan scaffolds became integrated into scaffolds pores (see ). After 48 h of culture, viability of DC on the scaffolds and 2D flat plates were evaluated. The results indicated that, within either system, the DC had approximately the same viabilities in the three different treatment groups. Further, it appeared there were no differences between viabilities of the DC on the 2D plates vs on the 3D scaffolds, across all treatments ().
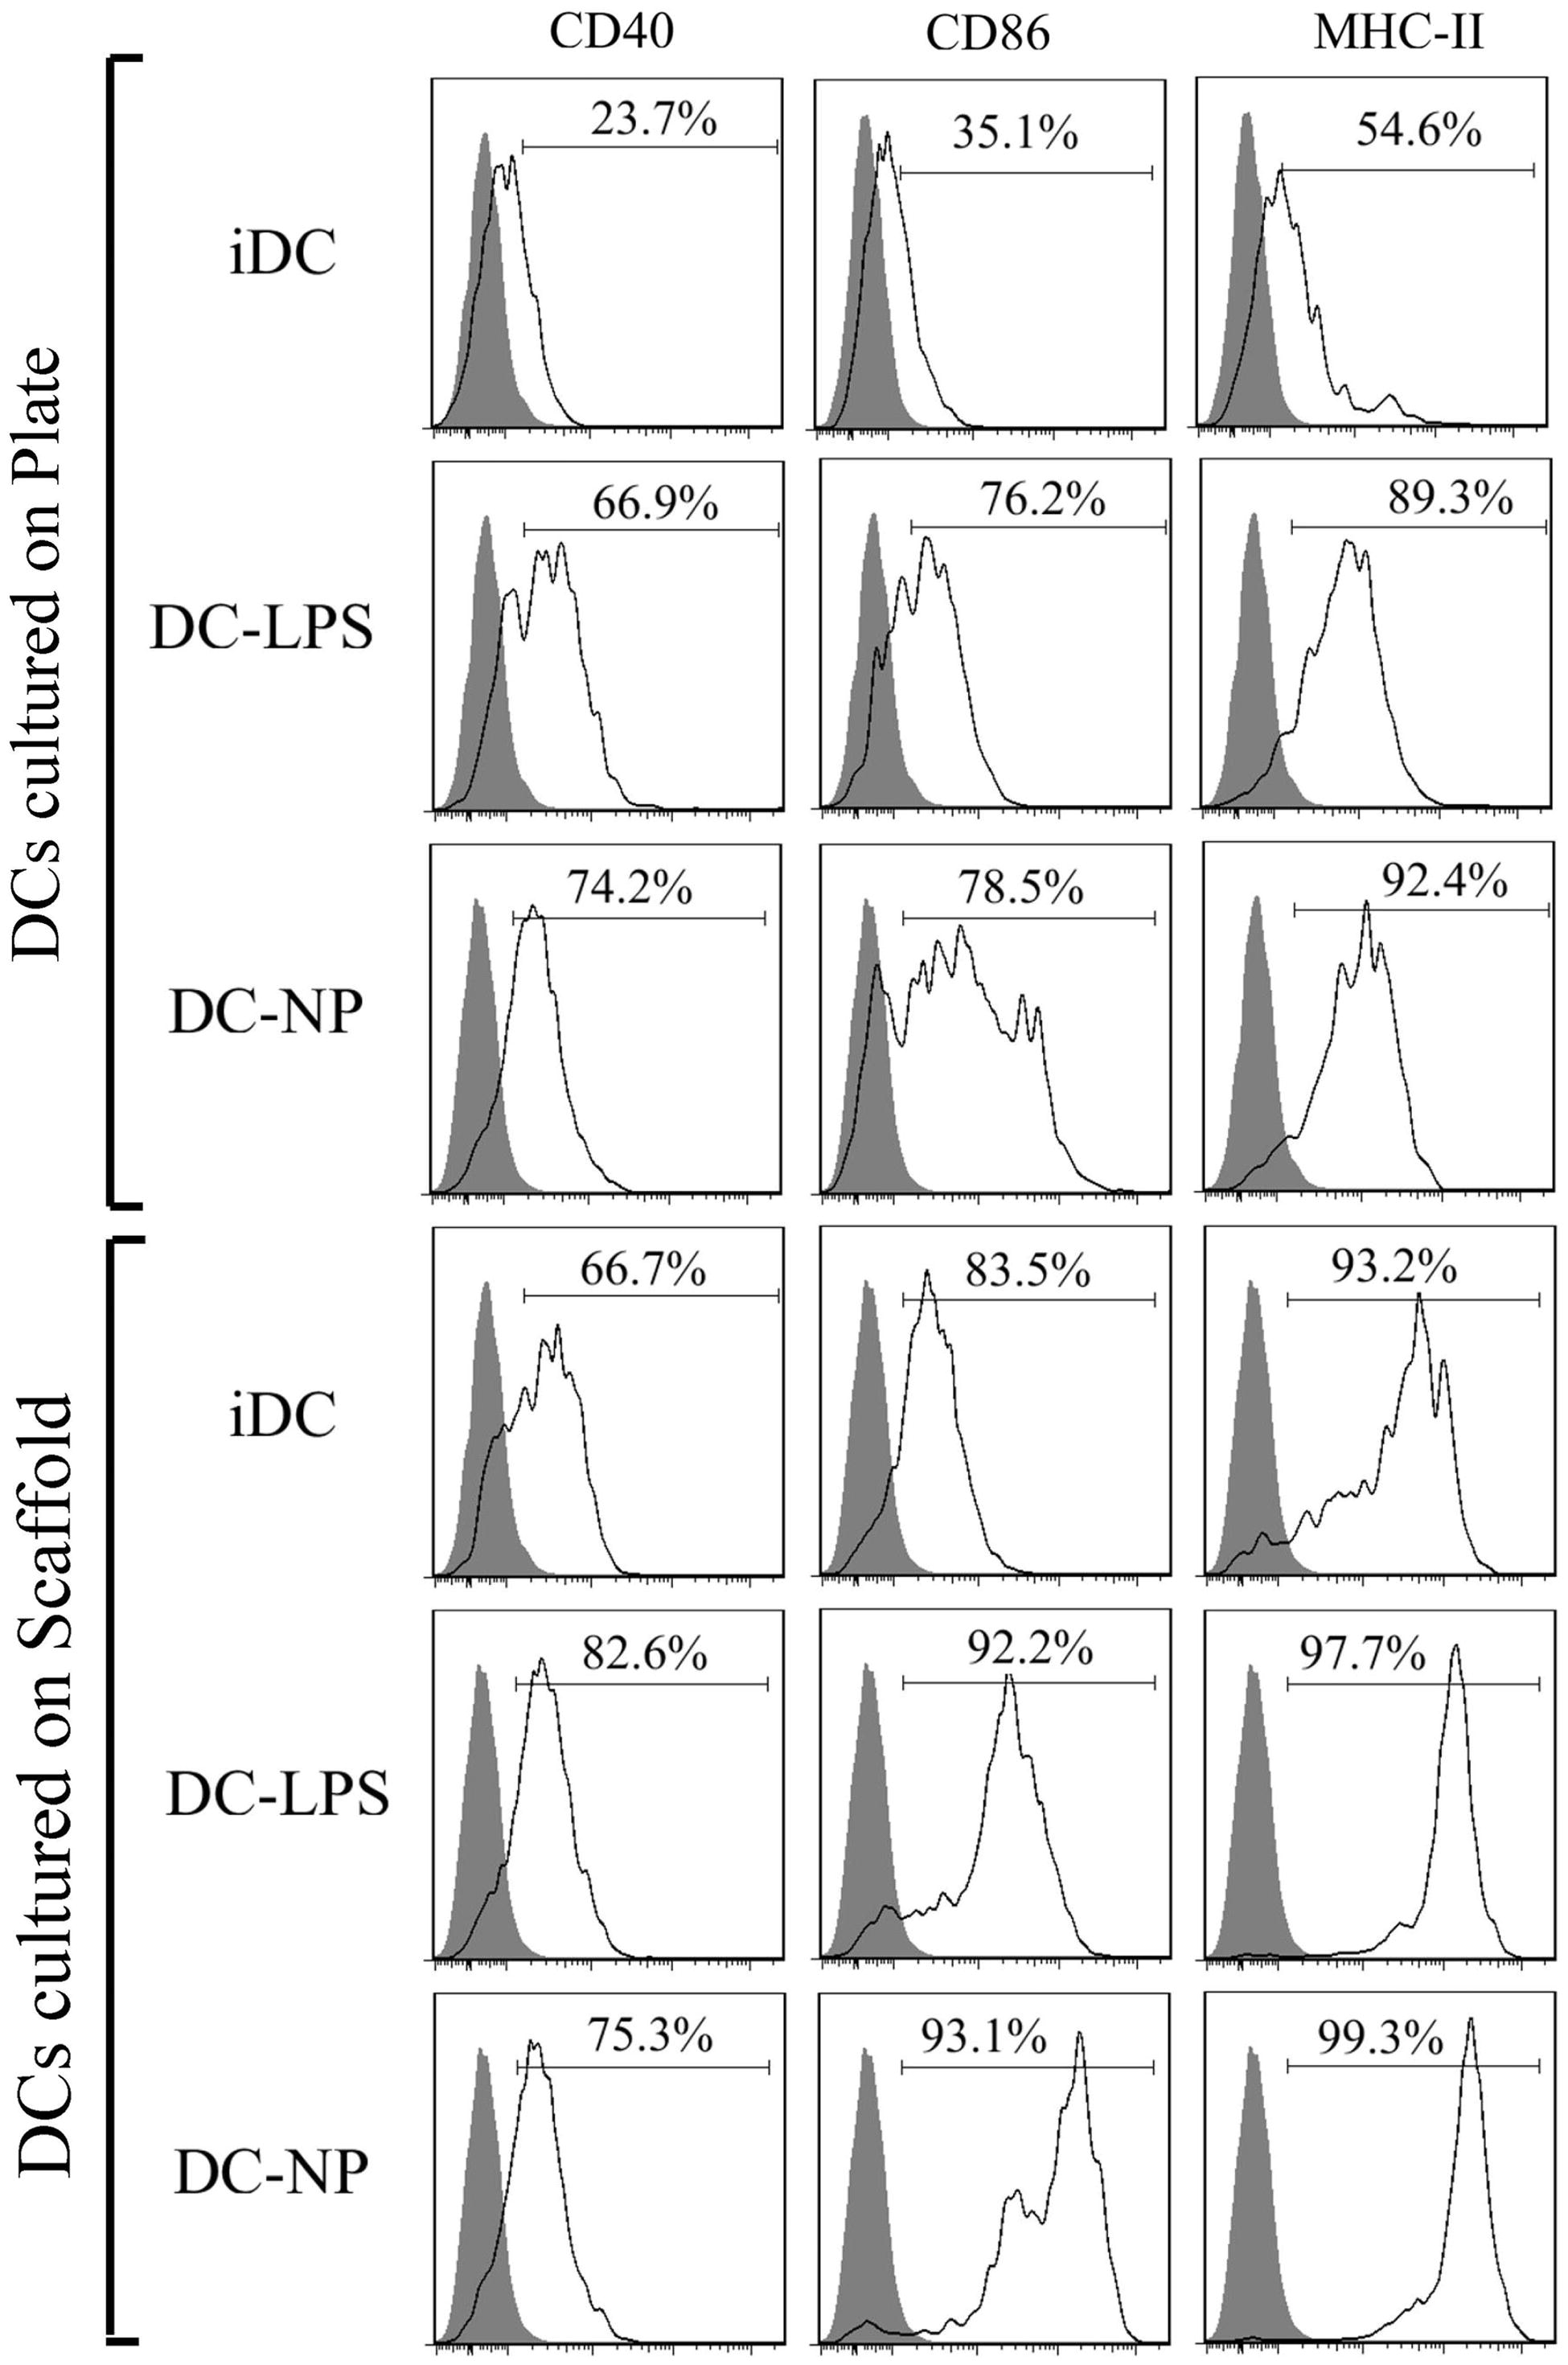
DC maturation marker expression
After 24 h of culture on 3D collagen-chitosan scaffolds or 2D plates, CD40, CD86 and MHC-II maturation marker expression was evaluated on the DC (). Analyses were also performed on DC exposed to LPS or DNA/chitosan NP. Flow analyses revealed that expression of CD40, CD86 and MHC II on cells held on the scaffolds was accelerated in comparison to that on cells maintained in the 2D systems. Among cells held on the 3D scaffolds, DC expressed higher levels of each marker in comparison to that of the untreated DC in the 2D culture plates. In the plate system, both LPS- and DNA/chitosan NP-treated DC expressed higher levels of the markers compared to control DC. Oddly, within the 3D system, while the intensities of CD86 and MHC II expression on the NP-treated DC were significantly higher than on LPS-treated cells (MFI for DC-NP/DC-LPS: 13823 [± 1242]/3016 [± 412] for CD86 and 22046 [± 3426/14136 [± 2468] for MHC-II), CD40 expression was not significantly different due to treatment (MFI for DC-NP vs DC-LPS, 330 [± 52] vs 368 [± 61]).
Figure 3. Flow cytometric analysis of cultured DC maturation marker expression. Expression of CD40, CD86 and MHC II on cells maintained on 3D chitosan scaffolds (scaff) were accelerated in comparison to on cells maintained in 2D culture plates (plate).
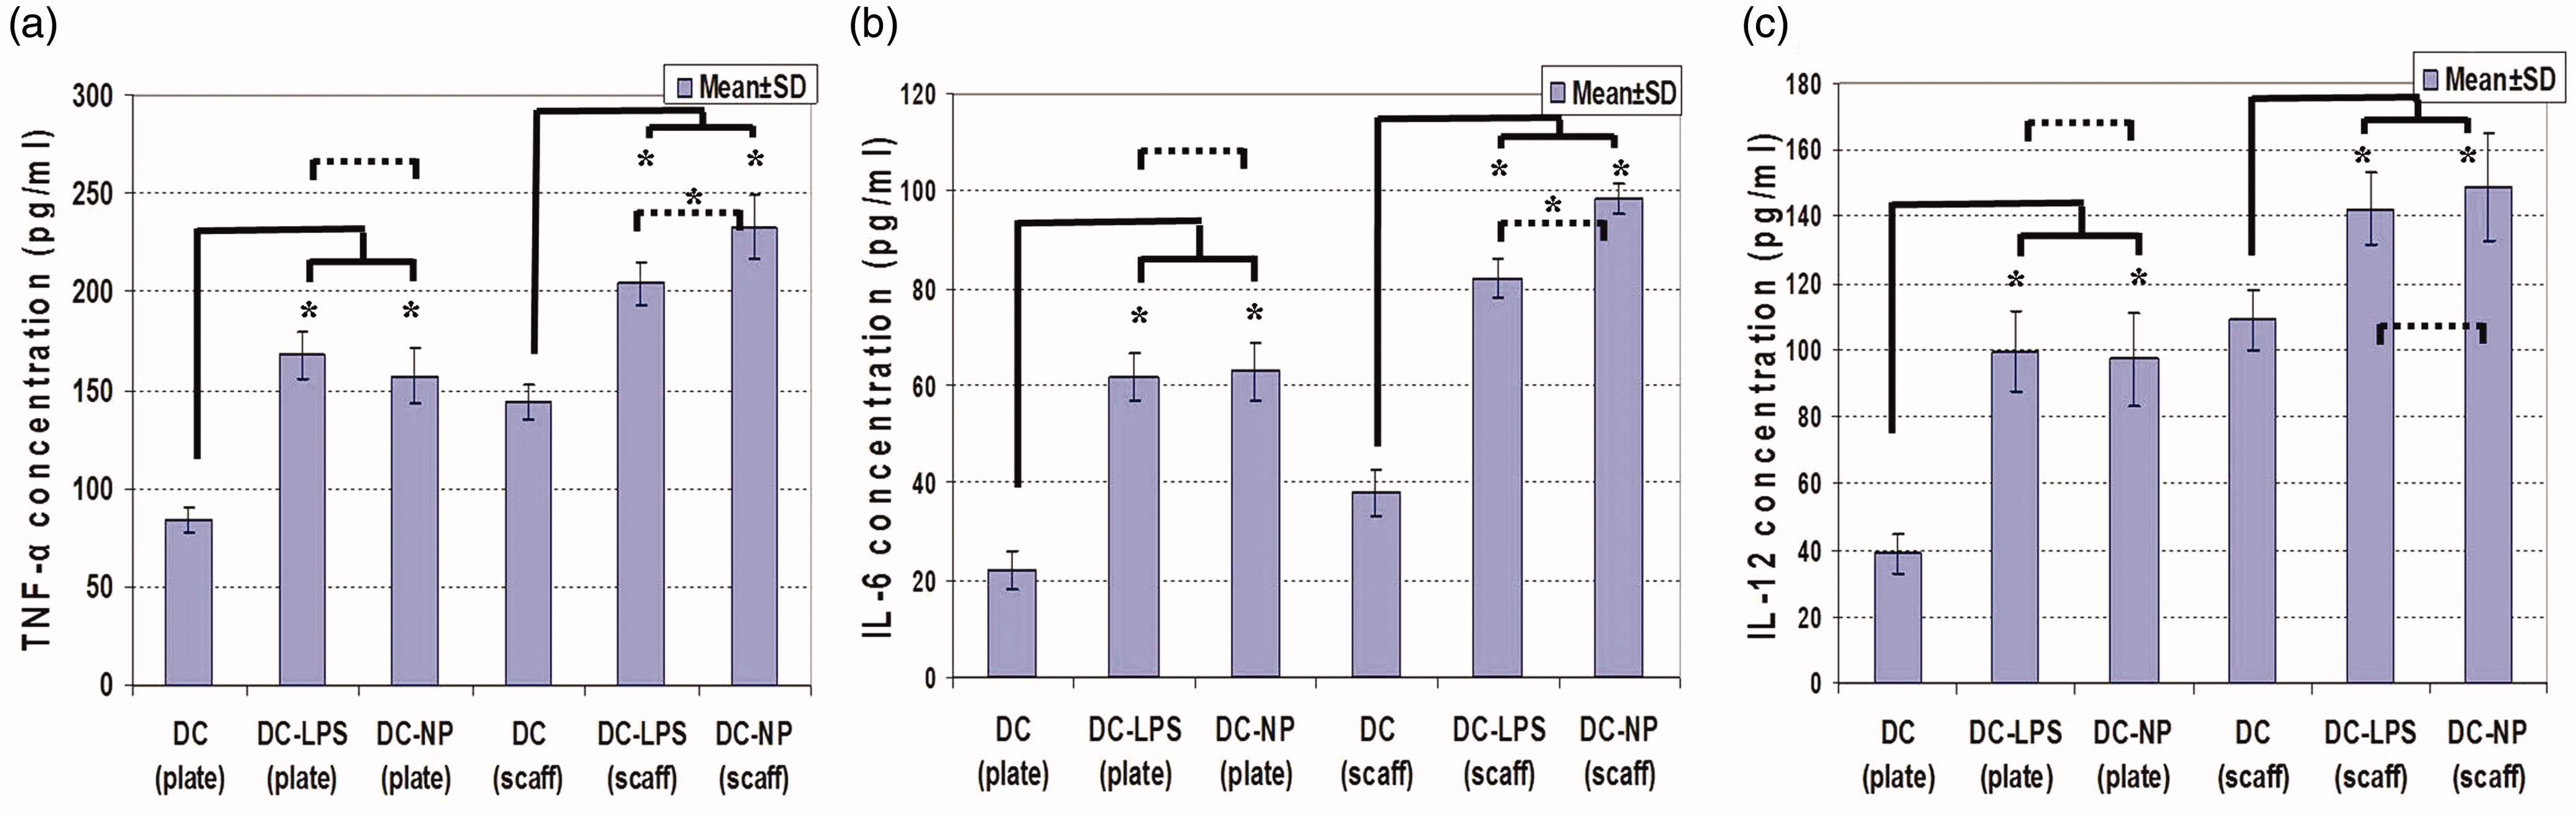
DC cytokine production
To evaluate effects of the two systems on the secretory capacities of cultured DC, release of TNFα, IL-6 and IL-12 was assessed (). In general, formation of all three cytokines was enhanced in cells maintained on the 3D collagen-chitosan system relative to that by the cells maintained in the 2D plate cultures (p < 0.05). In the 2D system, use of LPS and DNA/chitosan NP treatment led to significant increases in DC production of all three cytokines, although the effects of each on a given cytokine did not significantly different from one another (means of LPS/NP vs control: 162.54 [± 13.62] vs 84.15 [± 6.65] ng TNFα/ml; 62.46 [± 5.52] vs 22.32 [± 4.42] ng IL-6/ml; and 98.45 [± 13.12] vs 39.14 [± 6.21] ng IL-12/ml). In the 3D system, while both LPS and the NP caused significant increases above control levels of production of all three cytokines, the use of the DNA/chitosan NP resulted in higher production of TNFα and IL-6 compared to that induced by the LPS (DC-LPS vs DC-NP vs DC control: 204.23 [± 11.31] vs 232.96 [± 16.24] vs 144.58 [± 9.66] ng TNFα/ml and 82.31 [± 4.43] vs 98.54 [± 3.26] vs 38.44 [± 5.74] ng IL-6/ml) (p < 0.05). IL-12 formation was relatively equally induced by the NP and LPS compared to that by the control DC (means of LPS/NP vs control: 145.65 [± 13.54] vs 109.76 [± 9.58] ng IL-12/ml).
Figure 4. Cytokine release from DC maintained in 2D culture plates (plate) and 3D scaffolds (scaff) systems and treated with LPS or DNA/chitosan NP. (a) TNFα, (b) IL-6, (c) IL-12. *Significant differences between groups are indicated (p < 0.05).
Mixed-leukocyte reaction
To evaluate the functional potency of cultured DC, cells were co-cultured for 72 h with allogenic T-lymphocytes using the 2D and 3D conditions. Microscopic evaluations demonstrated active interaction of the cells (). As seen in , SI values for the lymphocytes indicated DC-T-lymphocyte interactions on the 3D collagen-chitosan scaffold were more accelerated in comparison to those on the 2D plates (SI for untreated DC in 3D vs 2D conditions: 1.43 [± 0.05] vs 1.22 [± 0.04]; p < 0.05). DC treated with LPS and NP displayed different proliferation patterns under the 2D and 3D conditions. In the 2D cultures, both LPS and DNA/chitosan NP activated DC abilities to trigger T-lymphocyte proliferation. However, in the 3D collagen-chitosan system, LPS treatment induced significantly (p < 0.05) lower proliferation rates of the lymphocytes compared to that induced among those cells by DNA/chitosan NP-treated DC and even by the unstimulated DC.
Figure 5. DC-T-lymphocyte interactions: proliferation in a mixed-leukocyte reaction. Representative microscopy images: (a1) DC alone. (a2) DC-T-lymphocyte interactions; starting point. DC-T-lymphocyte interactions in (a3) low- and (a4) high-proliferation fields. (b) T-lymphocyte proliferation in comparison to controls (T-lymphocytes alone; Stimulation Index (SI) = 1.0). Values shown are mean [± SD] SI values in cells maintained in 3D scaffold (scaff) vs 2D culture plates (plate) systems. *Significant differences between groups are indicated (p < 0.05).
![Figure 5. DC-T-lymphocyte interactions: proliferation in a mixed-leukocyte reaction. Representative microscopy images: (a1) DC alone. (a2) DC-T-lymphocyte interactions; starting point. DC-T-lymphocyte interactions in (a3) low- and (a4) high-proliferation fields. (b) T-lymphocyte proliferation in comparison to controls (T-lymphocytes alone; Stimulation Index (SI) = 1.0). Values shown are mean [± SD] SI values in cells maintained in 3D scaffold (scaff) vs 2D culture plates (plate) systems. *Significant differences between groups are indicated (p < 0.05).](/cms/asset/d30823e5-439b-4575-b8f7-012437c2002c/iimt_a_1045636_f0005_c.jpg)
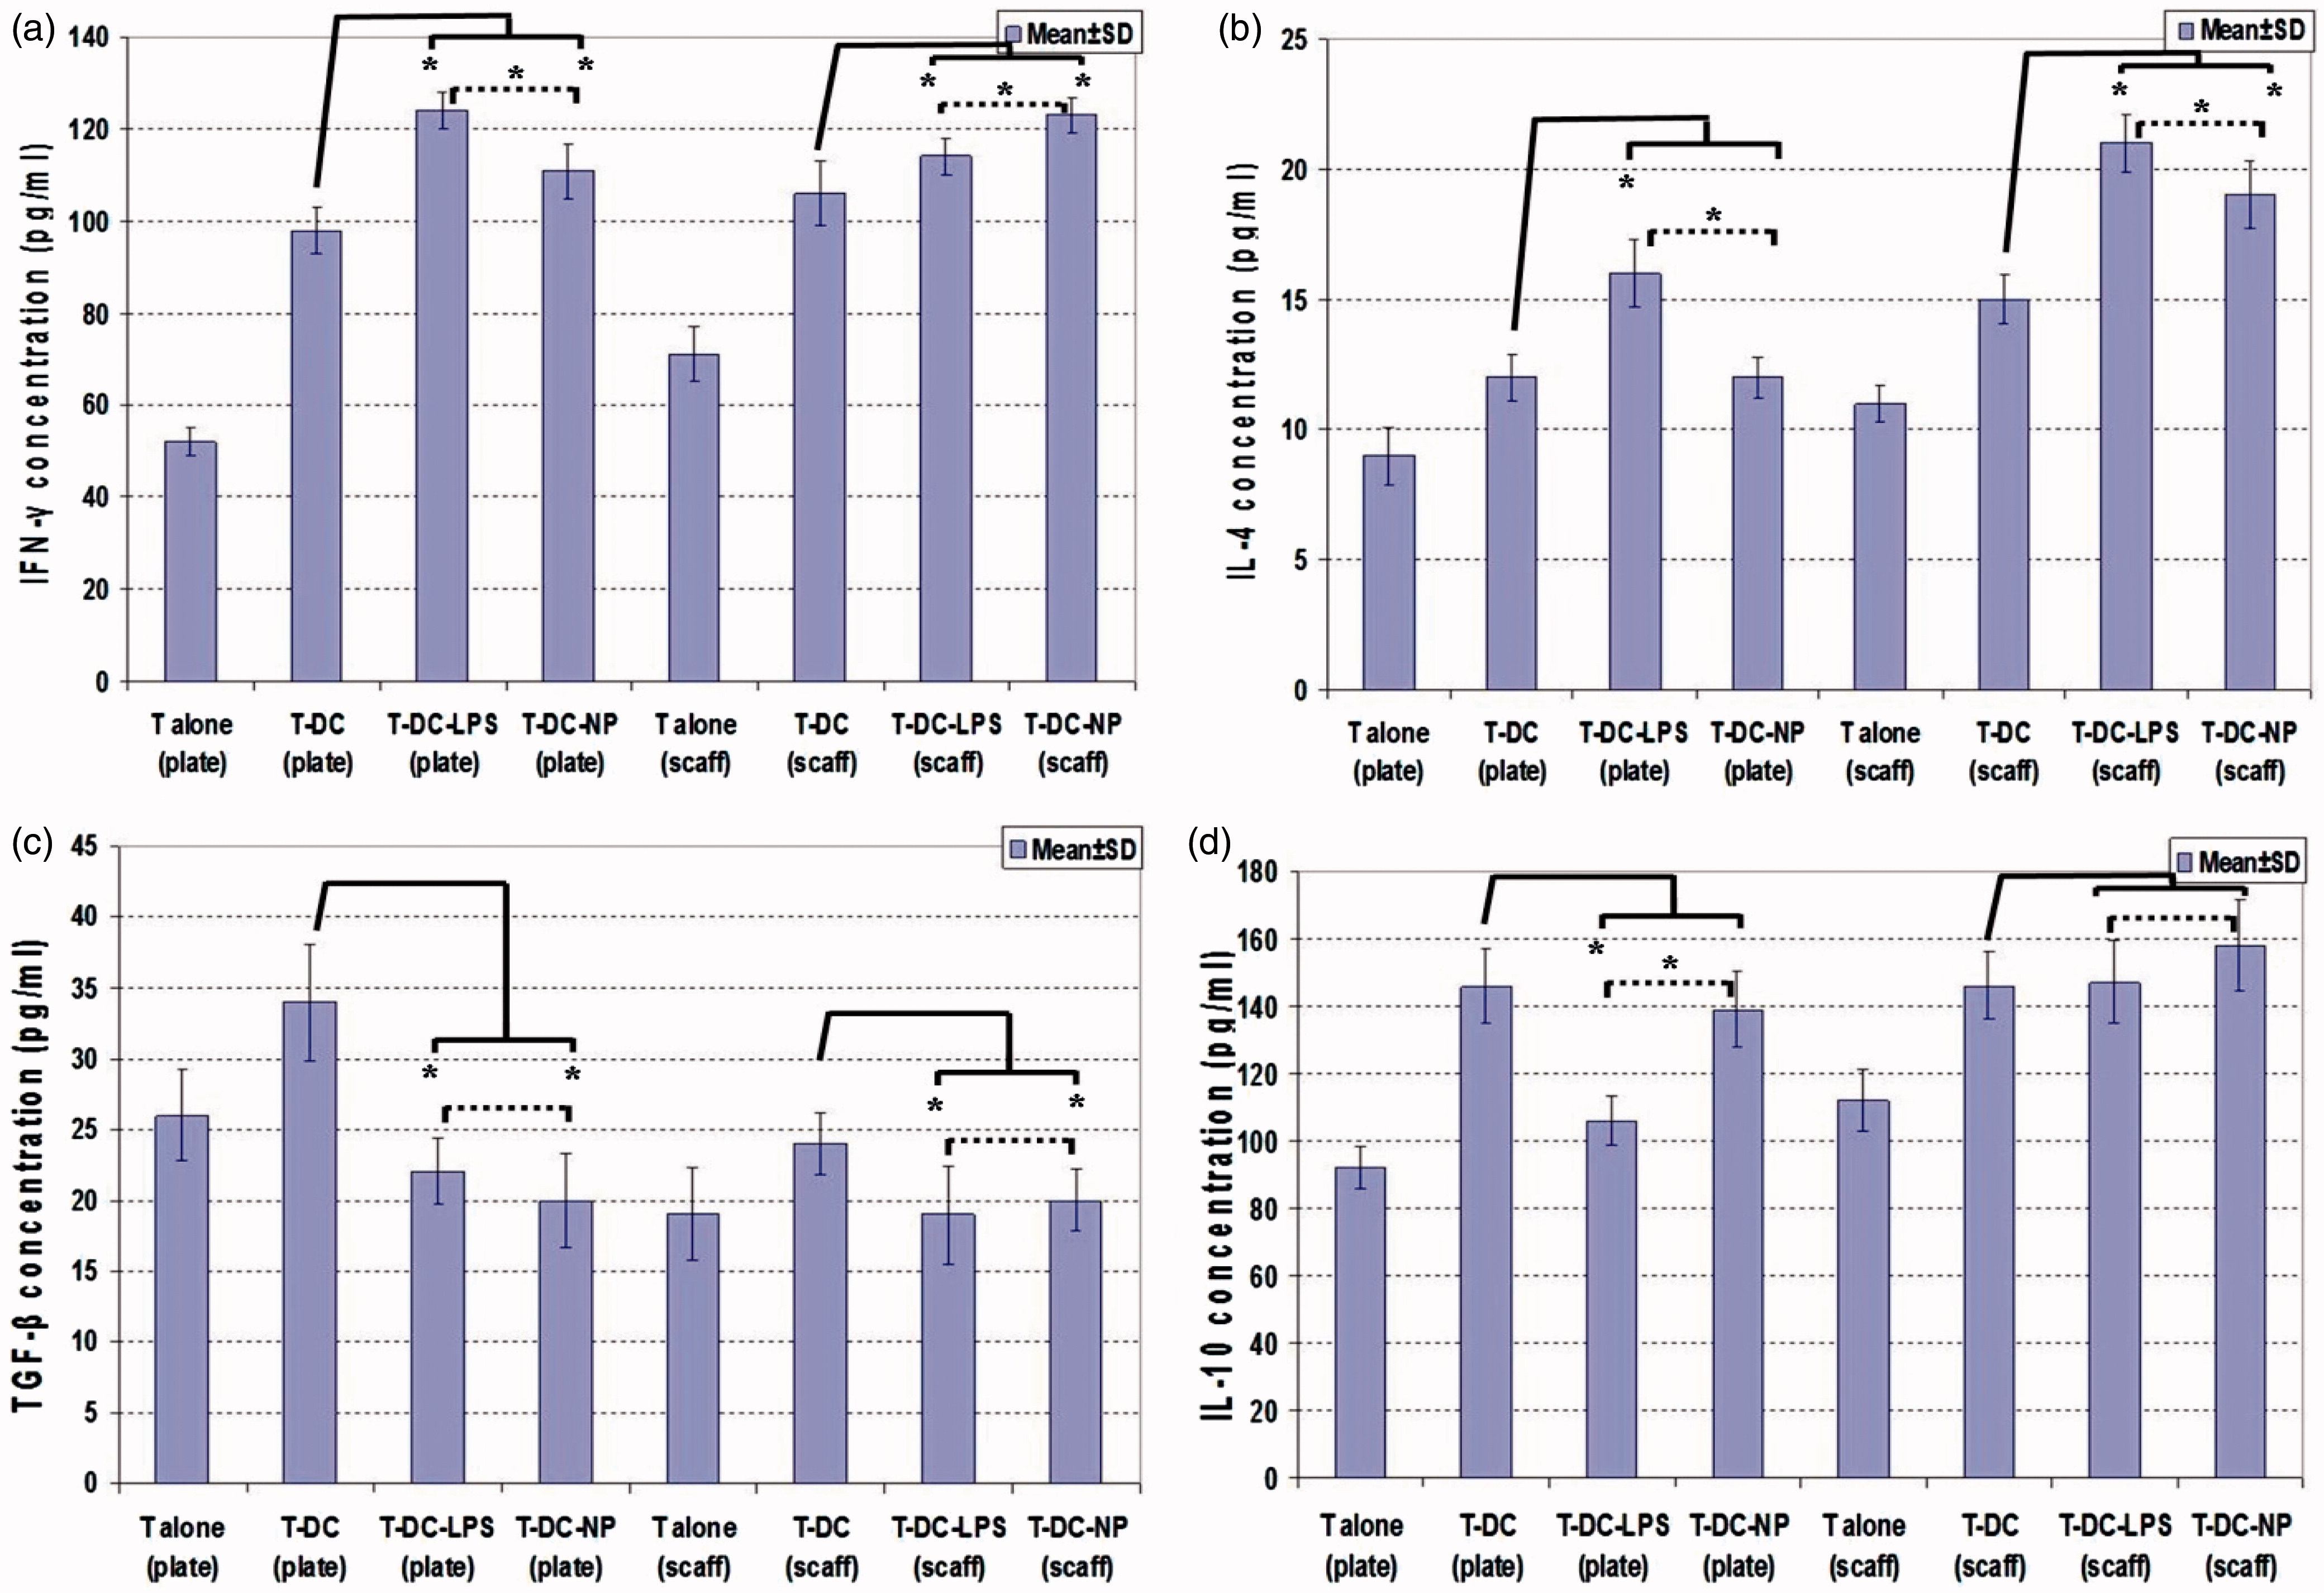
T-lymphocyte cytokine release in DC co-cultures
The impact of the 2D and 3D systems on DC ability to activate T-lymphocytes was also assessed via measures of IFNγ, IL-4, TGFβ and IL-10 produced during co-cultures (). Comparison of untreated DC-T-lymphocyte interactions in the 2D vs 3D systems indicated that IFNγ (98.32 [± 5.26] [2D] vs 106.41 [± 7.54] [3D] ng/ml) and IL-4 (12.63 [± 0.92] [2D] vs 15.44 [± 0.96] [3D] ng/ml) release was induced, but that TGFβ (34.35 [± 4.12] [2D] vs 24.27 [± 2.15] [3D] ng/ml) production was suppressed in the 3D system (p < 0.05). Analysis of treatments also showed that LPS or NP treatment of DC induced IFNγ and IL-4 release and suppression of TGFβ production (p < 0.05). In the 2D system, LPS treatment caused suppression of IL-10 production (DC-T vs DC-LPS-T: 146.28 [± 11.24] vs 106.55 [± 7.12] ng/ml), but IL-10 release was not suppressed in the presence of DNA/chitosan NP (DC-T vs DC-NP-T: 146.28 [± 11.24] vs 139.62 [± 11.24] ng/ml). In the 3D collagen-chitosan scaffold system, IL-10 release was not suppressed in the presence of LPS or DNA/chitosan NP (DC-T vs DC-LPS-T vs DC-NP-T: 147.74 [± 10.19] vs 148.12 [± 12.34] vs 158.41 [± 13.65] ng IL-10/ml).
Figure 6. T-Lymphocyte cytokine release during co-cultures with DC in 3D scaffold (scaff) vs 2D culture plates (plate) systems. (a) IFNγ. (b) IL-4. (c) TGFβ. (d) IL-1. *Significant differences between groups are indicated (p < 0.05).
Discussion
Dendritic cells (DC) play a central role in activating naïve T-lymphocytes and guiding immune response towards T-helper (TH)-1, TH2, TH17 or T-regulatory (Treg) cell profiles (de Jong et al., Citation2005; Steinman & Cohn, Citation1973). DC are distributed throughout the body, but are especially prevalent in peripheral tissues where antigen capture can occur. After the capture, the immature DC (iDC) migrate to lymph nodes; during migration, iDC may differentiate to mature DC that present antigens to T-lymphocytes (Banchereau et al., Citation2000). All these steps happen within a three-dimensional (3D) context in the body; thus, any research involving DC should be done with consideration of the impact of the natural 3D microenvironment on the function of these cells. In the present study, DC functions in 3D chitosan-collagen scaffolds cultures were evaluated. Physiochemical evaluation of the scaffolds created/used here indicated the chitosan-collagen systems had suitable properties for use in cell culture. For example, the scaffolds had an appropriate ability to absorb water and swell and had a long stability. Electronic microscopy evaluations demonstrated a porous surface that allowed cells to integrate into the pores.
Evaluation of DC viability on these platforms showed the system imparted no significant cytotoxic effect. A low toxicity among cells cultured on chitosan/collagen nanoscaffolds has been noted in other studies on culture of bone (Levengood & Zhang, Citation2014), cartilage (Gong et al., Citation2010), skin (Sarkar et al., Citation2013), intestinal smooth muscle (Zakhem et al., Citation2012) and endothelial cells (Swarnalatha et al., Citation2013).
To evaluate changes effects of the scaffold system on potential functional potency of DC, maturation markers and cytokine secretion by the cells were analyzed under different culture conditions. Overall, CD40, CD86 and MHC II marker expression and TNFα, IL-6 and IL-12 secretion were enhanced in 3D collagen-chitosan cultures compared to among cells maintained under traditional 2D (culture plate) conditions. Previous studies also reported chitosan effects on DC phenotype and functions. A study showed that chitosan-TPP induced DC maturation (Mofazzal-Jahromi et al., 2014). Another study evaluating different biomaterial films of alginate, agarose, chitosan, hyaluronic acid (HA) or 75:25 poly(lactic-co-glycolic acid) (PLGA) effects on DC showed there were different levels of functional changes in DC phenotypes depending on the type of biomaterial films used. Culture of DC on chitosan films supported DC maturation (increases in expression of CD80, CD86, CD83, HLA-DQ and CD44 compared with that on iDC) and also higher levels of DC pro-inflammatory cytokine release compare to that by iDC (Park & Babensee, Citation2012).
The current study also examined the effects of LPS and chitosan/DNA nanoparticles (NP) on DC maintained in the 3D vs 2D conditions. Cultured DC displayed appropriate DNA/chitosan NP uptake. It has been shown that DNA delivery efficacy of chitosan to DC could be more than the efficiency seen when using lipofectamine2000 (Chen et al., Citation2012). In those studies, microscopy revealed that chitosan/DNA NP could effectively help DNA enter into the DC cytoplasm and finally into the nucleus (Chen et al., Citation2012). Other studies also showed the capacity of DNA/chitosan NP to enhance DC function, including cytokine secretion. Kim et al. (Citation2006) reported that mannosylated chitosan/IL-12 gene complexes could induce IL-12 p70 and IFNγ secretion (Kim et al., Citation2006). In the present study, although the 3D collagen-chitosan system and DNA/chitosan NP effectively enhanced DC activation, it was surprising that LPS – as a main activator of DC – had a lower activation potency when the cells were maintained on the3D scaffolds. This latter outcome is not completely unexpected. Qiao et al. (Citation2010) reported that chitosan oligosaccharides could suppress LPS binding to TLR4/MD-2 receptor complexes, thereby attenuating activation of mitogen-activated protein kinases (MAPKs) and leading to decreased nuclear translocation of nuclear factor-κB (NF-κB). Those authors concluded that chitosan oligosaccharides could in fact serve as potential inhibitors of LPS-inducible release of pro-inflammatory mediators like IL-1 and nitric oxide (NO) from macrophages.
In the current study, more than the inducibility of changes in DC phenotype and cytokine release was affected by the chitosan. Specifically, the ability of the DC to trigger allogenic T-lymphocyte proliferation was also impacted by the 3D system as well as the DNA/chitosan NP. Proliferation patterns of lymphocytes in the 3D systems were interesting in that LPS stimulation of the DC maintained on the chitosan/collagen scaffolds led to reduced DC ability to trigger T-lymphocyte expansion while the NP enhanced the DC effect. Previous studies using chitosan-TPP-treated DC showed those cells to be efficient inducers of T-lymphocyte proliferation in mixed leukocyte reaction (Mofazzal-Jahromi et al., Citation2014). Another study also showed that 3D Biotek scaffold enabled interactions between lymphocytes and DC at different stages of maturation (Steponavicius-Cruz et al., Citation2013).
Analyses here of the T-lymphocyte cytokine secretion activity in the 3D collagen-chitosan system (after both LPS and NP treatments) indicated there was a strong induction of IFNγ and IL-4 release, but a suppression of TGFβ production. It has been shown by others that chitosan scaffolds could provide a suitable 3D microenvironment that mimics T-lymphocyte functions (Phan-Lai et al., Citation2014). Other studies also reported that a microparticulate form of chitosan enhanced antigen (i.e. ovalbumin, OVA) uptake, processing and presentation by bone marrow-derived DC (BMDC) and that targeting OVA toward DC using chitosan formulations ultimately led to increased antigen-specific induction of T-lymphocyte proliferation and IFNγ secretion in vitro, as well as T cell priming in vivo (Saint-Lu et al., Citation2009).
Conclusions
In the present study, DC phenotypes, functions and interactions with allogeneic T-lymphocytes were evaluated on collagen-chitosan 3D nano-scaffolds in comparison to on 2D plates. The effects of the systems on DC stimulation with LPS and DNA/chitosan NP were also assessed. The results showed that DC displayed enhanced stimulatory phenotype and function on 3D collagen-chitosan scaffolds. The studies also showed that, while DNA/chitosan NP induced DC functions, the activation of DC by LPS was affected by use of the chitosan/collagen-chitosan scaffolds. These data suggest a more pro-inflammatory and activated potency for DC that are maintained on scaffolds (3D conditions) in comparison to when they are cultured under routine 2D scenarios in vitro. The implications from these shifts in DC functionality as to practicality of the use of these types of scaffolds by researchers, as well as whether these truly represent states of these cells in situ (in 3D microenvironments), are currently the focus of our ongoing studies.
Declaration of interest
This work was supported by a grant from Tarbiat Modares University. The authors report no conflicts of interest. The authors alone are responsible for the content and writing of the paper.
Acknowledgments
The authors are grateful to the Department of Immunology of Tarbiat Modares University for financial support.
References
- Alberts, B., Bray, D., Hopkin, K., et al., (Eds.). 2010. Essential Cell Biology. New York/London: Garland Science
- Banchereau, J., Briere, F., Caux, C., et al. 2000. Immunobiology of dendritic cells. Annu. Rev. Immunol. 18:767–811
- Chen, Y., Yao, X., Ruan, G., et al. 2012. Gene-carried chitosan-linked polyethylenimine induced high gene transfection efficiency on dendritic cells. Biotechnol. Appl. Biochem. 59:346–352
- de Jong, E. C., Smits, H. H., and Kapsenberg, M. L. 2005. Dendritic cell-mediated T-cell polarization. Springer Semin. Immunopathol. 26:289–307
- Dudek, A. M., Martin, S., Garg, A. D., and Agostinis, P. 2013. Immature, semi-mature, and fully mature dendritic cells: Toward a DC-cancer cell interface that augments anti-cancer immunity. Front. Immunol. 4:438
- Gong, Z., Xiong, H., Long, X., et al. 2010. Use of synovium-derived stromal cells and chitosan/collagen type I scaffolds for cartilage tissue engineering. Biomed. Mater. 5:055005
- Hayashi, Y., Yamada, S., Yanagi-Guchi, K., et al. 2012. Chitosan and fish collagen as biomaterials for regenerative medicine. Adv. Food. Nutr. Res. 65:107–120
- Kim, T. H., Jin, H., Kim H., et al. 2006. Mannosylated chitosan nanoparticle-based cytokine gene therapy suppressed cancer growth in BALB/c mice bearing CT-26 carcinoma cells. Mol. Cancer Ther. 5:1723–1732
- Lahiji, A., Sohrabi, A., Hungerford, D. S., and Frondoza, C. G. 2000. Chitosan supports expression of extracellular matrix proteins in human osteoblasts and chondrocytes. J. Biomed. Mater. Res. 51:586–595
- Lee, J., Cuddihy, M. J., and Kotov, N. A. 2008. Three-dimensional cell culture matrices: State of the art. Tissue Eng. Part B Rev. 14:61–86
- Levengood, S. L., and Zhang, M. 2014. Chitosan-based scaffolds for bone tissue engineering. J. Mater. Chem. B. Mater. Biol. Med. 2:3161–3184
- Li, G., Zhang, L., Wang, C., et al. 2014. Effect of silanization on chitosan porous scaffolds for peripheral nerve regeneration. Carbohydrate Polymers 101:718–726
- Ma, L., Gao, C., Mao, Z., et al. 2003. Collagen/chitosan porous scaffolds with improved biostability for skin tissue engineering. Biomaterials 24:4833–4841
- Mofazzal-Jahromi M. A., Karimi, M., Azadmanesh, K., et al. 2014. The effect of chitosan-tripolyphosphate nanoparticles on maturation and function of dendritic cells. Comp. Clin. Pathol. 23:1421–1427
- Mori, T., Irie, Y., Nishimura, S. I., et al. 1998. Endothelial cell responses to chitin and its derivatives. J. Biomed. Mater. Res. 43:469–472
- Mori, T., Okumura, M., Matsuura, M., et al. 1997. Effects of chitin and its derivatives on the proliferation and cytokine production of fibroblasts in vitro. Biomaterials 18:947–951
- Park, J., and Babensee, J. E. 2012. Differential functional effects of biomaterials on dendritic cell maturation. Acta Biomater. 8:3606–3617
- Phan-Lai, V., Kievit, F., Florczyk, S., et al. 2014. CCL21 and IFNγ recruit and activate tumor specific T-cells in 3D scaffold model of breast cancer. Anticancer Agents Med. Chem. 14:204–210
- Qiao, Y., Ruan, Y., Xiong, C., et al. 2010. Chitosan oligosaccharides suppressant LPS binding to TLR4/MD-2 receptor complex. Carbohydrate Polymers 82:405–411
- Ragetly, G., Griffon, D. J., and Chung, Y. S. 2010. Effect of Type II collagen coating of chitosan fibrous scaffolds on mesenchymal stem cell adhesion and chondrogenesis. Acta Biomater. 6:3988–3997
- Saint-Lu, N., Tourdot, S., Razafindratsita, A., et al. 2009. Targeting the allergen to oral dendritic cells with muco–adhesive chitosan particles enhances tolerance induction. Allergy 64:1003–1013
- Sarkar, S. D., Farrugia, B. L., Dargaville, T. R., and Dhara, S. 2013. Chitosan-collagen scaffolds with nano/microfibrous architecture for skin tissue engineering. J. Biomed. Mater. Res. A 101:3482–3492
- Steinman, R. M., and Cohn, Z. A. 1973. Identification of a novel cell type in peripheral lymphoid organs of mice. I. Morphology, quantitation, tissue distribution. J. Exp. Med. 137:1142–1146
- Steponavicius-Cruz, K., Freitas, V. M., Alexandre, J., and Barbuto, M. 2013. Dendritic cells and T-lymphocytes interactions in a novel 3D System. Procedia Engineer. 59:166–173
- Swarnalatha, B., Nair, S. L., Shalumon, K. T., et al. 2013. Poly (lactic acid)-chitosan-collagen composite nanofibers as substrates for blood outgrowth endothelial cells. Int. J. Biol. Macromol. 58:220–224
- Tel, J., Anguille, S., Waterborg, C. E., et al. 2014. Tumoricidal activity of human dendritic cells. Trends Immunol. 35:38–46
- Wang, X., Li, D., Wang, W., et al. 2003. Cross-linked collagen/chitosan matrix for artificial livers. Biomaterials 24:3213–3220
- Zakhem, E., Raghavan, S., Gilmont, R. R., and Bitar, K. N. 2012. Chitosan-based scaffolds for the support of smooth muscle constructs in intestinal tissue engineering. Biomaterials 33:4810–4817