
Abstract
Calcined Serpentine (CS) is used in various formulations of alternative systems of medicine as a tonic to vital organs and as an anti-inflammatory agent. The process of calcination or incineration is believed to render non-toxic, gently absorbable, adaptable and digestible properties to the mineral compounds. The present study characterized CS and also evaluated its immunostimulatory potential. CS was characterized by using transmission electron microscopy (TEM), X-ray powder diffraction, atomic absorption spectroscopy and CHNS analysis. The characterized CS was further evaluated for its immunomodulatory potential in Swiss mice. X-Ray diffraction analysis revealed that the CS contained silicates of magnesium, calcium and iron as major minerals. Elemental composition and heavy metal analyses showed a presence of various inorganic elements/heavy metals, albeit at levels well below daily permissive intake values. TEM analysis of the test CS revealed a presence of nano particles with an average size of 10–20 nm (≈ 26% of total material). Oral administration of CS to mice at 50, 75, 100 or 200 μg/kg body weight for 10 days led to enhanced levels of total IgG, IgG1, IgG2a and IgG2b in ovalbumin-immunized mice as well as ex vivo lymphocyte proliferation and levels of TH1 (IL-2, IFNγ) and TH2 (IL-4, IL-10) cytokines produced by their cultured splenocytes. Similarly, CS treatment resulted in enhanced delayed-type hypersensitivity responses in GRBC-primed hosts. CS also activated host peritoneal macrophages, as indicated by increases in phagocytic activity and in TLR-2, CD80 and CD86 expression. The CS did not affect liver, kidney and spleen histology. Taken together, the results indicated that absorbed CS was stimulatory of host cell-mediated immune responses. It is hypothesized for now that the immunomodulatory effect of CS may have been due, in part, to a presence of nanoparticles on the CS; further study is required to validate this viewpoint.
Introduction
Formation of nano-materials leads to modifications including solubility, stability, multi-functionality and immunogenicity in the properties of therapeutic agents (Cario Citation2012). It has been reported that nanoparticles (NP) may be engineered to either avoid immune system recognition or specifically inhibit/enhance immune responses (Zolnik et al. Citation2010). Efforts have been progressively made to translate nanotechnology into the field of immunology, especially for use in the development of new-generation adjuvants and immunomodulants (Smith et al. Citation2013).
In this regard, novel biological NP formed by calcination of metallic and mineral compounds that could be used in traditional pharmaceutical preparations have received significant attention. Traditional calcination is an elaborate process wherein metals, metallic oxides, non-metals/their compounds or minerals and animal-origin drugs are oxidized by heat to yield a fine powdered product that is believed to enhance the efficiency of known drugs (Said Citation1997). The importance of NP as therapeutic agents lies in their ability to enhance effects of drugs in hosts (Tariq et al. Citation2013). There is some literature that proved that the presence of NP in traditional pharmaceutic preparations promoted biological effects (Wadekar et al. Citation2005; Bhowmick et al. Citation2009; Singh et al. Citation2010). Examples of this have included gold ash globular particles (size ≈ 57 nm) and mercury compounds (bearing mercury sulfide) with 25–50 nm diameters (Bhowmick et al. Citation2009).
Serpentine (S) – also known as “Bezoar” stone – is a common mineral comprised of magnesium silicate and often found associated with olivine, various pyroxenes and amphiboles. Calcined Serpentine (CS) is prepared by purification and cleaning of the parent material and then the powder is burned in closed crucible pits with different heat intensities. This calcined powdered drug is then called calx (National Formulation of Unani Medicine Citation2001). This calcined form of Serpentine has been used in many ancient medical systems. Historically, it has been prescribed as part of a tonic used for the treatment of measles, smallpox, whooping cough and cholera (Nandkarni & Nandkarni Citation1989).
To date, specific analyses of the potential immunomodulatory effects of this material have not been reported in the literature. Thus, the present study was conducted to assess the physico-chemical properties of CS and evaluate immunomodulatory effects of CS in a mouse model.
Materials and methods
Chemicals and reagents
The CS used in these studies was a kind gift from the late Professor M. Khan (Department of Pharmaceutical Chemistry, Jamia Hamdard University, New Delhi, India). Ammonium chloride, potassium carbonate, o-phenylenediamine, hydrogen peroxide, phosphate buffer, trypan blue and dimethyl sulfoxide (DMSO) were each purchased from S.D. Fine Chemicals Ltd. (Mumbai, India). RPMI 1640 medium, fetal bovine serum (FBS), lipopolysaccharide (LPS, Type 055:B5 from Escherichia coli), ovalbumin, MTT [3-(4,5-dimethylthiazol-2-yl)-2,5-diphenyl-tetrazolium bromide], penicillin-streptomycin, Concanavalin A (ConA), horseradish peroxidase (HRP)-conjugated IgG antibody, and IgG antibody sub-type kits were all purchased from Sigma (St. Louis, MO). Alexafluor [AF]-647-labeled anti-mouse TLR-2, phycoerythrin (PE)-labeled anti-TLR-4 and anti-CD86, as well as fluorescein isothiocyanate (FITC)-labeled anti-CD80 antibodies were bought from BD Biosciences (San Diego, CA).
Analysis of CS
Samples of stock CS were prepared for transmission electron microscopic (TEM) analysis by dissolving a powdered sample in Milli-Q water. After filtration through Whatmann No. 1 filter paper, the filtrate was lyophilized. This filtrate contained 26% nanoparticles by weight of the original total CS weight. The lyophilized powder was again dissolved in Milli-Q water and then sonicated in an ultrasonic bath. The sonicate was transferred to a carbon film supported on a copper grid and images were taken in a JEM 2100F transmission electron microscope (JEOL Inc., Peabody, MA). X-ray diffraction analysis of the CS sample was also done to determine the presence of mineral compounds. The CS was scanned in a PAN analytical Make X-pert powder diffractometer (PANalytical, Singapore) and a 2 theta scan was done over the range of 10–100°.
To characterize the inorganic constituents in the CS, inductively-coupled plasma mass spectrometry (ICP-MS) in a NexION 300D ICP-MS system (Perkin Elmer, Boston, MA) was performed using the method of Elahi et al. (Citation2014). Similarly, the levels of heavy metals like lead, arsenic, cadmium and mercury in the CS were determined using Atomic Absorption Spectroscopy (AAS) in a ZeeNit 65 AAS system (Analytik, Jena, Germany) at the Agri Food Testing Laboratory in the Punjab Biotechnology Incubator (Mohali, Punjab, India).
Quantitative CHNS (carbon, hydrogen, nitrogen, sulfur) analysis of the CS was carried out using a Vario EL III CHNS elemental analyzer (Elementar Analysensysteme, Hanau, Germany) with a sulfanilic acid standard. For this, CS sample and standard were weighed and packed into tin boats that were then automatically lowered into a combustion tube at temperatures of up to 1200 °C. Concentrations of various elements in the samples were then calculated using the built-in software (Etherington et al. Citation2001).
Everted gut sac analysis
Everted gut sac analysis was performed (Yoshida et al. Citation2014) using small intestine isolated from fasted naïve Wistar rat. In brief, the small intestine was gently flushed with Krebs-Ringer buffer (KRB, pH 7.0) and then a 6–8 cm segment was removed and everted over a silicone tube. The bottom portion was tied with thread and the segment then filled with 0.6–0.8 ml KRB. The filled segment was then placed in 2.5 ml of either KRB (control group) or in a solution of CS (200 μg/ml) in KRB. The materials were incubated at 37 °C for 45 min after which solution on the serosal side was collected. Optical density of each solution was measured at 230 nm in an Optizen 3220 UV spectrophotometer (Mecasys, Daejon, South Korea) to determine the presence of CS.
Animals
Swiss mice (male, 6–8-weeks-old, 20–25 g) were obtained from the Institute Animal Facilities at Jamia Hamdard. All mice were housed in polypropylene cages at the pathogen-free Central Animal House Facility (Jamia Hamdard), in rooms maintained under constant temperature (21 ± 2 °C) and humidity (50%) and with a 12-h light:dark period. All mice had ad libitum access to a commercial pellet diet and filtered water. The Hamdard University Animal Ethics Committee approved all aspects of this study. This study conformed to the National Guidelines on the Care and Use of Laboratory Animals.
Treatments
In a preliminary study to determine the CS dose–response curve, various concentrations of CS were administered by oral gavage to mice for 10 days. The doses used were based on the content of CS normally found in Unani formulations. For those pilot studies, 0.5% sodium carboxymethyl cellulose (Na-CMC) was used as the vehicle. Effects on levels of IgM were analyzed in plaque-forming cell and hemagglutination titre assays (fully described in Khan et al. Citation2009). Both the Plaque-forming cell assay and hemagglutination titre assay are quick methods whose results are frequently used to ascertain whether there is any impact on immune response from a test agent; see Bin-Hafeez et al. (Citation2003) and Khan et al. (Citation2009).
Based on the pilot study results, doses of 50, 75, 100 and 200 μg/kg body weight were selected for use in the current study. For each of the studies outlined below, dedicated batches of mice were employed, with each treatment group containing five mice. Oral dosing of the mice was done daily for 10 days; Day 11 (24 h after final dosing) was considered as Day 0 in all subsequent protocols outlined below.
Effects of CS on humoral immunity-based response
Ovalbumin-specific IgG and IgG subclass levels in serum
Following completion of the exposures, on Day 0, dedicated sets of mice in each treatment group were immunized intramuscularly (IM) with 50 μg ovalbumin (OVA) that had been emulsified with complete Freund’s adjuvant (CFA). A booster dose (25 μg OVA in incomplete Freund’s adjuvant [IFA]) was then injected on Days 21 and 35. Blood samples were collected from the tail vein of each host on post-CS/vehicle exposure Days 14, 27, 42 and 60 (referred to hereafter as Bleeds I, II, III and IV, respectively) and serum prepared using standard methods. The isolated sera were stored at −80 °C until analyzed for levels of OVA-specific IgG levels and IgG sub-class antibodies using an indirect ELISA method (Gupta et al. Citation2011).
In brief, OVA was coated onto the walls of wells (100 ng/well) in 96-well microtiter plates overnight at 4 °C. For the assay, serum (100 μl, diluted 1:200 with PBS) from each mouse was added to triplicate wells (one set for each antibody to be evaluated) and the plates incubated for 180 min at 37 °C. After washing wells with PBS-Tween 20 (PBS-T) solution, 100 μl of detecting horseradish peroxidase-conjugated goat anti mouse IgG, IgG1, IgG2a, IgG2b or IgG3 was added to each set of dedicated wells (each at 1:1000 dilution in PBS) and the plates incubated for 120 min at 37 °C. After washing with PBS-T, 100 μl of a solution containing 4 μg o-pheneylenediamine dihydrochloride and 10 μl H2O2 in 10 ml citrate phosphate buffer (pH 5.0) was added to each well. Reactions in the wells were terminated by addition of 50 μl 8 M H2SO4 stop solution to each well. The optical density (OD) for each sample was then measured at 492 nm in an automated microplate reader (ECIL, Hyderabad, India). All experiments were carried out in triplicate.
Effects of CS on cell-mediated immunity-based responses
Delayed-type of hypersensitivity (DTH) response using GRBC immunogen
The DTH response in mice in the various treatment groups was determined as described in Jazani et al. (Citation2010), with slight modification. In brief, on Day 0, dedicated sets of mice in each treatment group were immunized with a 100 μl subcutaneous (SC) injection of 109 goat RBC (GRBC freshly obtained from a local slaughterhouse in New Delhi). After 5 days, 108 GRBC in 100 μl PBS were injected into the left hind footpad of each mouse and 100 μl PBS was injected into the right footpad (control). Footpad thickness was then measured with a dial caliper after 24 h. Results were expressed as the mean percentage increase in footpad thickness using: 100 × [(Thickness of left footpad challenged with GRBC) − (Thickness of right footpad injected with PBS)]/(Right footpad thickness).
Ex vivo lymphocyte proliferation (using OVA immunogen)
On Day 0, mice in each treatment group were primed by an IM injection with 50 μg OVA (emulsified in CFA). A booster dose of OVA (25 μg in IFA) was injected IM 8 days later and the mice were euthanized by cervical dislocation 4 days later (i.e. Day 12 post-original OVA injection). At necropsy, the spleen of each mouse was aseptically recovered and single cell suspensions prepared in RPMI-1640. Any RBC present in each suspension were lysed by addition of 0.9% [w/v] NH4Cl and incubation on ice for 5 min before the cells were centrifuged (300 × g, 5 min, 4 °C) and then re-suspended in complete RPMI 1640 containing 10% FBS. The numbers and viability of the cells was checked via trypan blue dye exclusion. Cells were then plated (in triplicate) at 2 × 10⁵ cells/100 μl/well in 96-well plates (Tarson, Kolkata, India). Aliquots (100 μl) of previously-determined optimal concentrations of OVA (5 μg/ml final concentration in well) or Concanavalin A (ConA, 2 μg/ml final concentration in well; positive control) or medium alone (negative control) were added to dedicated wells and the plates were placed in a 37 °C incubator supplemented with 5% CO2 for 72 h. At that point, 50 μl culture media was harvested from each well and frozen for later use in analyses of cytokine content (see below).
To assess the actual level of lymphoproliferation that had occurred, MTT was employed (Zhai et al. Citation2011). In brief, 20 μl of MTT stock solution (5 mg/ml) was added to each well. This was followed by incubation for 1 h at 37 °C until precipitate was visible. The medium was then carefully discarded and 200 μl DMSO added to each well to solubilize the crystals. After a 2-h incubation in the dark at room temperature, the absorbance in each well was measured at 570 nm in the microplate reader.
Cytokine analysis
Levels of interleukin (IL)-2, IL-4, IL-10, IL-1β, interferon (IFN)-γ and tumor necrosis factor (TNF)-α in the isolated culture supernatant samples (see above) were evaluated (in duplicate) using commercial ELISA kits (eBioscience, San Diego, CA), as per manufacturer instructions. The sensitivities of the kits were 2 pg IL-2/ml, 15 pg IFNγ/ml, 4 pg IL-4/ml, 30 pg IL-10/ml, 80 pg IL-1β/ml and 8 pg TNFα/ml.
Peritoneal macrophage surface antigen marker expression and NO production
To obtain peritoneal macrophages for analyses of effects of CS treatment on expression of select surface markers and nitric oxide (NO) formation, mice in each treatment group were euthanized on Day 0 (post-treatment with CS). In brief, peritoneal cells were flushed from the host peritoneal cavity by injecting 10 ml ice-cold PBS into the cavity and then gently massaging the distended site. This process was repeated 6–8 times/mouse to maximize the yield of macrophages. All the cells from a mouse were then pelleted by centrifugation (300 × g, 4 °C, 5 min), combined, re-pelleted and then re-suspended in RPMI-1640 at 106 cells/ml (enumerated using a hemocytometer).
To permit analyses of surface antigen markers (TLR-2, TLR-4, CD80 and CD86), flow cytometry was performed. The cells isolated above were washed three times (centrifugation at 300 × g, 4 °C, 5 min) with commercial staining buffer (BD Pharmingen, San Diego, CA) supplemented with 2% FBS. The final cell pellet was re-suspended at 106 cells/ml in cold stain buffer + FBS. Aliquots of cell suspension (1 ml) were then treated with sets of the manufacturer-recommend amounts of diluted (1:1000) fluorophore-conjugated antibodies for 30 min on ice (protected from light). Sets were either simultaneously stained with FITC-anti-CD80 and PE-anti-CD86 or with AF647-anti-TLR-2 and PE-anti-TLR-4 antibodies. After the incubations, all cells were washed twice with stain buffer + FBS to remove unbound antibodies. The final cell pellet was re-suspended in 0.5 ml stain buffer + FBS and the materials immediately analyzed in an LSR II flow cytometer (BD Biosciences). All data were analyzed using cytometer-associated FACS Diva 6.1.3 software. A minimum of 10 000 events/sample were acquired each time.
To evaluate spontaneous and stimulated NO production by these cells, isolated peritoneal macrophages were plated at 106 cells/well in 96-well plates and incubated for 4 h at 37 °C in the humidified CO2 incubator. After removing non-adhering cells by decanting and washing each well twice with warm media, medium (200 μl) containing either LPS (5 μg/ml final concentration in well) or medium only was added to each well and the plates were incubated for 24 h at 37 °C. After this period, the culture medium was removed for analysis of nitric oxide (NO) formation via a Griess reaction. Specifically, 59 μl cell supernatant was mixed with 141 μl of a solution containing 1% sulphanilamide, 0.1% naphthyl-ethylenediamine and 2.5% H3PO4 and the mixture then incubated for 10 min at room temperature. The level of chromophore formed was then determined in a spectrophotometer (ECIL, Hyderabad, India) at 550 nm. Levels of NO in each sample were extrapolated from a standard curve prepared in parallel using NaNO2 standards.
Peritoneal macrophage phagocytic activity
Phagocytosis by the peritoneal macrophages in mice in the various treatment groups was assessed as follows. On Day 0 (post-treatment with CS), sets of mice in each treatment group were each IP-injected with 0.5 ml of a suspension containing 5 × 10⁶ GRBC. One hour later, each mouse was euthanized and peritoneal fluid was collected as above. The fluid was used to prepare slide smears that, in turn, were incubated at 37 °C for 30 min in a wet-box, fixed with 95% ethanol and then stained with Wright-Giemsa dye. After air-drying, the slides were examined using a light microscope (in blinded manner) and the numbers of macrophages that had ingested GRBC (from a minimum of 100 cells/slide examined) was determined. The phagocytic rate (PR) and index (PI) were calculated as: PR% = 100 × (# macrophages ingesting ≥1 GRBC)/Total number of macrophages counted) and the PI = mean number of ingested GRBC by macrophages that ingested GRBC.
Histopathology
A sub-set of mice was euthanized on Day 0 and their liver, kidney and spleen isolated and fixed overnight in formalin buffer. Sections from the fixed tissues were then prepared at 5-μm sections that, in turn, were stained with hematoxylin and eosin for light microscopy analyses. For the analyses, five sections/mouse (per organ) were analyzed using a Vanox-S AH-2 microscope (Olympus, Tokyo, Japan).
Statistical analysis
All data are reported as means ± SE. Statistical significance of any differences between treated and control mice outcomes were determined using a Dunnett’s Student’s t-test. All analyses were performed using Instat software (GraphPad, La Jolla, San Diego, CA); p values < 0.05 were accepted as significant.
Results
Characterization of calcined serpentine (CS) samples
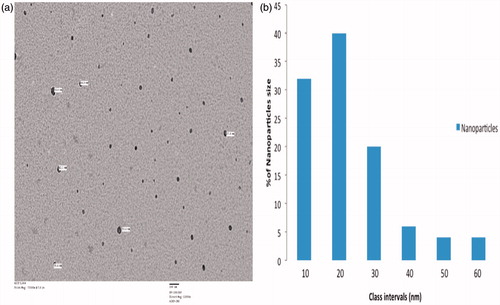
The particle size in a lyophilized filtrate of calcined Serpentine (CS) was determined using TEM. The shape of the NP found within the CS preparation was spherical and these particles ranged in size from 1–60 nm (). The maximum number of particles was found to exist in a size range of 10–20 nm (as determined by size distribution analysis; ).
Figure 1. TEM analyses. Analyses of CS samples were performed using a JEOL 2100F transmission electron microscope. (a) Determination of particle size. (b) Size distribution of NP present in the CS sample. Representative analyses are shown.
X-Ray diffraction analysis of CS samples revealed there were a number of minerals present (). The chief mineral constituents were Phillipsite, Actinolite, Clinoptilolite, Chloritoid, Muscovite, Dolomite, Epidote and Zoisite, along with small quantities of other minerals. All these minerals were silicates of magnesium, calcium and iron. Based on standards, peak positions for Phillipsite (2θ = 12.36, 27.19, 28.52 and 33.01), Actinolite (2θ = 10.51, 19.64, 30.40 and 39.71), Clinoptilolite (2θ = 25.09, 26.34), Chloritoid (2θ =18.68), Muscovite (2θ = 34.55), Dolomite (2θ = 35.34), Epidote (2θ = 36.70) and Zoisite (2θ = 38.52) are known. The major peak positions in the CS were (2θ = 10.49, 12.45, 18.63, 19.64, 25.11, 26.30, 27.18, 28.52, 30.36, 33.07, 34.55, 35.29, 36.70 and 38.53); these were in close proximity to standard peak positions for the above-noted minerals.
Figure 2. XRD analysis of CS samples. Plotting of the 2-theta values vs signal intensity (in Arbitrary Units [AU]) allowed for identification of the indicated mineral constituents. P = Phillipsite, A = Actinolyte, C = Clinoptilolite, M = Muscovite, D = Dolomite, E = Epidote, Z = Zoisite.
![Figure 2. XRD analysis of CS samples. Plotting of the 2-theta values vs signal intensity (in Arbitrary Units [AU]) allowed for identification of the indicated mineral constituents. P = Phillipsite, A = Actinolyte, C = Clinoptilolite, M = Muscovite, D = Dolomite, E = Epidote, Z = Zoisite.](/cms/asset/26fce36b-116d-4bc8-9074-4eed5c084388/iimt_a_1094152_f0002_b.jpg)
The elemental composition of the CS was analyzed using ICP-MS. As noted in , the percentages of some select elements were: Na (0.03%), Mg (16.60%), K (0.40%), Fe (9.84%), P (7.75%) and S (14.63%). Even at a maximum dose of 200 μg/day, this would correspond to doses of Na = 0.52 μg/day, Mg = 33.20 μg/day, K = 8.00 μg/day, Fe = 19.68 μg/day, P = 15.50 μg/day and S = 29.26 μg/day, each levels that were below the corresponding acceptable tolerable daily intake limit established by food and nutrition advisory boards (NAS Citation1989 Citation1997 Citation2001).
Table 1. Characterization of CS.
The presence of a few select heavy metals, e.g. lead (Pb), arsenic (As), cadmium (Cd) and mercury (Hg) in the CS was evaluated via AAS. The data presented in indicated the CS sample contained 168.93 mg Pb/kg and 1.10 mg Hg/kg; Cd and As were not detected. Based on acceptable daily intakes of 250 μg Pb/day and 50 μg Hg/day for a 70-kg adult human (Codex Alimentarius), for a 25-g mouse the limit would be 1.2 μg Pb/day and 0.24 μg Hg/day – using a human-equivalent dose formula. Thus, at the highest CS dose used here (200 μg/kg), a mouse would have received 3.3 ng Pb and 0.022 ng Hg each day.
An analysis of the quality of the mineral was performed using quantitative CHNS analysis (). The elemental composition of the test CS showed that the carbon, hydrogen, nitrogen and sulfur contents were 0.609% (C), 0.797% (H), 0.190% (S) and 0.123% (N). These outcomes indicated that, in the CS, only 1.79% of the total content was organic and the rest (98.21%) was inorganic material.
Effect of CS on humoral immune response
Oral administration of CS for 10 days had a significant effect on host anti-OVA IgG antibody levels (). Although OVA-specific IgG levels were elevated post-primary immunization (Day 14) in the 75 and 100 μg/kg (p < 0.01) hosts as compared to in control counterparts, an increase in IgG antibody levels was seen to be more elevated 7 days after the secondary and the tertiary immunizations (Day 27 and Day 42, respectively) in all treated groups (50, 75, 100 (p < 0.01) and 200 (p < 0.05) μg/kg) as compared to levels in control mice. The 100 μg/kg dose was the most effective over the entire course of the analyses. A significant enhancement in anti-OVA IgG levels was observed until Day 60 after the primary immunization at all doses tested (50, 75, 100 and 200 μg/kg, all p < 0.01) ().
Table 2. Humoral immune response-related endpoints.
Effect of CS on OVA-specific IgG subtypes
Blood samples were collected from each OVA-exposed host on post-CS/vehicle exposure Days 14, 27, 42 and 60 (referred to hereafter as Bleeds I, II, III and IV, respectively) and serum was analyzed for levels of OVA-specific IgG and IgG sub-class antibodies. In the initial period after the primary OVA immunization, dosing with 75 or 100 μg CS/kg did cause some significant (p < 0.05) increase in IgG and IgG1, but there were no comparable effects on levels of IgG2a, IgG2b or IgG3. In contrast, starting at Bleed II (i.e. Day 27 after initial OVA injection) and thereafter, there was significantly (p < 0.01) greater production of all four major IgG sub-classes, i.e. IgG1, IgG2a and IgG2b compared to levels in hosts that had received vehicle prior to initiation of the OVA treatments (). Similarly significant effects on IgG3 levels were not apparent until Bleed III (i.e. Day 42 after initial OVA injection).
Effect of CS on cell-mediated immune response-related endpoints
The effect of CS on ex vivo OVA- and mitogen (i.e. ConA)-stimulated proliferation of splenocytes that had been isolated from mice immunized with OVA is shown in . The results indicate there was a significantly enhanced splenocyte proliferation in the cells from OVA-immunized CS-treated mice (compared to that by cells from OVA-immunized control hosts) upon stimulation with either OVA antigen or ConA. In the CS hosts, delayed-type hypersensitivity (DTH) responses were also increasingly significantly enhanced by treatments with 75, 100 or 200 μg CS/kg ().
Table 3. Effects of CS on cell-mediated and innate immunity-related endpoints.
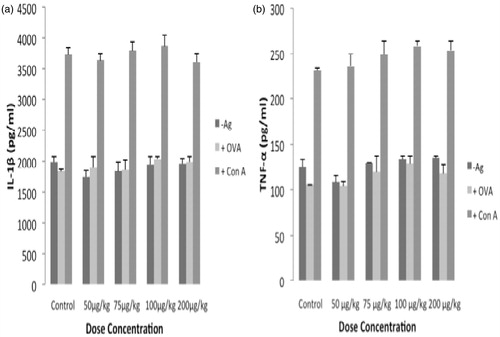
There were also significant increases in the formation/release of TH1 (IL-2, IFNγ) () and TH2 (IL-4, IL-10) () cytokines by the splenocytes isolated from OVA-immunized CS-treated mice (compared to that by cells from OVA-immunized controls) upon stimulation with OVA or ConA. There were no spontaneous increases in any of these cytokines by any of the tested cell populations in the absence of either stimulus. Interestingly, there were no significant changes (from control values) in the levels of inflammatory IL-1β or TNFα produced by the OVA- or mitogen-stimulated splenocytes from the CS-treated hosts ().
Figure 3. Ex vivo cytokine formation by mouse splenocytes. Splenocytes were isolated from mice in the different test groups and then the cells were plated (2 × 10⁵ cells/well) and then stimulated with ConA (2 μg/ml) or OVA (5 μg/ml) for 72 h. Culture supernatants were then collected and analyzed for the indicated TH1 and TH2 cytokines by ELISA. Values shown are mean ± SE (n = 5). *p< 0.01, #p < 0.05 compared to respective control.
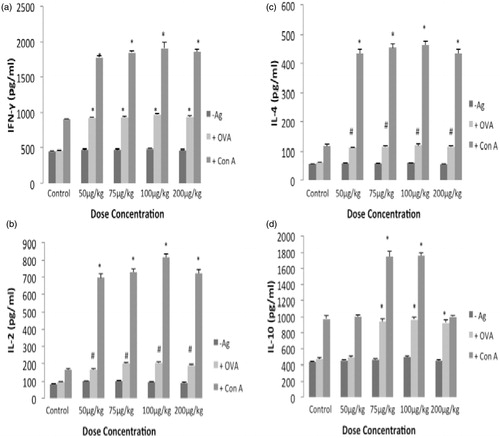
Figure 4. Ex vivo TNFα and IL-1β formation by mouse splenocytes. Splenocytes were isolated from mice in the different test groups and then the cells were plated (2 × 10⁵ cells/well) and then stimulated with ConA (2 μg/ml) or OVA (5 μg/ml) for 72 h. Culture supernatants were then collected and analyzed for the indicated pro-inflammatory cytokines by ELISA. Values shown are mean ± SE (n = 5).
Model of CS absorption in gut
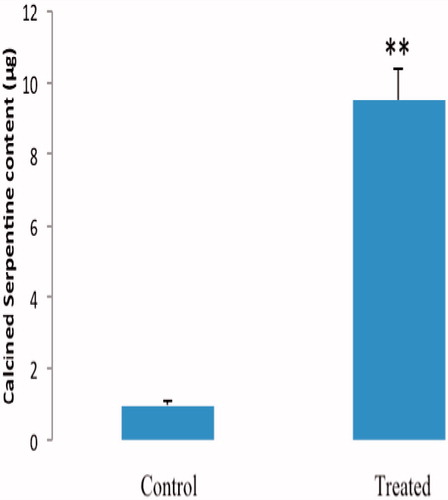
Intestinal absorption of CS following oral administration was evaluated using an everted gut sac method. The analysis revealed that absorption of CS from the mucosal to serosal side of the sac was significant over a 45-min period (). Although changes in tissue viability could have been a limiting factor in this analysis, the viability/metabolic activity of intestinal tissue is routinely retained for ≈2 h under physiological conditions (Yoshida et al. Citation2014) and so was not a confounding issue in these analyses.
Figure 5. Absorption of CS in rat intestine everted gut sac. Intestinal sacs were incubated in solutions of the indicated CS sample (200 μg/ml) or buffer only for 45 min. Values are expressed as mean ± SE (n = 5). **p < 0.01 compared with control.
Effect of CS on peritoneal macrophages and select functions
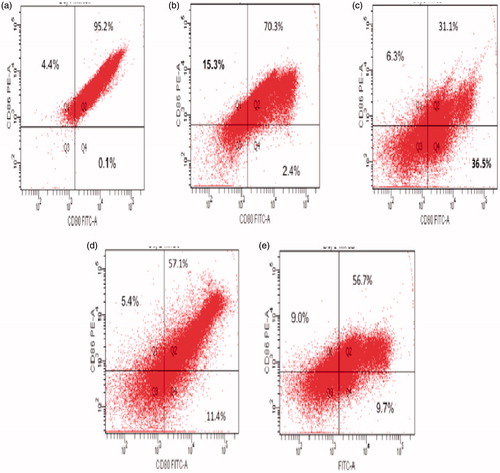
The peritoneal macrophages isolated 24 h after the final gavage treatments from hosts without any antigenic stimulation were used in assessments of expression of surface TLR-2 and TLR-4 and co-stimulatory CD80 and CD86 markers. Results from the flow cytometric analyses indicated that TLR-2 expression on the macrophages was increased as a result of CS treatments, i.e. 50 (22.7%), 75 (35.3%), 100 (9.5%) or 200 (5.5%) μg CS/kg vs value for control mice cells (3.3%). Expression of TLR-4 on the cells was decreased at all CS doses tested, i.e. 50 (5.7%), 75 (1.2%), 100 (9.4%) and 200 (12.1%) μg/kg compared to levels on control group cells (16.6%) (). Due to CS, levels of CD80+ peritoneal macrophages were elevated by all doses tested, i.e. 50 (2.4%), 75 (36.5%), 100 (11.4%) and 200 (9.7%) μg CS/kg compared to that in cells from control mice (0.1%). Levels of CD86+ macrophages were also elevated with all CS doses tested, i.e. 50 (15.3%), 75 (6.3%), 100 (5.4%) and 200 (9.0%) μg/kg vs control mouse cells (4.4%) ().
Figure 6. Flow cytometric analysis of peritoneal macrophage TLR-2 and TLR-4 expression. Isolated cells were labeled with AF647-labeled anti-TLR-2 and PE-anti-TLR-4. Representative dot-plots are shown. (a) Control, (b) 50 μg CS/kg, (c) 75 μg CS/kg, (d) 100 μg CS/kg and (e) 200 μg CS/kg dose.
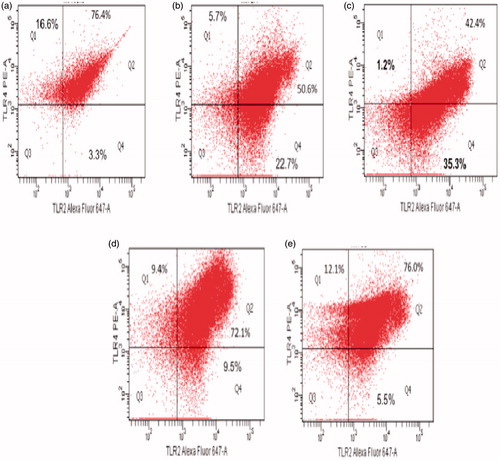
Figure 7. Flow cytometric analysis of peritoneal macrophage co-stimulatory CD80 and CD86 expression. Isolated cells were labeled using FITC anti-CD-80 and PE-anti-CD86. Representative dot-plots are shown. (a) Control, (b) 50 μg CS/kg, (c) 75 μg CS/kg, (d) 100 μg CS/kg, and (e) 200 μg CS/kg dose.
At the macrophage functional level, all four test doses, i.e. 50 (p < 0.05), 75, 100 and 200 (p < 0.01) μg CS/kg body weight resulted in significant increases in phagocytic rates compared to that by cells from control mice (). The phagocytic index of phagocytically-active cells isolated from mice treated with CS was also significantly increased, but only at doses of 75 (p < 0.05), 100 (p < 0.01) and 200 (p < 0.05) μg CS/kg compared to that of phagocytically-active control mouse cells. With regard to NO formation, cells from the CS-treated mice had no significant change in spontaneous or LPS-inducible NO production (). In general, the extent of increase in NO formation (above background) due to LPS was roughly equivalent, regardless of host treatment with CS or not.
Histopathology
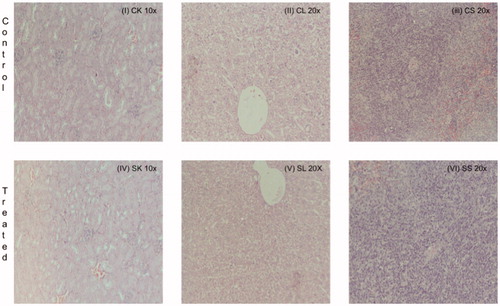
Histopathologic analyses of the liver, kidney and spleen were done to evaluate any overt toxic effects from the CS. In no case did mice treated for 10 days with the highest CS dose (200 μg/kg) show any signs of morphologic injury to the liver, kidneys or spleen ().
Figure 8. Histopathologic damage due to CS. The mice were daily gavaged with 200 μg CS/kg or vehicle only for 10 days. At 24 h after the final dosing, the host liver, kidney, and spleen were isolated and prepared for histopathology. Representative sections are shown; Magnification = 10–40×. (I) Control mouse kidney, (II) Control mouse liver, (III) Control mouse spleen, (IV) CS mouse kidney, (V) CS mouse liver and (VI) CS mouse spleen.
Discussion
Silicates are utilized widely in the food and biomedical industries (Dekkers et al. Citation2011; Fruijtier-Polloth Citation2012; Peters et al. Citation2012). Recent literature has reported on the cytotoxic and allergic effects of theses agents. Guichard et al. (Citation2015) reported cytotoxic and genotoxic effects in V79 cells exposed to 20-nm size amorphous silica that had been pre-dispersed in bovine serum albumin-water medium. Induction of allergen-specific TH2-type allergic immune responses to nano-silica was reported by Yoshida et al. (Citation2011). Fruijtier-Pölloth (Citation2012) reported on the adverse effects of synthetic amorphous silica on human lung epithelial cell membrane structure and integrity. Despite these findings, the use of silicates remains common as a form of medication. Serpentine (a silicate of magnesium, calcium and iron) is still often used as a part of formulations of the Unani system of traditional medicine in India (Nandkarni & Nandkarni Citation1989).
Serpentine is most frequently used in a calcined form that has often been hypothesized to contain nanoparticles to boost biological impact. However, to date, there has been little experimental validation of this. In the present study, oral exposure to CS was evaluated for effects on the immune system. As shown here in a gut sac assay, oral administration of CS likely led to significant intestinal absorption in the exposed hosts.
Characterization of the CS used here (via TEM, XRD, ICP-MS, AAS, CHNS) revealed that the material (of which 26% existed in nano-size range; overall range was 1–60 nm) contained many minerals (e.g. Phillipsite, Actinolite, Clinoptilolite, Chloritoid, Muscovite, Dolomite, Epidote and Zoisite) and several metals (i.e. lead, mercury, arsenic, cadmium). However, the quantities of all these potential toxicants/immunomodulants – even at the highest CS dose employed – were below acceptable tolerable daily intake values (Codex Alimentarius; NAS Citation1989 Citation1997 Citation2001). CS treatments led to no apparent changes in overall health of the mice and no overt histopathologic damage in their liver, kidney or spleen.
With regard to more direct assessments of potential immunotoxicity, while there were no toxic effects of the CS on bone marrow cellularity (see Supplemental Table 1), the treatments did cause a significant non-dose-related increased in this cellularity. Interestingly, these hosts did display increased thymic and spleen relative weights (Supplemental Table 1), albeit only at the middle doses of CS tested (i.e. 75 and 100 μg CS/kg). In the treated hosts, an increase in splenic and thymic relative weights was also accompanied by an increase in their respective organ cell counts. The increase in splenocyte levels could be a generic effect associated with an increase in host bone marrow cell levels (i.e. an overall increase in various immune cell types now circulating in the hosts). Of course, there could be other as-yet to be determined reasons that could underlie this observation (i.e. increases in specific cell types in the organ will need to be determined prior to postulating on alterative mechanisms for the noted effect). With regard to the thymus values, the latter outcomes might have been partly due to a stimulating effect of CS on lymphocytes (i.e. a maturation of those departing bone marrow) that ultimately migrated to the thymus. It is plausible this effect could have been just temporary, possibly only when the hematopoietic system was stimulated; over time, of course, this effect would then normalize. Further post-exposure analyses would be required (at much farther timepoints post-final CS exposure) to verify this effect. Regardless, it is noteworthy that at the highest test dose of CS (200 μg/kg), all the previously significant changes in organ weights/cellularity began to wane and values reached statistical non-significance from control values. This could easily reflect an immunotoxicity at this high dose (or above). However, other endpoints in the current studies do not reflect this same decline/loss of significant impact.
To gain clarity about the potential immunomodulating effects from CS, various aspects of host immunity were analyzed here. Specifically, effects on innate, cell-mediated, and humoral immune response-related cells/endpoints were evaluated. In the context of innate immunity, peritoneal macrophages were activated in CS-treated animals. In these cells, CS administration was seen to cause increases in phagocytic rate and index, as well as increases in expression of TLR-2 and decreased expression of TLR-4. A lower TLR-4 expression may reflect an inhibitory effect of CS on inflammatory (MyD88-dependent) responses.
This viewpoint is complemented by the findings of the effect of CS on production of NO by peritoneal macrophages isolated from CS treated mice wherein a non-significant increase in NO levels was observed upon CS administration when compared to the control group. An insignificant increase in the level of NO may be due to the negative effect of CS on inflammatory response or higher level of anti-inflammatory cytokine (IL-4) induced by CS.
In cells, TLR-2 can promote primarily two types of pathways, STAT-1-dependent pathways that promote TH1 cell-based responses or STAT-6-dependent pathways that promote TH2 cell activation (Najjar & Fagard Citation2010). While the increase in TLR-2 expression on the cells from CS-treated hosts suggests immunopotentiation, it would be the secondary signals mediated by co-stimulatory molecules present on antigen-presenting cells that would ultimately prove important for promoting cell–cell crosstalk to activate TH cells for effective humoral or cell-mediated immune responses. In that context, CD86 is important in the enhanced proliferation of TH2 cells (Hofer et al. Citation1998; Jaffar et al. Citation1999), whereas proliferation of TH1 cells depends on induction of CD80 expression (Bashian et al. Citation1997; Greenfield et al. Citation1998). The results here showed that oral administration of CS enhanced the expression of both CD80 and CD86. Taken together, these results suggested to us that the CS impact on macrophages was one that could have led to enhanced TH1 and TH2 immunity in situ.
OVA protein is commonly used as a model for immunogen-specific T- and B-cell-mediated immune functions; hence, OVA was used in this study to examine the effects of CS. Only by an examination of cytokine formation/release by lymphocytes could it be possible to discern if CS indeed affected TH1 over TH2 immunity or vice-versa. Cytokines like IL-2 and IFNγ secreted by TH1 cells induce B-cells to secrete IgG2a, IgG2b and IgG3 antibodies, whereas IL-4 and IL-10 secreted by TH2 cells induces B-cells to preferentially secrete IgM and IgG1 (Sun & Liu Citation2008). Here, oral treatments with CS enhanced splenocyte secretion of IL-2 and IFNγ and increased the level of IgG2a, IgG2b and IgG3 in hosts sensitized to OVA. Similarly, these exposures to CS also induced the secretion of IL-4 and IL-10 cytokines and IgG1. Thus, while it was already shown that CS appeared to improve the responsiveness of macrophages, it seemed to also do so with T- (and indirectly, B-) cells involved in both humoral and cell-mediated responses (Miyata & Van-Eeden Citation2011). The other endpoints evaluated here, i.e. DTH responses and antigen-/mitogen-induced lymphoproliferation, unfortunately, shed no further light on any potential preference. In both cases, it seemed exposure to the CS would potentially have led to significant enhancement of T-cell-mediated immunity in a CS-treated host. Clearly, further studies are warranted to better clarify if/how the CS might impact on TH1 and/or TH2-based outcomes in situ/ex vivo.
Conclusions
Taken together, the results here indicate that CS exhibited an immunomodulatory potential in that it appeared to be able to stimulate both innate and adaptive immunity in a treated rodent host. The noted lack of traditional dose-responsivity with regard to the majority of the endpoints examined here is somewhat perplexing, but in keeping with studies wherein mixtures of many potential affecting agents are present (i.e. thresholds of activation/toxicity for each component element can be attained at any one given dose of CS vs another). Nonetheless, the potential for CS to be used as an adjuvant to induce both cellular and humoral immune responses (especially when keeping in mind that there is a substantial content of nano-size materials in the CS) should be explored in future.
Acknowledgements
The authors want to thank the Indian Council of Medical Research (ICMR) for providing financial assistance for this study. The authors are also thankful to the AIRF, JNU, New Delhi, for providing the facilities for, and assistance with, the XRD powder analysis.
Disclosure statement
The authors report no conflicts of interest. The authors alone are responsible for the content and writing of the paper.
References
- Bashian GG, Braun CM, Huang SK, Kagey-Sobotka A, Lichtenstein LM, Essayan DM. 1997. Differential regulation of human antigen-specific TH1 and TH2 responses by the B-7 homologues, CD80 and CD86. Am J Respir Cell Mol Biol. 17:235–242.
- Bhowmick TK, Suresh AK, Kane SG, Joshi AC, Bellare JR. 2009. Physicochemical characterization of an Indian traditional medicine, Jasada Bhasma: Detection of nanoparticles containing non-stoichiometric zinc oxide. J Nanopart Res. 11:655–664.
- Bin-Hafeez B, Haque R, Parvez S, Pandey S, Sayeed I, Raisuddin S. 2003. Immuno-modulatory effects of fenugreek (Trigonella foaecum graecum L.) extract in mice. Int Immunopharmacol. 3:257–265.
- Cario E. 2012. Nanotechnology-based drug delivery in mucosal immune diseases: hype or hope? Mucosal Immunol. 5:2–3.
- Codex Alimentarius, Codex Standard 193-1995, Codex general standard for contaminants and toxins in food and feed, Adopted 1995; Revised 1997, 2006, 2008, 2009; Amended 2009, 2010. Rome: FAO/WHO Available from: http://www.codexalimentarius.net/web/standard_list.do?lang=en
- Dekkers S, Krystek P, Peters RJ, Lankveld DP, Bokkers BG, van Hoeven-Arentzen PH, Bouwmeester H, Oomen AG. 2011. Presence and risks of nanosilica in food products. Nanotoxicology 5:393–405.
- Elahi A, Singh MP, Ali S, Khan F. 2014. Antigen-specific immune enhancement of innate and aquired immunity by pearl in ashed form. Int Immunopharmacol. 21:82–93.
- Etherington KJ, Rodger A, Hemming P. 2001. CHN microanalysis: A technique for the 21st Century. Lab Plus Int. 26:1–2.
- Fruijtier-Polloth C. 2012. Toxicological mode of action and the safety of synthetic amorphous silica – a nano-structured material. Toxicology 294:61–79.
- Greenfield EA, Nguen KA, Kuchroo VK. 1998. CD28/B7 co-stimulation: A review. Crit. Rev. Immunol. 18:389–418.
- Guichard Y, Fontana C, Chavinier E, Terzetti F, Gaté L, Binet S, Darne C. 2015. Cytotoxic and genotoxic evaluation of different synthetic amorphous silica nano-materials in the V79 cell line. Toxicol Ind Health. [Epub ahead of print]. doi: 0748233715572562.
- Gupta A, Khajuria A, Singh J, Singh S, Suri KA, Qazi GN. 2011. Immunological adjuvant effect of Boswellia serrata (BOS 2000) on specific antibody and cellular response to ovalbumin in mice. Intl Immunopharmacol. 11:968–975.
- Hofer ME, Jirapongsanuruk O, Trumble AE, Leung DY. 1998. Up-regulation of B7.2, but not B7.1, on B-cells from patients with allergic asthma. J Allergy Clin Immunol. 101:96–102.
- Jaffar ZH, Stanciu L, Pandit A, Lordan J, Holgate ST, Roberts K. 1999. Essential role for both CD80 and CD86 co-stimulation, but not CD40 interactions, in allergen-induced TH2 cytokines production TH2 cytokine production from asthmatic bronchial tissue: Role for αβ but not γδ T-cells. J Immunol. 163:6283–6291.
- Jazani NH, Karimzad M, Mazloomi E, Sohrabpour M, Hassan ZM, Ghasemnejad H, Roshan-Milani S, Shahabi S. 2010. Evaluation of the adjuvant activity of naloxone, an opioid receptor antagonist, in combination with heat-killed Listeria monocytogenes vaccine. Microbes Infect. 12:382–388.
- Khan F, Ali S, Ganie BA, Rubab I. 2009. Immunopotentiating effect of Khamira Marwarid, an herbo-mineral preparation. Meth Fund Exp Clin Pharmacol. 31:513–522.
- Miyata R, van Eeden S. 2011. Innate and adaptive immune response induced by alveolar macrophages exposed to ambient particulate matter. Toxicol Appl Pharmacol. 257:209–226.
- Najjar I, Fagard R. 2010. STAT1 and pathogens, not a friendly relationship. Biochimie 92:425–444.
- Nandkarni KM, Nandkarni AK, (Eds.). 1989. Indian Meteria Medica. Mumbai: Popular Prakashan Pvt. Ltd., pp. 161.
- National Academy of Sciences (NAS). 1989. Food and Nutrition Board: Dietary Reference Intake for Na, K, Fe, P, Mg. Washington, DC: National Academy Press.
- National Academy of Sciences (NAS). 1997. Food and Nutrition Board: Dietary Reference Intake for Na, K, Fe, P, Mg. Washington, DC: National Academy Press.
- National Academy of Sciences (NAS). 2001. Food and Nutrition Board: Dietary Reference Intake for Na, K, Fe, P, Mg. Washington, DC: National Academy Press.
- National Formulation of Unani Medicine. 2001. Ministry of Health and Family Welfare, Government of India. Lucknow, India: National Institute of Science Communication CSIR, pp. 149.
- Peters R, Kramer E, Oomen AG, Rivera ZE, Oegema G, Tromp PC, Fokkink R, Rietveld A, Marvin HJ, Weigel S. 2012. Presence of nano-sized silica during in vitro digestion of foods containing silica as a food additive. ACS Nano. 6:2441–2451.
- Said HM (Ed.). 1997. Hamdard Pharmacopoeia of Eastern Medicine. New Delhi: Sri Satguru Publications.
- Singh SK, Gautam DN, Kumar M, Rai SB. 2010. Synthesis, characterization and histopathological study of a lead-based Indian traditional drug: Naga Bhasma. Indian J Pharm Sci. 72:24–30.
- Smith DM, Simon JK, Baker, JR, Jr. 2013. Applications of nanotechnology for immunology. Nat Rev Immunol. 13:592–605.
- Sun Y, Liu J. 2008. Adjuvant effect of water-soluble polysaccharide (PAP) from the mycelium of Polyporus albicans on the immune responses to ovalbumin in mice. Vaccine 26:3932–3936.
- Tariq M, Chaudhary SS, Imtiyaz S. 2013. Introduction to kushta: A herbo-mineral Unani formulation. J Pharm Sci Innov. 2:14–17.
- Wadekar MP, Rode CV, Bendale YN, Patil KR, Prabhune AA. 2005. Preparation and characterization of a copper-based Indian traditional drug Tamra bhasma. J Pharm Biomed Anal. 39:951–955.
- Yoshida T, Yoshioka Y, Fujimura M, Yamashita K, Higashisaka K, Morishita Y, Kayamuro H, Nabeshi H, Nagano K, Abe Y, et al. 2011. Promotion of allergic immune responses by intranasally-administrated nanosilica particles in mice. Nanoscale Res Lett. 6:195–205.
- Yoshida T, Yoshioka Y, Takahashi H, Misato K, Mori T, Hirai T, Nagano K, Abe Y, Mukai Y, Kamada H, et al. 2014. Intestinal absorption and biological effects of orally administered amorphous silica particles. Nanoscale Res Lett. 9:532–542.
- Zhai L, Li Y, Wang W, Wang Y, Hu S. 2011. Effect of oral administration of ginseng stem and leaf saponins (GSLS) on the immune responses to Newcastle disease vaccine in chickens. Vaccine 29:5007–5014.
- Zolnik BS, Gonzalez-Fernandez A, Sadrieh N, Dobrovolskaia MA. 2010. Nanoparticles and the immune system. Endocrinology 151:458–465.