Abstract
This study examines dose effects of cadmium telluride quantum dots (CdTe-QDs) from two commercial sources on model macrophages (J774A.1) and colonic epithelial cells (HT29). Effects on cellular immune signalling responses were measured following sequential exposure to QDs and Pseudomonas aeruginosa strain PA01. At CdTe-QD concentrations between 10-2 and 10 µg/ml, cells exhibited changes in metabolism and morphology. Confocal imaging revealed QD internalisation and changes in cell–cell contacts, shapes and internal organisations. QD doses below 10-2 µg/ml caused no observed effects. When QD exposures at 10-7 to 10-3 µg/ml preceded PA01 (107 bacteria/ml) challenges, there were elevated cytotoxicity (5–22%, p < 0.05) and reduced levels (two- to fivefold, p < 0.001) of nitric oxide (NO), TNF-α, KC/CXC−1 and IL-8, compared with PA01 exposures alone. These results demonstrate that exposures to sub-toxic levels of CdTe-QDs can depress cell immune-defence functions, which if occurred in vivo would likely interfere with normal neutrophil recruitment for defence against bacteria.
Introduction
Quantum dots (QDs) are nanoparticles (NPs) that can range from 2 to 100 nm in diameter and act both as semiconductors and fluorophores (Bruchez et al. Citation1998). Structurally, QDs are composed of a metal core that determines their colour, an inorganic shell that helps to enhance stability and brightness, and a polymer layer or functional group that enhances water solubility and conjugation capacity (Michalet et al. Citation2005). The unique electrical and optical properties of these NPs make them useful materials for microelectronics and biomedical research (De Wild et al. Citation2003). QDs containing cadmium telluride (CdTe-QDs) offer great potential in therapeutic targeting and in medical and molecular imaging due to their spectral properties such as broad absorption, narrow emission and photostability (Chan et al. Citation2002; Gao et al. Citation2004; Scherer et al. Citation2002). While the applications of CdTe-QDs are growing, there is limited information on their toxicity.
The toxicity of Cd-based QDs has been proposed to be associated with the oxidation reaction of the metal core. This reaction generates reactive oxygen species (ROS) and cadmium ions (Cd2+), which are toxic to cells of animals, plants and microbes (Kimura et al. Citation2005; Godt et al. Citation2006). The CdTe-QD type has been shown to produce singlet oxygen, which leads to the formation of ROS through photo-oxidation reaction (Samia et al. Citation2006). The ROS products contribute significantly to QD-induced cellular damage (Lovrić et al. Citation2005) along with the actual release of highly toxic, free Cd2+ ions (Wu et al. Citation2003; Derfus et al. Citation2004; Kirchner et al. Citation2005). Some studies have also suggested that toxicity of CdTe-QDs could arise from several intrinsic properties such as size, chemical composition, reactivity of the inner core metals and surface-coating components (Hardman Citation2006; Lovric et al. Citation2005). Given that there are some discrepancies among previous reports concerning the degree of toxicity of CdTe-QDs, further research is needed to clarify the potential effects of existing products and more advanced designs of CdTe-QDs on human health and environment (Rzigalinski & Strolb Citation2009).
One research approach is to determine whether and how CdTe-QDs impact on known immune-related mechanisms involved in clearance, defence and detoxification of xenobiotics (including QDs, ultrafine air-pollution particulates and microbes). Many studies on immunological effects of nanomaterials have focused on a variety of NPs such as those derived from carbon, metals, silica and polystyrene (Jang et al. Citation2010). Examples of these studies include exposure of zinc oxide NPs to isolated immune cells of the earthworm Eisenia veneta, which resulted in a significant drop in immune active cells (Svendsen Citation2008), carbon black NP effects on mussel hepatocytes by way of induction of oxidative stress and inflammatory processes (Canesi et al. Citation2008) and the effect of manufactured gold NPs on the immune system through their ability to perturb the functions of dendritic cells (Villiers et al. Citation2010). The effects of CdTe-QDs on immune system have recently been studied in aquatic organisms. In freshwater mussels, Gagne and colleagues (Citation2008) found that CdTe-QDs inhibited phagocytic capacity and viability of haemocytes from peripheral haemolymph. Similarly, in rainbow trout, CdTe-QDs were found to suppress immunocompetence by causing reduction in leukocyte number, viability and phagocytic activity (Gagne et al. Citation2010). However, comparable information on the potential toxic effects of QDs on mammalian immune cells and the immune system is lacking.
The research described here addresses the use of in vitro screening steps to evaluate systemic and immunologic consequences of exposures to manufactured QDs. The current study employed model macrophages and colonic epithelial cells, which were previously used to assess pathogenic effects of bacteria (Tayabali & Seligy Citation2000). Physical properties of two manufactured CdTe-QDs were assessed prior to benchmarking cell exposure effects including changes in metabolism, morphology and cell signalling related to immune response capacity. Additional studies were then carried out to test the effects of CdTe-QDs on these model systems in subsequent exposures to PA01, a well-characterised strain of Pseudomonas aeruginosa (LaBaer et al. Citation2004). Pa01 is known to be an opportunistic pathogen, capable of causing both acute and chronic infections (Fick Citation1993), as well as inducing inflammatory mediators and reactions in vivo and in vitro using macrophage and in mucosal epithelial cells (Coburn & Frank Citation1999).
Materials and methods
Materials
Cell lines that model murine macrophage (J774A.1) and human colonic epithelial (HT29) were obtained from the American Type Culture Collection (Manassas, VA). Green CdTe-QDs (emission of 540 nm) were purchased from MK Impex Canada (Mississauga, Canada) (10 mg/ml) referred to as QD-1 and from Vive Nano Inc. (formerly Northern Nanotechnologies Inc.) (Toronto, ON) (20 mg/ml) referred to as QD-2 (). P. aeruginosa PA01 was purchased from The Pseudomonas Stock Center (East Carolina University School of Medicine, Greenville, NC). MTT ((3-(4,5-dimethylthiazol-2-yl) 2,5-diphenyl tetrazolium bromide), DMSO, sulphanilamide, naphthylethylenediamine dihydrochloride and sodium nitrite were obtained from Sigma-Aldrich (St. Louis, MO). Rhodamine-Phalloidin, Sytox-Red and Prolong antifade were purchased from Molecular Probes-Invitrogen (Carlsbad, CA). Bio-Plex cytokine kits and reagents were purchased from Bio-Rad (Hercules, CA).
Table I. Specifications of cadmium telluride quantum dots (CdTe-QDs) provided by the commercial sources.
CdTe-QD spectral properties
Fluorescence spectra of QD-1 and QD-2 (450 nm excitation and emission wavelengths from 450 to 650 nm) were obtained by using 100 µl (100 µg/ml) of each source in a 96-well opaque plate and scanning with a SPECTRAmax GEMINI XS microplate spectrofluorometer (Molecular Devices, Sunnyvale, CA). A standard curve of fluorescence intensity (measured at 540 nm) versus concentration was made for each QD source using three replicates of serial dilutions ranging from 1.562 to 50 µg/ml. Each QD sample was assayed three times.
Atomic force microscopy and transmission electron microscopy
For observation by atomic force microscopy (AFM), commercial stocks and serial dilutions of CdTe-QDs made in ddH2O were deposited on freshly cleaved mica. Samples were air-dried overnight and were imaged in non-contact mode with a PPP-NCH probe (Nanosensors™, Switzerland) with an Agilent 5500 AFM. For transmission electron microscopy (TEM), CdTe-QD stocks were diluted by 1000-fold with ddH2O, PBS or culture medium (DMEM), deposited on formvar-coated grids, and air-dried overnight at RT. Grids were examined with a JOEL JEM 1230 operating at 60 kV. AFM images were quantified using Picoview software (version 1.2.4) provided with the microscope. For TEM analysis, micrographs were imported into an image analysis package for size determination (Nikon NIS Elements Basic Research).
Cell cultures and CdTe-QD and PA01 exposures
J774A.1 and HT29 cells were cultured in Dulbecco's modified Eagle's medium (DMEM), supplemented with 10% foetal bovine serum (FBS), 1 mg/ml glutamine and 100 µg/ml gentamicin at 37°C in a humidified atmosphere with 5% CO2. For assays involving measurement of MTT bioreduction, nitric oxide (NO) and cytokines, cells were seeded into 96-well plates at a density of 5 × 10⁴ cells/well. For confocal microscopy, cells were seeded on coverslips in 12-well plates at a concentration of 1 × 10⁵ cells/ml/well. Cells were pre-cultured for 24 h to 80% confluency and media replaced before exposure regimes. Working solutions of CdTe-QDs and PA01 were prepared by diluting stock solutions in PBS. Cells were treated with different concentrations of CdTe-QDs (10-7–10 µg/ml) and/or PA01 (107 bacteria/ml) for different durations. All treatments were performed in DMEM containing gentamicin, except those for cytotoxicity assays that were done in medium containing no antibiotic. Treatments with PBS were used as controls.
Cytotoxicity assay
The MTT assay as developed for mammalian–bacterial interaction studies (Tayabali & Seligy Citation2000) was used to assess detrimental effects on cell respiration (referred to as bioreduction assay). After cells were treated with/without CdTe-QDs or/and PA01, culture media was removed and replaced with fresh media (100 µl/well) and 10 µl/well of MTT stock (10 mg/ml), followed by incubation for 1 h at 37°C. Media was removed and the remaining attached cells were rinsed with PBS (100 µl/well), then cells were lysed and formazan was dissolved with DMSO (100 µl/well). Absorbance was measured at 505 nm using a multiwall scanning spectrophotometer (Molecular Devices). All measurements were done in duplicate in three independent experiments.
Cell morphology by confocal microscopy
Cells grown on glass coverslips (see Cell Culture and Exposure Section) were rinsed with PBS immediately after treatment, then fixed with 4% paraformaldehyde in PBS containing 0.1% Triton X-100 for 15 min followed by two subsequent PBS washes (5 min). Cells were then incubated with rhodamine-phalloidin (1:40) for 1 h at RT. After two washes with PBS, cells were stained with Sytox-red (1:1000) for 15 min and were washed again with PBS. Each coverslip was inverted onto a drop of Prolong™ antifade (Molecular Probes) on a glass slide and was dried overnight in the dark before observation with a Nikon TE2000 microscope attached to a C1 confocal unit.
NO detection assay
NO production was measured for J774A.1 and for HT29 according to the Griess method (Huttunen et al. Citation2003). Supernatants from the CdTe-QD or/and PA01-treated cultures were mixed with 25 µl of Griess’ reagent (1% sulphanilamide and 0.1% naphthylethylenediamine dihydrochloride in 2% phosphoric acid). The coloured product was measured at 543 nm. Sodium nitrite (NaNO2) was used as a standard.
Cytokine/chemokine assays
Levels of cytokines/chemokines produced by the two cell lines were estimated by using multiplex bead assays based on mouse 23-plex cytokine kits (IL-1α, IL-1β, IL-2, IL-3, IL-4, IL-5, IL-6, IL-9, IL-10, IL-12 (p40), IL-12 (p70), IL-13, IL-17, eotaxin, G-CSF, GM-CSF, IFN-γ, KC/CXCL-1, MCP-1/MCAF, MIP-1α, MIP-1β, RANTES, TNF-α) and human 8-plex cytokine kits (IL-2, IL-4, IL-6, IL-8, IL-10, GM-CSF, IFN-γ, TNF-α). The cytokine/chemokine levels were measured using the Luminex-based Bio-Plex array system (Bio-Rad, Hercules, CA) according to the manufacturer's instructions. Briefly, anti-cytokine/chemokine-conjugated beads were added to individual wells of a 96-well filter plate. Beads were then sedimented using vacuum filtration and washed briefly with kit wash buffer. After washing, 50 µl of pre-diluted standards or cell culture supernatants were added and incubated for 30 min at RT with gentle shaking. The filter plate wells were then washed before adding 25 µl/well of pre-diluted detection antibody and incubating for 30 min at RT. After a further washing, 50 µl/well of pre-diluted streptavidin-conjugated phycoerythrin was added and the plate was shaken for 10 min. The wells were again washed and 125 µl/well of assay buffer was added. The plate was shaken for 1 min and analysed with the Bio-Plex 100 Array System.
Statistical analysis
Results were compared by one-way analysis of variance (ANOVA) followed by Dunnett's multiple comparison test for comparison with the controls. All data were expressed as mean ± standard deviation. A value of p < 0.05 was considered statistically significant.
Results
Spectral properties of test CdTe-QDs
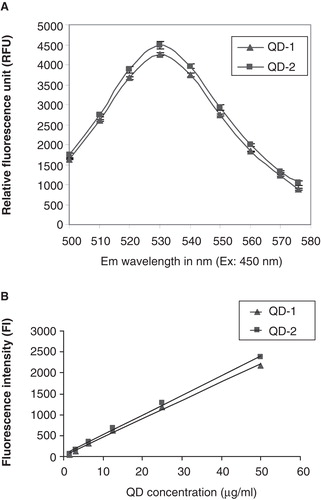
Fluorescence spectra and intensities derived from standard curves were similar for QD-1 and QD-2 (). The fluorescence spectra showed that the maximum emission for both types of QDs was at 530 nm (). The standard curves were plotted using dilutions of known concentrations of both QD types. Both curves shown in were nearly superimposable and relatively linear as indicated by the excellent curve fit (R2 = 0.997 for QD-1 and R2 = 0.998 for QD-2)
Figure 1. A. Fluorescence spectra for QD-1 and QD-2 at 450 nm excitation and emission wavelengths from 500 to 580 nm. B. Standard curves for QD-1 and QD-2 at 485 nm excitation and 540 nm emission. The standard curves for both QDs were plotted using linear curve fit (y = A + Bx) with A = 21.056, B = 43.995 and R2 = 0.997 for QD-1 and A = 41.031, B = 47.283 and R2 = 0.998 for QD-2.
Size analysis of CdTe-QDs
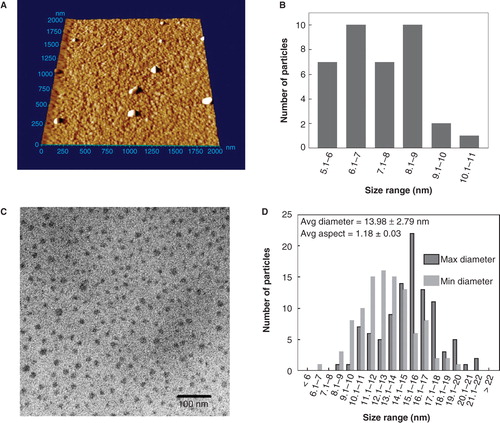
QDs from both sources were assessed for composition and purity by image analysis using AFM and TEM (). The commercial stocks of CdTe-QDs were too concentrated for enumeration (). Some larger particles were also evident, which were not observed at lower concentrations. They may represent either aggregates or contaminants. A dilution of 103-fold was observed to yield well-dispersed NPs that were amenable to analysis. For AFM measurements, only the Z-dimension was used for determination of size to avoid probe-related artefacts. These measurements yielded a mean size of 7.3 ± 1.2 nm ranging from 5.1 to 10.1 nm (). TEM images were also analysed for size, by measuring minimum and maximum dimensions of each NP. With dilution in ddH2O, the average particulate size in either dimension for both products was 14 ± 2.8 nm and ranged from 6.2 to 21.5 nm (). By contrast, TEM images of QD samples prepared with PBS indicated the presence of additional particulate-like matter related to salt crystals. However, in the areas with fewer salt crystals, test QDs were spread out evenly and individual NPs were observed. Unfortunately, the TEM images were obscured by artefacts created by PBS (data not shown). Similarly, TEM particulate imaging using DMEM as the diluent was not informative because its complex components formed an electronically impenetrable mass that blocked the TEM beam. These results suggest that there are limitations in the use of TEM imaging of NPs when using different diluents such as buffers and media used in cell work. Using ddH2O as the diluent, the minimum and maximum diameter of each QD yielded an average ratio of 1.18 ± 0.03, indicating that the shape of either QD products is approximately spherical (). The same data indicate that there is a discrepancy in QD size estimated by the two analytical methods, but in each case they are very similar and are different from claims made by respective manufacturers. Alternatively, it may be that the larger sizes observed here are forms of agglomerated NPs.
Figure 2. Analysis cadmium telluride quantum dots (CdTe-QDs) by atomic force microscopy (AFM) and transmission electron microscopy (TEM). (A) AFM image of full commercial concentration of CdTe-QD deposited on freshly cleaved mica. The samples were also diluted to 20 μg/ml and deposited onto cleaved mica for AFM and formvar-coated copper grids for TEM. (B) Summary of Z-dimension size measurements of diluted CdTe-QDs as measured by AFM. (C) TEM image of diluted CdTe-QDs. (D) The diameter of each individual CdTe-QDs was measured at its minimum and maximum dimensions. These measurements were used to estimate the average aspect ration as a measure of sphericity, where 1 is an ideal circle.
QD dose–time toxicity effects on epithelial cells and macrophages
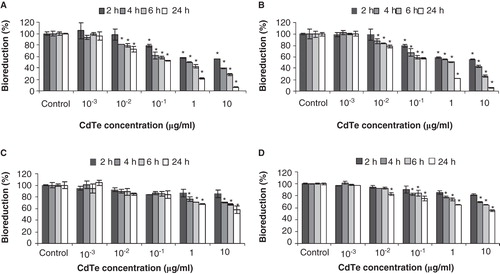
Cytotoxicity of CdTe-QDs was evaluated by measuring cellular bioreduction activity using MTT assays and by observing changes in cell morphology using confocal microscopy. Exposures of CdTe-QDs from both commercial sources caused similar effects in terms of level of response by the two test cell systems. CdTe-QDs caused a decrease in bioreduction activity in test cells in a dose- and time-dependent manner (). The lowest concentration of CdTe-QDs that induced an observable loss of bioreduction was 0.01 µg/ml. At 2 h, a dose of 10 µg/ml caused 45% and 15% decreases in bioreduction of J774A.1 and HT29, respectively. Furthermore, by 24 h of exposure, bioreduction activity decreased to 90% (J774A.1) and 42% (HT29), compared with PBS treatment.
Figure 3. Cytotoxicity as assessed by loss of metabolic activity (bioreduction) of QD-treated cultures relative to PBS-treated controls. J774A.1 macrophages (A, B) and HT29 epithelial cells (C, D) were exposed to QD-1 (A, C) or QD-2 (B, D), and bioreduction was quantified using the MTT assay. The asterisks (*) indicate statistically significant differences compared with PBS-treated control (p < 0.001). Below 10-2 µg/ml, no change in bioreduction was detected.
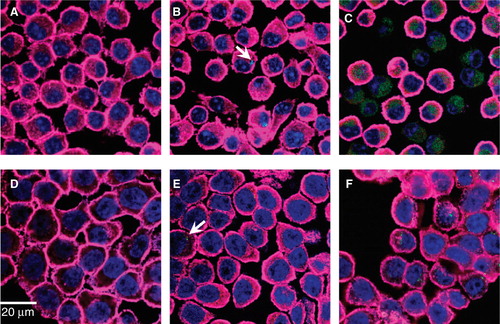
Fluorescence confocal microscopy was used to assess morphological changes of the cells as a result of CdTe-QD treatment (). CdTe-QDs (1–10 µg/ml) were observed in the cytoplasm of J774A.1 and HT29 cells at 1 and 4 h, respectively, but not in their nuclei. Data in showed that at the same concentration, there were more CdTe-QDs present inside J774A.1 cells (at 1 h) than inside HT29 cells (at 4 h). Also concentrations of CdTe-QDs from 0.01 to 10 µg/ml induced observable changes in cell shapes and structures in J774A.1 at 4 h and in HT29 at 24 h of treatment. Greatest effects were observed with 10 µg/ml CdTe-QDs, which caused cell volume shrinkage, round-up, deformation as well as cell–substratum and intercellular detachment in both cell types. Also evident was a reorganisation of actin filaments and nuclear structure. Most cells showed a transition from diffusely stained nuclei to condensed nuclei with distinct nucleoli, while other cells showed complete loss of nuclear staining. The micrograph fields also exhibited areas where cells had detached or lysed, but were marked by high concentrations of residual CdTe-QD staining ().
Figure 4. Fluorescence confocal micrographs of J774A.1 macrophages and HT29 epithelial cells treated with QD-1 compared with controls. The cells were stained for F-actin (pink) and the nucleus (blue). Arrows point to the presence of green CdTe. (A) Control J774A.1, (B) J774A.1 cells treated with 10-2 µg/ml QD-1 for 1 h, (C) J774A.1 cells treated with 10 µg/ml QD-1 for 4 h, (D) control HT29, (E) HT29 cells treated with 10-2 µg/ml for 4 h and (F) HT29 cells treated with 10 μg/ml QD-1 for 24 h. Similar results were obtained for QD-2.
Effects of sub-toxic levels of CdTe-QDs on bacterial exposure outcome
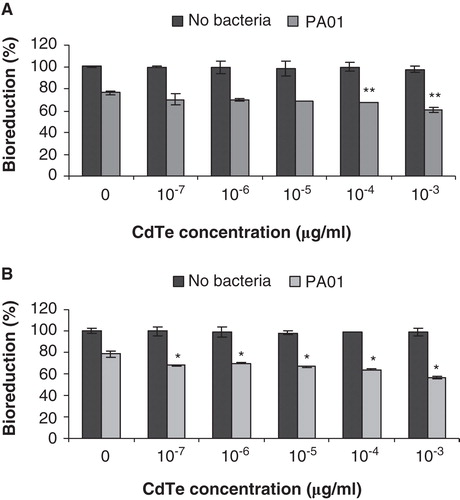
To investigate potential effects of CdTe-QDs on innate immune defence-related functions of J774A.1 and HT29, cells were first exposed to QDs before challenging with live PA01. Results are summarised in . As shown previously, exposure to CdTe-QDs at concentrations less than 10-2 µg/ml caused no observed effects on the test cells. Besides that, treatment with 107 bacteria/ml of PA01 and no CdTe-QDs for 6 h in medium containing no antibiotic (gentamicin) resulted in bioreduction decreases of 25% for J774A.1 cells and 22% for HT29 cells. However, with pre-exposure to CdTe-QDs at concentrations from 10-7 to 10-3 µg/ml, and then exposure to PA01 in medium containing no gentamicin, there was a greater loss of bioreduction (from 5% to 22%) above that observed for each cell type exposed to PA01 alone (). This effect was not observed with CdTe-QD concentrations that were less than 10-7 µg/ml (data not shown).
Figure 5. The effect of cadmium telluride quantum dots (CdTe-QDs) on PA01 cytotoxicity activity. J774A.1 macrophages (A) and HT29 epithelial cells (B) were exposed to QD-1 and then PA01 (107 bacteria/ml). Bioreduction activity of 6 h-treated cultures was measured and is shown relative to controls. CdTe-QD concentrations from 10-7 to 10-3 µg/ml alone did not cause observed cytotoxicity, but caused a greater loss of bioreduction for each cell type when being subsequently exposed to PA01, compared with treatment of PA01 alone. Asterisks (*) and (**) indicate statistically significant differences compared with control with p < 0.001 and with p < 0.05, respectively.
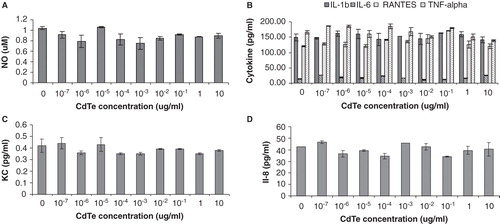
NO and cytokine production from exposures to CdTe-QDs alone
The effect of varying concentrations of CdTe-QDs and duration of exposure on the levels of mammalian cell inflammatory mediators (NO and the 31 selected cytokine/chemokine markers, as described in Materials and Methods) was examined. There were no statistically significant changes in the levels of NO or any cytokine markers released from J774A.1 and from HT29 cells after exposure to CdTe-QDs ().
Figure 6. Effects of cadmium telluride quantum dots (CdTe-QDs) on the production of inflammatory mediators from J774A.1 macrophages and HT29 epithelial cells. Test cells were treated with different concentrations of QD-1 for 4 h. (A) Levels of nitric oxide from J774A.1. (B) Levels of IL-1β, IL-6, RANTES and TNF-α from J774A.1. (C) Levels of KC/CXCL-1 from J774A.1. (D) Levels of IL-8 from HT29.
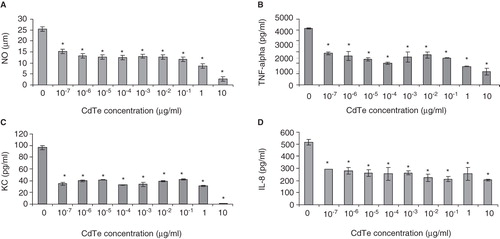
CdTe-QD effects on NO production from macrophages in response to PA01
The effect of CdTe-QDs on NO production from J774A.1 cells in response to PA01 was tested. PA01 alone induced 25 µg/ml of NO. However, when 4-h pre-exposures with CdTe-QDs (10-7–10-3 µg/ml) were followed by an exposure to PA01, a 50% decrease in the level of NO was observed compared with PA01 exposure alone (). This effect was not observed with CdTe-QD concentrations that were less than 10-7 µg/ml (data not shown).
Figure 7. Effect of cadmium telluride quantum dots (CdTe-QDs) on production of immune mediators from J774A.1 and HT29 in response to PA01. Cells were pretreated with different concentrations of QD-1 for 4 h, excess QDs were washed out and cells were then exposed to PA01 for 4 h. Gentamicin was present in all exposures. Levels of NO (A), TNF-α (B), KC (C) from J774A.1 and IL-8 (D) from HT29 were measured as described in the Materials and Methods. Asterisks (*) indicate statistically significant differences compared with control (p < 0.001).
CdTe-QD effects on cytokine production from macrophages and epithelial cell in response to PA01
To investigate the effect of CdTe-QDs on the levels of expression of cytokines/chemokines from test cells in response to bacteria, J774A.1 and HT29 were pretreated with different concentrations of CdTe-QDs for 4 h and then exposed to PA01 for different durations. Treatment with PA01 alone resulted in elevated levels of different test cytokines/chemokines from J774A.1 and HT29 cells such as IL-1α, IL-1β, IL-6, IL-8, IL-12, GMCSF, GCSF, KC (CXCL-1), MCP-1, RANTES and TNF-α (data not shown). Also treatment of sub-cytotoxic concentrations of CdTe-QDs (less than 10-2 µg/ml) alone caused no elevation in levels of all tested cytokines compared with the controls. However, pre-exposure of CdTe-QD concentrations from 10-7 to 10-3 µg/ml attenuated TNF-α and KC levels from J774A.1 and IL-8 level from HT29 by two- to fivefold compared with exposures with PA01 alone (). This effect was not observed with CdTe-QD concentrations that were less than 10-7 µg/ml (data not shown).
Discussion
This study extends previous efforts aimed at understanding the potential mechanisms of interaction between NPs such as CdTe-QDs and mammalian cells of different functions. Here we used cell lines known to exhibit functions related to macrophage (J774A.1) and colonic epithelium (HT29) in order to investigate potential exposure effects of two sources of manufactured CdTe-QDs on their respective capacities to function and generate key immune-related responses, in particular when challenged in exposures to opportunistic bacteria such as P. aeruginosa. The particular strain (PA01) that was used is well characterised in terms of genomics and proteomics and is of interest to clinicians as well as biotechnologists (Labaer et al. Citation2004). The two CdTe-QDs that were used are similar in regard to supplier's claims about composition chemistry, size and concentration as aqueous solutions. Before use, some of the parameters were examined by obtaining fluorescence spectra, developing fluorescence intensity versus concentration curves and image analysis (for size and composition). The results indicated that both products were indeed similar, essentially homogeneous and spherical-shaped particles. Particulate diameters, while similar for both products, were slightly different according to AFM analysis (5.1–10.1 nm) than TEM analysis (6.2–21.5 nm). The average number of particles seen was very similar, when supplier concentration differences were adjusted according to the fluorescence standard curves developed. Based on these concentration adjustments, the standardised dose-dependent exposures using these two CdTe-QD sources yielded similar and consistent effects for the two cell types tested.
The comparative exposure studies of both sources of QDs showed that both cell types exhibited similar trends in damage and that the NPs caused dose- and time-dependent toxicity. Our exposure results agree with recent observations (Su et al. Citation2009) showing that CdTe/CdSe-QDs caused changes in bioreduction (measured by the same MTT assay we used) and cellular morphology of exposed human K562 erythroleukemia and human HEK293T embryonic kidney cell lines, and that these changes were dose and time dependent.
Our findings align to some extent with the cytotoxicity studies that also used J774A.1 (Clift et al. Citation2010a), which investigated CdTe/CdSe/ZnS QDs coated with different surface chemistries. The study indicated that organic QDs (95% decane, 2% trioctyl phosphine and 2% trioctyl phosphine oxide) caused a significant decrease in metabolic activity beginning at 2 h even with concentrations as low as 20 nM, which resulted in disruption of cell morphology after 24 h. The same study indicated that the cytotoxicity of carboxylated (COOH) polyethylene and amino (NH2) polyethylene QDs were less toxic than that of test organic QDs. Our test QDs are also considered to be COOH QDs because they are coated with polyacrylic acid derivative polymer. The greater cytotoxic effects observed with our test QDs, compared with COOH QDs from the previous study, might be due to the difference in coating chemistry and/or in core and/or size of the test QDs. The QDs used in Clift et al. (Citation2010a) were composed of a CdTe/CdSe core with average size of 15–21 nm (Clift et al. Citation2008), while our test QDs have only CdTe as the core and are smaller in size (7.3 nm with AFM and 14 nm with TEM).
In the present study, we found that J774A.1 cells were more sensitive to CdTe-QD exposures than HT29 cells, in terms of metabolism loss (bioreduction), changes in morphology and rate of QD internalisation. Our observations add to a previous study by Shiohara and colleagues (Citation2004), who compared different cell lines for QD sensitivity and found that cytotoxicity was dependent on the cell type exposed. In this previous study, the authors showed that mercapto-undecanoic acid (MUA) QDs caused less cell damage in Vero cells (African green monkey kidney cells) than in HeLa and human primary hepatocyte cells (Shiohara et al. Citation2004). In a study using similar in vitro cell models as ours, Lai et al. (Citation2008) found that NPs were extensively taken up by RAW 264.1 macrophage-related cells and much less by Caco-2 colonic epithelial cells. The mechanisms for increased QD internalisation by macrophage-related cells like RAW264 and J774A.1 are still unclear. The mechanisms might involve transcytosis (Lai et al. Citation2008; Sadauskas et al. Citation2007), macropinocytosis (Bartneck et al. Citation2010), but have also been shown to involve LDL/Scavenger receptor and the G-protein-coupled receptor pathways (Zhang & Monteiro-Riviere Citation2009). One explanation for the differences in CdTe-QD effects on test cell lines in our study is that, compared with J774A.1 macrophages, HT29 cells are larger and more metabolically active (relative bioreducing activity is about two to three times more than that of J774A.1). The larger cell size may necessitate more QDs for the equivalent exposure on a per cell basis. A study by Chang and colleagues (Citation2007) proposed that human cells lines such as HT29 tend to be resistant to silica NP toxic effects because of their high metabolic activity. However, differences in CdTe-QD effects on J774A.1 and HT29 cells could also be related to cell type: HT29 cells do not usually exhibit macrophage, particulate engulfment properties such as J774A.1 and are likely less permeable than J774A.1 cells because of their apical-basal polarity/tight cell–cell junction properties (Fogh & Trempe Citation1975).
The present study goes further than previous QD studies by examining the effects of CdTe-QDs on test cell interactions related to their immune responses towards bacteria. The dose–time studies that monitored levels of NO and a number of chemokine/cytokines indicated little or no changes in the two cell lines from QD treatments alone. Our results agree with the findings in a recent study by Clift and colleagues (Citation2010b), who examined the effects of different surfaced-coated quantum dots, including organic, carboxylated (COOH) and amino (NH2) polyethylene glycol (PEG) CdTe/CdSe (core)/ZnS (shell), on cell signalling in J774A.1. As shown in our study, Clift and colleagues also found that test QDs caused negligible or limited TNF-α production. Our current study further showed that when J774A.1 macrophage and HT29 epithelial cell lines were challenged with PA01 bacteria cells after pretreatments with CdTe-QDs, the cytotoxic effects of PA01 were greater. These observations suggest that CdTe-QDs, even at low doses that did not cause any observable cytotoxic effects, still have capacity to weaken the target cells, and as a result they become less able to cope in interactions with PA01. To our knowledge, this is the first report demonstrating CdTe-QD effects on cytotoxicity in mammalian cells as a result of bacterial exposures.
The effects of CdTe-QDs on test cell immune responses towards bacteria were also examined by assessing production levels of innate immune markers such as NO and various cytokine levels, which are major mediators of the host defence response to microbial pathogens (Fick Citation1993). To investigate these effects, the experiments were done with media containing the antibiotic gentamicin. This antibiotic is known to inactivate PA01, which should result in the reduction of the rapid cytotoxic effects of live PA01 that may mask any effects imparted by CdTe QDs. In preliminary work, we found that the presence of gentamicin showed no effect on the effects observed with CdTe-QDs alone at various doses. Further, exposures of J774A.1 and HT29 cells to PA01 alone induced several response pathways for different inflammatory cytokines (IL-1α, IL-1β, IL-6, IL-8, IL-12, GM-CSF, G-CSF, MCP-1, RANTES and TNF-α), chemokines (KC/CXCL-1 and IL-8) and NO. However, pre-exposures to low doses of CdTe-QDs selectively altered the PA01 induced immunologic response pattern of both cell types, decreasing levels of NO, TNF-α and KC in J774A.1 and IL-8 in HT29. The suppressive effects caused by CdTe-QDs on the levels of these mediators in response to PA01 showed no clear dose dependence. The exceptions were for the production of NO, KC and TNF-α from J774A.1 cells at the highest tested CdTe-QD concentrations. In these cases, the levels of pro-inflammatory mediators were decreasing as CdTe concentration increased. This may have resulted from CdTe-QD-induced cytotoxicity causing decreased numbers of viable macrophage, which in turn lead to reduced immune mediator levels. Since cytotoxicity caused by CdTe-QDs at highest doses was less severe in HT29 compared with J774A.1, the decrease in HT29 IL-8 level was also limited compared with J774A.1 cytokines. The suppressive effect of lower concentrations of CdTe-QDs is likely not due to cell death, because no cytotoxicity was observed in test cells at these concentrations. The dose-independent effect of CdTe-QDs on immune mediator production in response to PA01 suggests that the mechanism(s) of CdTe-QD action on immune response modulation is complex. CdTe-QDs might act on one or more levels for mediator expression, as well as on pathways involved in the expression of other mediators. In addition, because the levels of the other cytokines/chemokines tested were not affected, the effects of CdTe-QDs on immune responses directed towards PA01 appear to be pathway specific. Further research is needed to develop additional toxicity biomarkers to distinguish the nature of cell injury and death and define QD effects at the molecular level.
NO production by immune-related cells is known to play key roles in defence against bacteria such as P. aeruginosa (Bogdan et al. Citation2000; MacMicking et al. Citation1995). In this study, untreated J774A.1 was shown to produce NO, which was increased by 25-fold on exposure to PA01. Even though exposures to CdTe-QDs alone did not cause production of NO, pre-exposure of J774A.1 to low doses of CdTe-QDs followed by PA01 exhibited a decrease in NO. The results suggest that CdTe-QDs could affect NO-dependent pathways, suppressing a critical macrophage effector for bacterial killing. It is unclear whether CdTe-QDs have similar effects on HT29 cell NO production as these cells do not produce significant NO quantities during PA01 exposure. However, further experiments on QD effects on NO production are possible using cells pre-stimulated with cytokines such as TNF-α (Kolios et al. Citation1995).
Similar to the patterns observed in the loss of NO production in responses to PA01 with pre-exposures to QDs, the levels of chemokines such as KC/CXCL-1 in J774A.1 and IL-8 in HT29 were affected. These chemokines are homologues (KC/CXCL-1 in mouse and IL-8 in human) and function as neutrophil chemo-attractants during bacterial infection (Matsushima et al. Citation1989). The attenuation of these chemokines in this study suggests effects of CdTe-QDs on leukocyte recruitment signalling pathway.
In immune responses to bacteria, production of TNF-α mediates the induction of acute phase response (APR) cytokines such as IL-1β and IL-6 (Baumann & Gauldie Citation1994), production of reactive oxygen and nitrogen species, and activation of leukocyte-specific chemotactic cytokines or chemokines ((Strieter et al. Citation1993; Tessier et al. Citation1997). In this study, pre-exposure of CdTe-QDs caused a decrease in TNF-α level, but not other cytokines such as IL-1β and IL-6, indicating that CdTe-QDs may exert an immunosuppressive effect on macrophage involving pathways other than the APR. Since TNF-α mediates the production of NO and neutrophil attractant chemokines such as KC/CXCL-1 and IL-8, the decrease in NO and these chemokines levels from CdTe-QD pre-exposures might actually be a consequence of reduced TNF-α levels. The suppression of TNF-α production was also reported in a study by Hsiao and colleagues (Citation2009), who showed that macrophage exposure to magnetic NPs caused a decrease in TNF-α and IL-1β, and also a decrease in NO levels, even in response to LPS stimulation. The suppression of neutrophil chemo-attractants together with the decrease in NO and TNF-α in test cells in our study suggest that CdTe-QDs could impair the ability of these immune cells to perform their anti-microbial functions in fighting bacterial infection.
Conclusion
This study demonstrates that CdTe-QDs had toxic effects on J774A.1 macrophages and HT29 epithelial cells. At high concentrations, CdTe-QDs were cytotoxic as shown by the drop in cell metabolism and changes in cell structures. However, sub-cytotoxic concentrations of CdTe-QDs caused a reduction in NO, TNF-α, KC/CXCL-1 and IL-8 production leading to suppression of these cells in response to PA01 exposure. The study reveals that pre-exposure to CdTe-QDs might impair target cell metabolism and immune responses to bacteria, which in turn could result in elevated susceptibility of hosts to manage infection. The study also provides direction for more detailed study of QD molecular, subcellular interactions and other toxicity biomarkers, and also further work focused on in vivo immunologic effects resulting from exposures to low doses of QDs and challenges with whole or parts of bacteria.
Declaration of interest
The authors report no conflicts of interest. The authors alone are responsible for the content and writing of the paper.
Acknowledgements
The authors thank Dr Hongyan Dong and Dr David Lefebvre for reviewing the manuscript. This work was supported by Canadian Regulatory System for Biotechnology and intramural Chemical Management Plan (CMP) Monitoring and Surveillance Funding.
References
- Bartneck M, Keuls HA, Zwadlo-Klarwasser G, Grolls J2010. Phagocytosis independent extracellular nanoparticle clearance by human immune cells. Nano Lett 10:59–63.
- Baumann H, Gauldie J1994. The acute phase response. Immunol Today 15(12):74–80.
- Bogdan C, Röllinghoff M, Diefenbach A2000. The role of nitric oxide in innate immunity. Immunol Rev 173:17–26.
- Bruchez M Jr, Mironne M, Gin P, Weiss S, Alivisators AP1998. Semiconductor nanocrystals as fluorescent biological labels. Science 281(5385):2013–2016.
- Canesi L, Ciacci C, Betti M, Fabbri R, Canonico B, Fantinati A, 2008. Immunotoxicity of carbon black nanoparticles to blue mussel hemocytes. Environ Int 34(8):1114–1119.
- Chan WC, Maxwell DJ, Gao X, Bailey RE, Han M, Nie S2002. Luminescent quantum dots for multiplexed biological detection and imaging. Curr Opin Biotechnol 13(1):40–46.
- Chang JS, Chang KLB, Hwang DF, Kong JL2007. In Vitro cytotoxicity of silica nanoparticles at high concentrations strongly depends on the metabolic activity type of the cell line. Environ Sci Technol 41:2064–2068.
- Clift MJD, Boyles MSP, Brown DM, Stone V2010b. An investigation into the potential for different surface-coated quantum dots to cause oxidative stress and affect macrophage cell signalling in vitro. Nanotoxicology 4(2):139–149.
- Clift MJD, Rothen-Rutishauser B, Brown DM, Duffin R, Donaldson K, Proudfoot L, 2008. The impact of different nanoparticle surface chemistry and size on uptake and toxicity in a murine macrophage cell line. Toxicol Appl Pharmacol 232:418–427.
- Clift MJD, Varet J, Hankin SM, Brownlee B, Davidson AM, Brandenberger C, 2010a. Quantum dot cytotoxicity in vitro: an investigation into the cytotoxic effects of a series of different surface chemistries and their core/shell materials. Nanotoxicology Early Online 1–11.
- Coburn J, Frank D1999. Macrophages and epithelial cells response differently to pseudomonas aeruginosa type iii secretion system. Infect Immun 67:3151–3154.
- De Wild M, Berner S, Suzuki H, Ramonio L, Baratoff A, Jung TA2003. Molecular assembly and self-assembly: molecular nanoscience for future technologies. Ann N Y Acad Sci 1006:291–305.
- Derfus AM, Chan WCW, Bhatia SN2004. Probing the cytotoxicity of semiconductor quantum dots. Nano Lett 4:11–18.
- Fick RB1993. Pseudomonas aeruginosa, the opportunist: pathogenesis and disease. Boca Raton, Forida: CRC Press. pp 1–5.
- Fogh J, Trempe G1975. New human tumor cell lines. In: Fogh J, editor. Human Tumor Cells in Vitro. New York: Plenum Press. pp 115–141.
- Gagné F, Fortier M, Yu L, Osachoff H L, Skirrow RC, van Aggelen G, 2010. Immunocompetence and alterations in hepatic gene expression in rainbow trout exposed to cds/cdte quantum dots. J Environ Monit 12:1556–1565.
- Gagné F, Auclair J, Turcotte P, Fournier M, Gagnon C, Sauvé S, 2008. Ecotoxicity of CdTe quantum dots to freshwater mussels: impacts on immune system, oxidative stress and genotoxicity. Aquat Toxicol 86(3):333–340.
- Gao X, Cui Y, Levenson RM, Chung LW, Nie S2004. In Vivo Cancer targeting and imaging with semiconductor quantum dots. Nat Biotechnol 22(8):969–976.
- Godt J, Scheidig F, Grosse-Siestrup C, Esche V, Brandenburg V, Reich A, 2006. The toxicity of cadmium and resulting hazards for human health. J Occup Med Toxicol 1:22.
- Hardman R2006. A toxicologic review of quantum dots: toxicity depends on physicochemical and environmental factors. Environ Health Perspect 114(2):165–172.
- Hsiao JK, Weng TI, Tai MF, Chen YF, Wang YH, Yang CY, 2009. Cellular behaviour change of macrophage after exposure to nanoparticles. J Nanosci Nanotechnol 9(2):1388–1393.
- Huttunen K, Hyvärinen A, Nevalainen A, Komulainen H, Hirvonen MR2003. Production of Pro-inflammatory mediators by indoor air bacteria and fungal spores in mouse and human cell lines. Environ Health Perspect 111(1):85–92.
- Jang J, Lim DH, Choi IH2010. The Impact of nanomaterials in immune system. Immune Netw 10(3):85–91.
- Kimura H, Sawada T, Oshima S, Kozawa K, Ishioka T, Kato M2005. Toxicity and roles of reactive oxygen species. Curr Drug Target -Inflamm Allergy 4(4):489–495.
- Kirchner C, Liedl T, Kudera S, Pellegrino T, Javier AM, Gaub HE, 2005. Cytotoxicity of colloidal cdse and cdse/zns nanoparticles. Nano Lett 5:331–338.
- Kolios G, Brown Z, Robson RL, Robertson DA, Westwick J1995. Inducible nitric oxide synthase activity and expression in a human colonic epithelial cell line, ht-29. Br J Pharmacol 116(7):2866–2872.
- LaBaer J, Qiu QQ, Anumanthan A, Mar W, Zuo D, Murthy TVS, 2004. The Pseudomonas aeruginosa PA01 gene collection. Genome Res 14:2190–2200.
- Lai Y, Chiang P-C, Blom J, Li N, Shevlin K, Brayman T, 2008. Comparison of in vitro nanoparticles uptake in various cell lines and in vivo pulmonary cellular transport in intratracheally dosed rat model. Nanoscale Res Lett(3):321–329.
- Lovrić J, Bazzi HS, Cuie Y, Fortin GRA, Winnik FM, Maysinger D 2005. Differences in subcellular distribution and toxicity of green and red emitting cdte quantum dotsJ Mol Med 8:377–385.
- Lovrić J, Cho SJ, Winnik FM, Maysinger D2005. Unmodified cadmium telluride quantum dots induce reactive oxygen species formation leading to multiple organelle damage and cell death. Chem Biol 12(11):1227–1234.
- MacMicking JD, Nathan C, Hom G, Chartrain N, Fletcher DS, Trumbauer M, 1995. Altered responses to bacterial infection and endotoxic shock in mice lacking inducible nitric oxide synthase. Cell 81(4):641–650.
- Matsushima K, Oppenheim JJ1989. Interleukin 8 and MCAF: Novel inflammatory cytokines inducible by IL 1 and TNF. Cytokine 1(1):2–13.
- Michalet X, Pinaud FF, Bentolila LA, Tsay JM, Doose S, Li JJ, 2005. Quantum dots for live cells, in vivo imaging, and diagnostics. Science 307:538–544.
- Rzigalinski BA, Strolbl JS2009. Cadmium-containing nanoparticles: perspectives on pharmacology & toxicology of quantum dots. Toxicol Appl Pharmacol 238(3):280–288.
- Sadauskas E, Wallin H, Stoltenberg M, Vogel U, Doering P, Larsen A, 2007. Kupffer cells are central in the removal of nanoparticles from the organism. Part Fibre Toxicol 4:10.
- Samia ACS, Dayal S, Burda C2006. Quantum dot-based energy transfer: perspectives and potential for applications in photodynamic therapy. Photochem Photobiol 82(3):617–625.
- Scherer F, Anton M, Schillinger U, Henke J, Bergemann C, Kruger A2002. Magnetofection: enhancing and targeting gene delivery by magnetic force in vitro and in vivo. Gene Ther 9(2):102–109.
- Shiohara A, Hoshino A, Hanaki K, Suzuki K, Yamamoto K2004. On the cyto-toxicity caused by quantum dots. Microbiol Immunol 48(9):669–675.
- Strieter RM, Kunkel SL, Bone RC1993. Role of tumor necrosis factor-alpha in disease states and inflammation. Crit Care Med 21(10 Suppl):S447–463.
- Su Y, He Y, Lu H, Sai L, Li Q, Li W, 2009. The cytotoxicity of cadmium based, aqueous phase-synthesized quantum dots and its modulation by surface coating. Biomaterials 30:19–25.
- Svendsen C2008. Nanoparticle Immunotoxicity Using an Environmental Sentinel As A Model. NERC/Centre for Ecology & Hydrology.
- Tayabali AF, Seligy VL2000. Human Cell exposure assays of bacillus thuringiensis commercial insecticides: production of bacillus cereus-like cytolytic effects from outgrowth of spores. Environ Health Perspect 108:919–930.
- Tessier PA, Neccach PH, Clark-Lewis I, Gladue RP, Neote KS, Mccoll SR1997. Chemokine networks in vivo: involvement of C-X-C and C-C chemikines in neutrophil extracasation in vivo in response to TNF-alpha. J Immunol 159:3595–3602.
- Villiers CL, Freitas H, Couderc R, Villiers MB, Marche PN2010. Analysis of the toxicity of gold nanoparticles on the immune system: effect on dendritic cell functions. J Nanopart Res 12:55–60.
- Wu X, Liu H, Liu J, Haley KN, Treadway JA, Larson JP, 2003. Immunofluorescent labeling of cancer marker her2 and other cellular targets with semiconductor quantum dots. Nat Biotechnol 21:41–46.
- Zhang LW, Monteiro-Riviere NA2009. Mechanisms of quantum dot nanoparticle cellular uptake. Toxicol Sci 110(1):138–155.