Abstract
The increasing presence of ZnO nanoparticles (NPs) in consumer products may be having a dramatic impact in aquatic environments. The evaluation of ZnO NP toxicity represents a great challenge. This study aimed at evaluating the cytotoxic effect of micro- and nanosized ZnO in a fish and a mammalian hepatoma cell line. A detailed characterisation of the particles in exposure media showed that ZnO NPs formed large aggregates. ZnO cytotoxicity was evaluated with a battery of in vitro assays including LUCS, a new approach based on DNA alteration measurements. In fish cells, ZnO NP aggregates contributed substantially to the cytotoxic effects whereas toxicity in the human cells appeared to be mainly produced by the dissolved fraction. ROS production did not contribute to the observed cytotoxicity. This work also showed that measuring concentrations of NPs is essential to understand the mechanisms underlying their toxicity.
Keywords::
Introduction
Metal oxide nanoparticles (NPs) are receiving increasing attention in material sciences and nanotechnology-based industries for a large variety of applications leading to the increasing presence of NPs in commercial products. Among NPs, ZnO is frequently used in personal care products such as sunscreens, ceramics, rubber processing, waste water treatment and even as a fungicide (Wong et al. Citation2010). Due to the increasing volumes of consumer products containing ZnO NPs, the probability that they will enter the environment and particularly the aquatic ecosystems is heightened. It has been suggested that the use of TiO2, ZnO and Fe2O3 in sunscreens represents, by itself, a potential discharge of 250 tonnes/year into the marine environment (Wong et al. Citation2010). Moreover, the potential risks towards occupational workers and consumers are not clearly established. Thus, it is urgent to assess NPs real ecotoxicological impacts. While there has been an increasing number of research articles focused on the impact of these NPs on human health, there is less knowledge on their potential toxicity to wildlife and aquatic biota.
The biological activity of NPs is dependent on many factors, some of which include size, shape and surface properties that are different from their larger sized counterparts. These physico-chemical properties will influence the NPs tendency to agglomerate or aggregate, as well as their ability to adsorb onto surfaces. NPs behaviour will not only be a function of the surface chemistry of the NPs, but will also be affected by the composition of NPs, the presence of any coatings, the dissolution of material from the particle surface into solution and the presence of any soluble substances in the preparation. A particular concern for metal-based NPs, regarding their small size and large surface area, is the dissolution of metal ions from the surface of the particle. This process may eventually lead to the complete dissolution of the particle leaving only metal ions remaining in solution (Handy et al. Citation2008a; Dhawan & Sharma Citation2010). For all these reasons, NPs require much more extensive particle characterisation than other chemical compounds. Incomplete characterisation will hinder attempts to find a correlation between various biological effects and particle properties, leading to the misinterpretation of results (Handy et al. Citation2008a). These properties have to be considered carefully, thus appropriate analytical techniques must be applied to measure size, shape and state of aggregation or agglomeration and to quantify the real NP concentration.
In vitro assays based on cell lines are employed as one of the first steps for understanding the toxicity and mechanism of action of a compound. ZnO NPs have been shown to produce in vitro cytotoxic, genotoxic, inflammatory and oxidative stress responses in different mammalian cells (Xia et al. Citation2008; Yang et al. Citation2009; Huang et al. Citation2010; Song et al. Citation2010; De Berardis et al. Citation2010; Yuan et al. Citation2010; Hsiao & Huang Citation2011; Pujalté et al. Citation2011). Studies in mammalian cell lines also attributed the toxicity of ZnO NPs, at least in part, to their solubility, the latter leading to Zn ion formations (Xia et al. Citation2008; De Berardis et al. Citation2010; Song et al. Citation2010). It was also proposed that the production of reactive oxygen species (ROS) is the main factor responsible for the observed cytotoxicity (Xia et al. Citation2008; Sharma et al. Citation2009; De Berardis et al. Citation2010; Huang et al. Citation2010; Song et al. Citation2010). The contribution of the size and shape to the mammalian cytotoxicity of different ZnO NPs has also been reported, but different conclusions have been reached (Lin et al. Citation2009; Deng et al. Citation2009; Hsiao & Huang Citation2011).
A limited amount of studies have been carried out in aquatic organisms and fish cell lines. It has been reported that ZnO NPs are toxic to isolated trout hepatocytes (Scown et al. Citation2010), Daphnia magna (Adams et al. Citation2006, Heinlaan et al. Citation2008) as well as zebrafish embryos and larvae (Zhu et al. Citation2008, Citation2009). Acute toxicity studies of ZnO NPs and bulk ZnO in different marine organisms such as algae, crustaceans and medaka fish, concluded that the toxicity of ZnO NPs could be mainly attributed to dissolved Zn ions (Franklin et al. Citation2007; Wong et al. Citation2010). However, other authors ascribed the toxicity also to ZnO NPs and the bulk ZnO themselves. This was the case in adult zebrafish (Xiong et al. Citation2011), Daphnia magna (Wiench et al. Citation2009), the bacterium Vibrio fischeri, the branchipod Thamnocephalus platyurus (Heinlaan et al. Citation2008) and the microalga Pseudokirchneriella subcapitata (Aruoja et al. Citation2009).
The main objective of this work was to determine if ZnO NPs exhibit differences in their mechanisms of toxic action in a fish and in a mammalian hepatoma cell line. These cell lines have been selected because the liver plays an essential role in detoxification processes and because this organ has been identified as one of the major target organs of NPs, particularly in fish (Handy et al. Citation2008a, Citationb; Kashiwada Citation2006). For fish, the PLHC-1 cell line has been chosen because culture conditions (30°C, 5% CO2 atmosphere) are closer to those of most of the mammalian hepatoma cell lines used up until now in cytotoxicity studies. A battery of cytotoxicity assays covering different mechanisms of toxicity has been employed. In order to better characterise these mechanisms, the observed toxicity was related to the size and the shape of the NPs and with the possible effect of the fraction corresponding to the dissolved NPs. In addition to the usual cytotoxicity assays, LUCS (light-up cell signal), a new fluorescent method addressing DNA alteration status has been used. This method relies on the light-induced fluorescence intensity enhancement of a DNA binding dye. It has been recently applied with success in cytotoxicity studies using Hep G2 cells (Derick et al. Citation2009). This assay was utilised in this work in order to acquire new cytotoxicity information at the DNA level, as well as to evaluate its sensitivity and possible application in fish cells.
Methods
Particles
Three commercial ZnO NPs differing in size were tested and compared with the bulk material. The ZnO fine powder <5 µm (99.9% purity), ZnO nanopowder <100 nm and ZnO nanopowder 6% aluminium-doped <50 nm (BET) (97% purity) (referred to in this work as ZnO, nZnO-1 and nZnO-2, respectively) were purchased from Sigma-Aldrich (Madrid, Spain). The ZnO nanopowder 20–30 nm (BET) (referred to as nZnO-3) was from Tecnan (Madrid, Spain).
Chemicals
Ultraglutamine 1 (200 mM), l-glutamine (200 mM), fetal bovine serum (FBS), penicillin and streptomycin (P/S) (10 000 U/ml/10 mg/ml), non-essential amino acids 100X (NEAA), cell culture EMEM (Eagle's Minimum Essential Medium) and α-MEM (Alpha-Minimum Essential Medium) media were purchased from Lonza (Barcelona, Spain). 4,5-Dimethylthiazoyl-(2-yl)-2,5-diphenyltetrazolium bromide (MTT), neutral red (NR) solution (0.33%), 6-carboxy-2′7′-dichlorofluorescein diacetate (DCFH-DA), chloramine-T trihydrate, 2-propanol and glacial acetic acid were from Sigma-Aldrich (Madrid, Spain). Ethanol was from Panreac (Barcelona, Spain). EvaTOX kit (Evakit; 5 mM solution in DMSO) for LUCS assay was from Novaleads (Ramonville, France). Trace analysis grade nitric acid 65% (Scharlau, Madrid, Spain) was purified by sub-boiling distillation in a Milestone Duopur (Milestone Srl., Italy).
Cell culture
The fish and the human hepatocellular carcinoma cell lines, PLHC-1 (derived from topminnow fish (Poeciliopsis lucida) and Hep G2 were obtained from the American Type Culture Collection (ATTC) (Manassas, VA, USA). The PLHC-1 cell line was cultured in α-MEM supplemented with 5% FBS, 1% P/S and 1% l-glutamine. Hep G2 cells were cultured in EMEM supplemented with 10% FBS, 1% P/S, 1% ultraglutamine and 1% NEAA. PLHC-1 and Hep G2 cells were grown in a 5% CO2 atmosphere at 30 and 37°C, respectively.
Exposure to NPs
PLHC-1 and Hep G2 cells were seeded in 96-well plates (Costar, VWR, Spain) at an initial cell number of 5 × 10⁴ and 7.5 × 10⁴ cells/well, respectively. After 24 h, the cells were exposed to serial dilutions (0.78–100 µg/ml) of the four different ZnO particles. Particle suspensions of 100 µg/ml were prepared in serum-free medium and vortexed for 1 min just before applying them to the cells. In order to investigate to which extent the dissolved ZnO fraction, in which Zn ions released from the particle surface may be present, contributes to the cytotoxicity, both cell lines were exposed to the supernatants of centrifuged ZnO particle suspensions. These supernatants were prepared with a 100 µg/ml particle suspension in serum-free medium and incubated for 24 h at 30 or 37°C to reproduce the time of exposure to the NPs. Subsequently, these suspensions were centrifuged for 10 min at 1000 g (Orto Alresa, Lince R). After the 24-h exposure period, the treated cells were analysed for cytotoxic effects by means of different assays.
Particle characterisation
Particle characterisation was performed on all the particle suspensions obtained after serial half dilutions of the initial one (100 µg/ml) in serum-free culture medium. This particle characterisation was also performed in the supernatants obtained after centrifugation of the 100 µg/ml particle suspensions. To select the speed of centrifugation, initially 100 µg/ml particle suspensions were centrifuged at 1000 g for 10 min or at 180 000 g for 1 h, after a 24-h incubation period at 30 or 37°C (to imitate exposure conditions). After centrifugation Zn concentration was measured in supernatants by means of inductively coupled plasma mass spectrometry (ICP-MS). Since differences in the Zn concentration between both supernatants were negligible, in order to facilitate the experimental work, cell exposure and further detailed characterisation were performed only in the supernatant obtained after centrifugation at 1000 g.
Transmission electron microscopy
Transmission electron microscopy (TEM) was performed to morphologically characterise the particle suspensions. Both pristine particles as well as particles incubated in serum-free culture media for 24 h at 30 or 37°C were analysed. The samples were prepared by dropping aliquots of the particle suspensions onto carbon-coated copper grids and leaving the solvent to evaporate. Subsequently, the samples were analysed using a JEOL 2100 HT (JEOL Ltd., Japan) operated at an accelerating voltage of 200 kV with integrated energy dispersive X-ray (EDX) spectroscopy (Oxford Inca). The size of the particles (ferret diameter) in the TEM micrographs was measured using the image processing and analysis software ImageJ (National Institutes of Health, USA).
Dynamic light scattering
Dynamic light scattering (DLS) was used as a method to determine the hydrodynamic size of the particles in solution, using a Zetasizer Nano-ZS (Malvern Instruments Ltd., UK). Measurements were performed in the suspensions and in the supernatants at different concentrations directly after preparation and after 24 h incubation at 30 or 37°C. Medium without particles was used as a control and to record any background signals that may arise from medium components. Before preparing the samples the instrument temperature was set to 37°C for EMEM preparations and to 30°C for α-MEM preparations. Four independent measurements were taken with each measurement consisting of six runs, each of 20 s duration.
Inductively coupled plasma mass spectrometry
The Zn concentration in each well of the treated plates, the original particle suspension (100 µg/ml) and the supernatants obtained after centrifugation of the original particle suspension at 1000 g for 10 min or after ultracentrifugation at 180 000 g for 2 h was determined by means of an ICP-MS Thermo X-Series II (Thermo Scientific, Bremen, Germany) equipped with a quadrupole mass analyser and an electron multiplier detector. A Meinhard nebuliser with Scott (Ryton) spray chamber (Elemental Scientific Inc., Omaha, NE, USA) and a peristaltic pump were used for sample introduction. The optimisation of plasma-operating parameters and mass calibration were performed with a certified multi-element solution Tune A (As, Ba, Be, Bi, Ce, Co, In, Li, Ni, Pb and U) supplied by Analytika Ltd. (Czech Republic). The sample solutions were quantified by external calibration; three isotopes of Zn (64Zn, 66Zn and 68Zn) were used for measurements to discard the presence of isobaric interferences. An internal standard (Ga) was used in order to check instrumental stability and to correct potential effects of the matrix on the signal. Calibration standard solutions of Zn and internal standard solution of Ga were prepared daily with the appropriate dilution of 1000 mg/l Zn in 2% (v/v) and 1000 mg/l Ga in 2% (v/v) stock standard solutions (Alfa Aesar, Ward Hill, MA, USA), respectively. High purity water (>18 MΩ cm-1) obtained from a Milli-Q Element A10 Century (Millipore Ibérica, Spain) was used. For the analysis of Zn concentrations in the exposed cells, the medium from each well was transferred into polypropylene flasks. The wells were washed twice with nitric acid 2% (v/v) for the digestion of the cells and for collecting the remaining ZnO NPs present in the wells. The rinses were added to the respective sample media, and the latter filled up with nitric acid 2% (v/v) to a final volume of 10 ml. Just before ICP-MS analysis, samples were ultrasonicated for 5 min. Limits of detection (LOD) and limits of quantification (LOQ) were calculated as being 3 and 10 times the standard deviation of the blank, respectively, considering as such the Hep G2 and PLHC-1 media, prepared as the samples. The LOD for the three isotopes ranged from 0.21 to 0.32 µg/l and the LOQ from 0.71 to 1.1 µg/l. The instrumental response was linear over the calibration range used for the measurements from 0.1 to 100 µg/l, with a relative standard deviation (RSD) <2%.
Cytotoxicity assays
MTT and NRU assay
The MTT assay evaluates the mitochondrial activity and was performed according to the method of Mosmann (Citation1983) based on the enzymatic conversion of the MTT tetrazolium salts to formazan crystals. The neutral red uptake (NRU) assay was used to determine the lysosomal membrane integrity following Borenfreund and Puerner (Citation1985). After exposure, the medium was replaced with 100 µl of phenol red-free MEM containing MTT (0.5 mg/ml) or NR (0.1 mg/ml). The plates were incubated for 2 or 4 h, respectively. The formazan crystals were dissolved by adding isopropanol whereas the retained NR dye was extracted with 1% glacial acetic acid in 50% ethanol. The absorbance was measured at 570 or 550 nm (MTT or NRU, respectively) using a microplate reader (Genios, TECAN, Männedorf, CH). Results were expressed as percentage of the control.
Lactate dehydrogenase leakage
The leakage of the cytoplasm enzyme lactate dehydrogenase (LDH) is commonly used as an indicator of xenobiotic-related damage of the cellular membrane. After the 24-h exposure period, the LDH activity in the medium and the cells was measured following the method of Liu et al. (Citation2010). Culture medium was removed and stored at 4°C for immediate analysis. Cells were washed with phosphate buffered saline (PBS) and the plates frozen by immersion in liquid nitrogen and stored at -20°C for 1 h to obtain a cell lysate. LDH enzymatic activity was measured in both the culture medium and the cell lysate. In this method, LDH catalyses the reduction of pyruvate to lactate with simultaneous oxidation of NADH to NAD+. The rate of NADH decrease, which is directly proportional to LDH activity, was measured at 340 nm in a temperature-controlled microplate reader set to 30 or 37°C for PLHC-1 or Hep G2, respectively. The quantity of LDH leaked from the cells into the culture medium was expressed as percentage of the total amount of LDH determined in the medium and cell samples.
LUCS assay
Nucleic acid alterations were measured by means of the Novaleads LUCS assay, according to Derick et al. (Citation2009). EvaTOX quantifies alterations in DNA organisation. This assay is based on the LUCS process patented method (PCT/EP2009/050235). Briefly, cells are exposed to a proprietary fluorescent DNA dye solution (EvaKit). Under normal (untreated) conditions, the combined effect of LED-based light (10 s) on a DNA-bound fluorescent dye leads to a fluorescent intensity enhancement, an effect that is lost after DNA damage response. For this assay, the cells were seeded into black 96-well plates (Greiner, Dismalab, Madrid, Spain). After 24 h of exposure, the medium was removed and replaced by 100 µl of a 4 µM EvaKit stain solution (prepared in serum-free culture medium). Subsequently, the PLHC-1 and Hep G2 cells were incubated at the corresponding temperature for 20 or 30 min, respectively. A first reading of the fluorescence (R1) was done at 485 nm excitation and 535 nm emissions in a microplate reader. The cells were illuminated for 10 s at 470 nm with a LED-based device (LED-based aDAPter, Novaleads, Ramonville, Fr). The fluorescence was then read over 20 min at 1 min intervals. For data analysis, the values obtained at the time at which no further increase in fluorescence occurred (usually after 10–15 min; R2) were divided by the respective values obtained in R1. In order to compare data, R2/R1 ratios were normalised between 0 and 100% considering the control R2/R1 value as 100% and R2/R1 = 1 as 0%.
ROS assay
Intracellular ROS production was determined by using the dichlorofluorescein (DCF) assay (Wang & Joseph Citation1999). DCFH-DA (100 µM) in phenol red and serum-free EMEM medium was added after the incubation period and maintained during 30 min at 37°C in the dark. Chloramine-T, an effective inducer of oxidative stress, was used as a positive control, with cells being exposed to concentrations in the range of 0.3–10 mM for 24 h. Fluorescence was measured at 485 nm excitation and 535 nm emission at 37°C using a microplate reader. Fluorescence readings were taken every 15 min for 60 min with the plates being incubated at 37°C with 5% CO2 between measurements. Oxidative stress was expressed as the percentage increase in fluorescence over a 60-min period.
Statistical analyses
Data are represented as mean ± standard error of the mean (SEM) of three to five independent experiments (in each experiment, each concentration was applied by triplicate in the culture plates). Significant differences among treatments were determined by one-way repeated measures analysis of variance (RMANOVA, p < 0.05). Previously, normality of the distribution was checked by means of the Shapiro-Wilk test and homoscedasticity by means of Bartlett's test. Means of treatments were contrasted with respect to the control group using Dunnett's test. For pairwise comparisons, a Student's t-test was used. The statistics were performed with the GraphPad Prism version 4.00 program for Windows (GraphPad Software, San Diego, CA, USA). The effective concentration for 50% maximal response (EC50) was calculated using Sigma Plot version 8.0 (Jandel Scientific, San Rafael, CA, USA). The estimation of the concentration–response function and the calculation of the IC50 (concentration causing a 50% of inhibition with respect to the controls) were done by fitting the assay results to a regression model equation for a sigmoid curve:
where max is the maximal response observed, b is the slope of the curve and min the minimal response.
Results
Characterisation of ZnO particles
TEM analysis
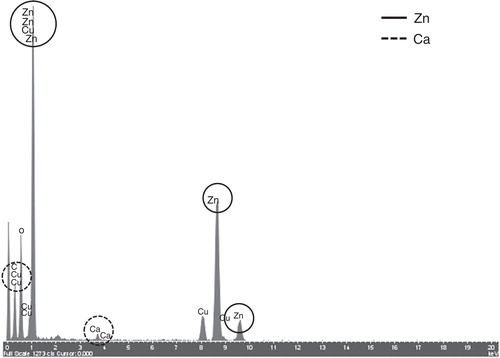
TEM analysis was performed to determine the morphology and the size distribution of ZnO particles. TEM micrographs of pristine ZnO particles are shown in . Different morphologies were observed in the four different ZnO particle powders used. Three types: polyhedral, rod-like and near-spherical-shaped particles, all showing clear edges and corners coexisted in each sample. shows the size distribution calculated from TEM images. The average length of the ZnO particles was 165, 51, 35 and 33 nm, for ZnO, nZnO-1, nZnO-2 and nZnO-3, respectively, with a median of 120, 40, 27 and 29 nm and a 75% percentile of 181, 66, 44 and 41 nm. ZnO particles incubated in EMEM and α-MEM media were also analysed by TEM (). The TEM images were acquired after 24 h of incubation of the 100 µg/ml suspensions in media at 37 or 30°C (). Some differences with respect to the pristine particles () were observed. In general, the particles in the culture media presented considerably more aggregation and were more irregular in shape with corners less defined than the primary powder. The EDX spectrum of the ZnO particle suspended in the EMEM medium clearly indicated the presence of calcium together with zinc ().
Figure 1. TEM micrographs of the pristine forms of the four different ZnO particles: A) ZnO, B) nZnO-1, C) nZnO-2 and D) nZnO-3. Scale bars are 100 nm for A, B and C, and 50 nm for D.
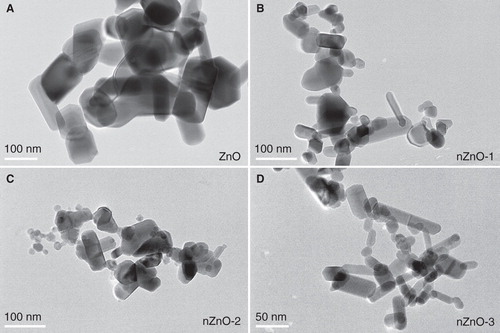
Figure 2. Frequency distribution of particle sizes (ferret diameter) derived from TEM micrographs of the pristine ZnO particles.
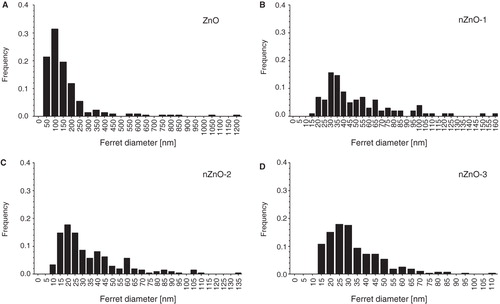
Figure 3. TEM images of ZnO particles after incubation in different cell culture media: A, B, C and D) ZnO, nZnO-1, nZnO-2 and nZnO-3 incubated for 24 h in α-MEM, respectively; E, F, G and H) ZnO, nZnO-1, nZnO-2 and nZnO-3 incubated for 24 h in EMEM, respectively. The white circle in E) marks the particle, which was exemplarily analysed by EDX spectroscopy (cf. ). The scale bars are 200 nm for A, B and F, 100 nm for C, E and G and 50 nm for D and H.
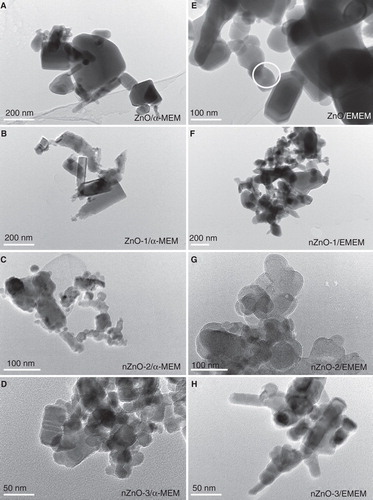
Figure 4. EDX spectrum of the surface of a ZnO particle incubated for 24 h in cell culture medium (cf. , white circle).
Dynamic light scattering
DLS was used to measure the hydrodynamic sizes of the particles in the culture media used for exposures. Measurements could only be obtained for concentrations ≥25 µg/ml. In addition, size distribution profiles were similar at each concentration. Therefore, only the hydrodynamic sizes and size distribution widths of the highest concentration (100 µg/ml) are presented in . According to the instrument specifications, not all particles present in the suspensions were in the detectable size range. The instrument reported samples of very high polydispersity and aggregates with diameters >6000 nm present. At the position selected, the maximum signal within the instrument range of detection was 80%. In general, the hydrodynamic size of each ZnO suspension was similar in both media at time zero but differed after 24 h incubation (). At time zero, ZnO, nZnO-1 and nZnO-2 formed aggregates of similar sizes ranging from 1134 to 1421 nm and from 957 to 1978 nm in EMEM and α-MEM medium, respectively. However, nZnO-3 formed larger size aggregates (2978 and 2504 nm in both media, respectively) in spite of the very similar size of the nZnO-2 and nZnO-3 pristine forms. After 24 h, similar sizes as in time zero could be observed for ZnO and nZnO-1 particles in both media. The nZnO-2 NPs were found to form aggregates of similar size than nZnO-3 NPs in the EMEM medium (2166 and 2481 nm, respectively). However, these later NPs behaved very differently in the α-MEM after 24 h. The nZnO-2 NPs seemed to de-agglomerate (from 1978 to 1091 nm), whereas the nZnO-3 increased considerably its size (from 2504 to 3753 nm). Since the apparatus indicated a very high degree of polydispersity, smaller particles could be present but their signal may be overshadowed by these bigger ones.
Table I. Particle sizes (nm) measured by DLS in EMEM and α-MEM media immediately after preparation and 24 h after incubation under the respective culture conditions.
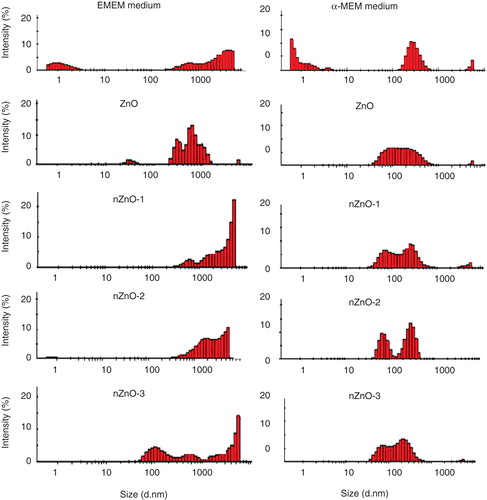
DLS measurements were also taken from the supernatants of the particle suspensions following centrifugation at 1000 g for 10 min. After centrifugation, a pellet of particles was evident on visual inspection. Control media were also incubated for 24 h and centrifuged as described. According to the DLS profiles of the control media (), some medium components could be detected at very low intensity. These profiles could be used as background controls to distinguish medium components from possible ZnO particles remaining in solution after centrifugation. Both medium controls presented different distribution profiles that differed from the particle profiles in the supernatants indicating the presence of NPs. In α-MEM medium, a particle population from approximately 30–100 nm could be measured for the four NPs that didn't appear in the medium control. In the EMEM, this clear difference could not be observed, except for the nZnO-3 NPs that exhibited a population between 50 and 200 nm and for the bulk ZnO with a population down around 20–50 nm, albeit, at relatively low intensity ().
Figure 5. DLS size distribution profile of the supernatants obtained by centrifugation (1000 rpm for 10 min) of the ZnO particle suspensions prepared in EMEM and α-MEM medium (100 µg/ml) incubated for 24 h at 37 and 30°C, respectively.
ICP-MS analysis
Total concentration of ZnO in the 100 µg/ml particle stock suspensions ranged between 108 and 128 µg/ml (). The different 100 µg/ml suspensions were maintained for 24 h at 30 or 37°C to reproduce the conditions of exposure and then centrifuged at 1000 g or ultracentrifuged at 180 000 g. Total ZnO concentrations were measured in both supernatants and were found to be similar, indicating that even ultracentrifugation is not able to remove the dissolved fraction further. The concentration of Zn measured by ICP-MS in the supernatants and expressed as ZnO ranged from 3.8 to 7.7 µg/ml in the Hep G2 medium (EMEM) and from 28.3 to 43.3 µg/ml in the PLHC-1 medium (α-MEM) (). To compare the toxic effects produced by the dissolved NPs and/or Zn ions, cells were exposed to serial half dilutions of only the centrifuged (1000 g) stock solutions. The concentrations of ZnO, as prepared by serial dilutions of the stock suspensions and subsequently used to treat the cells, are presented in . These concentrations were obtained by measuring the level of Zn present in each well after the assay was performed in both cell lines (Hep G2 (two repetitions) and in PLHC-1). The concentrations in both assays were similar and reproducible data were obtained between replicates. The mean and standard deviation of these measurements are presented in . The most limiting step is achieving a concentration of 100 µg/ml in the highest exposure concentration well. We measured a loss of 50–60% of the concentration probably due to the rapid sedimentation of the non-dissolved NPs and aggregates during the 100 µl aliquot collection from the stock suspension for cell exposure. Just after shaking the stock suspensions, we could observe a deposition of non-dissolved NPs beginning after 20 s and a clear precipitate in less than 60 s. Despite a twofold serial dilution, the real concentrations were 1.7–3.7 times lower than expected. The lower nominal doses (0.39, 0.78 and 1.56 µg/ml) exhibited a similar measured concentration as those from the controls. Zn is an important element required by many cellular enzymes and it is present in relatively high background levels in cells and tissues. Since ICP-MS cannot distinguish between ZnO and any other form of Zn present in the cells, therefore, lower ZnO particle doses may be hidden by background levels of Zn in cells. The concentrations indicated in for the cell lines exposed to half dilutions of the centrifuged stock solutions are estimates from those measured in the supernatants of the stock solution. The results indicate that PLHC-1 cells have been exposed to very similar concentrations before and after centrifugation, contrary to Hep G2 cell line, which have been exposed to lower concentrations after centrifugation.
Table II. Measured concentrations of total Zn by ICP-MS expressed as µg ZnO per ml.
Cytotoxicity of ZnO particles to PLHC-1 and Hep G2 cell lines
MTT reduction
The cytotoxicity of the suspensions of the four ZnO particles as well as of the supernatants obtained after centrifugation is shown in . Real concentrations are indicated in brackets together with nominal concentrations in the text and in the figures. In the PLHC-1 cell line, the bulk materials and the three NP suspensions provoked a significant reduction of cell viability () with non-observed effect concentrations (NOECs) values of 25 (7), 12.5 (5), 6.25 (2) and 12.5 (6) µg/ml for ZnO, nZnO-1, nZnO-2 and nZnO-3, respectively. In the case of the Hep G2 cells (), NOEC values of 25 (7), 25 (9), 25 (7) and 12.5 (6) µg/ml were obtained after exposure to the suspensions for ZnO, nZnO-1, nZnO-2 and nZnO-3, respectively. Thus, differences between PLHC-1 and Hep G2 cells in NOEC values appeared only for nZnO-1 and nZnO-2. In addition, no significant differences in cytotoxicity between both cells lines were observed except at the highest concentration (). At this concentration, loss in cell viability detected in Hep G2 was much stronger than in PLHC-1 cells, with significantly lower values in the bulk material, nZnO-1 and nZnO-3. PLHC-1 cells exposed to the supernatants also exhibited significant decreases in cell viability resulting in NOEC values of 25 (10), 12.5 (5), 25 (10), and 25 (10) µg/ml for ZnO, nZnO-1, nZnO-2 and nZnO-3, respectively (). In the case of Hep G2 cells treated with the supernatants, the NOEC values detected were 50 (3), 50(3), 100 (6) and 100 (6) µg/ml for ZnO, nZnO-1, nZnO-2 and nZnO-3, respectively (). Taking into account the NOEC values obtained for measured concentrations (), PLHC-1 cells were similarly sensitive to the suspensions and the dissolved fraction, except for nZnO-2 where the non-dissolved fraction (aggregates and suspended NPs) produced a higher toxicity. By contrast, Hep G2 cells were more responsive to the dissolved ions and NPs (). The relatively weak toxic effect that the studied ZnO particles provoked in the PLHC-1 cells did not allow a full dose–response curve to be established and the calculation of respective IC50 values (). Thus, the different-sized ZnO particles could not be ranked in terms of their absolute toxicity towards PLHC-1. This analysis could be performed with the results following exposures in the Hep G2 cell line. The IC50 calculated with the nominal concentrations for ZnO, nZnO-1, nZnO-2 and nZnO-3 were 53.6, 48.9, 65.2 and 34.0 µg/ml, respectively, showing the nZnO-3 as the most toxic (). However, the IC50 for real concentrations were 16.3, 18.6, 26.6 and 16.7 µg/ml, showing a similar toxicity for the NPs and the bulk material ().
Figure 6. Cytotoxicity of ZnO particles suspensions and supernatants in PLHC-1 and Hep G2 cells after 24 h exposure as determined with the MTT assay. Results are expressed as percentage of viability compared with the control. The measured concentration that corresponds to each nominal concentration is shown in brackets. A value of zero indicates that the measured concentrations were similar to those measured in control media without ZnO. Data are represented as the mean ± SEM of at least three independent experiments. Different symbols are used to indicate statistical significant differences (simple, double and triple superscripts correspond to p < 0.05, p < 0.01 and p < 0.001, respectively), asterisks (*) are used to indicate differences with respect to the controls, α is used to indicate differences between both cell lines.
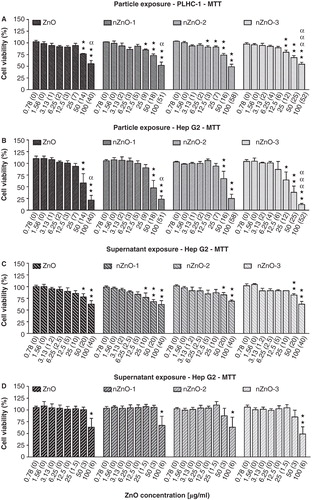
Table III. NOECs obtained for PS and Sup exposures of fish and mammalian cell lines by means of the different cytotoxicity assays taking into account measured concentrations.
Table IV. IC50 calculated from the cytotoxicity assay results after PS exposure of fish and mammalian cell lines.
NR uptake
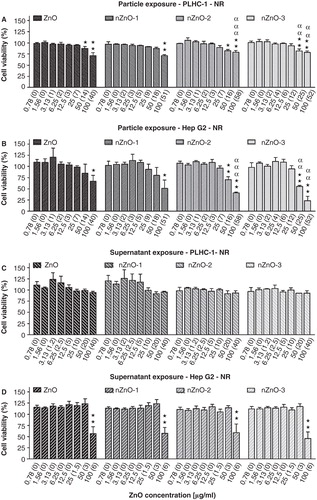
The cytotoxicity after exposure of the fish and the human hepatoma cell lines to the suspended and centrifuged ZnO suspensions measured by the NR assay is shown in . The NOECs for the PLHC-1 cells exposed to the particle suspensions were 25 (7), 50 (18), 25(7) and 25(12) µg/ml for ZnO, nZnO-1, nZnO-2 and nZnO-3, respectively (). For Hep G2, the NOECs were 50 (14), 50 (18), 25 (7) and 25 (12) µg/ml for ZnO, nZnO-1, nZnO-2 and nZnO-3, respectively (). When the NOECs obtained with the real concentrations were compared (), the PLHC-1 cells appeared to be more sensitive to the bulk material (7 µg/ml) than the Hep G2 cell line (14 µg/ml) but the NOECs in both cell lines were identical for the three NPs (18, 7 and 12 µg/ml for nZnO-1, nZnO-2 and nZnO-3, respectively). However, the toxic responses caused by nZnO-2 and nZnO-3 were significantly stronger in Hep G2 than in PLHC-1 cells at the highest doses (). The exposure to the supernatants didn't produce any cytotoxicity in the PLHC-1 cell line (). The NOECs after exposure of Hep G2 cells to the supernatants were 50 (3) µg/ml for the four particles (). Taking into account the NOEC values obtained for measured concentrations (), PLHC-1 cells were more sensitive to the suspensions than to the dissolved fraction whereas the Hep G2 cells were more sensitive to the dissolved fraction. No IC50 values could be calculated ().
Figure 7. Effects of ZnO particles suspensions and supernatants on PLHC-1 and Hep G2 cell viability after 24 h exposure as determined with the NR assay. Results are expressed as the percentage of viability compared with the control. The measured concentrations corresponding to the nominal concentrations are shown in brackets. A value of zero indicates that the measured concentration was similar to the one measured in control media without ZnO. Data are represented as mean ± SEM of at least three independent experiments. Different symbols are used to indicate statistical significant differences (simple, double and triple superscripts correspond to p < 0.05, p < 0.01 and p < 0.001, respectively), asterisks (*) are used to indicate differences with respect to the controls, α for differences between particle suspension exposures for each concentration in both cell lines.
LDH leakage
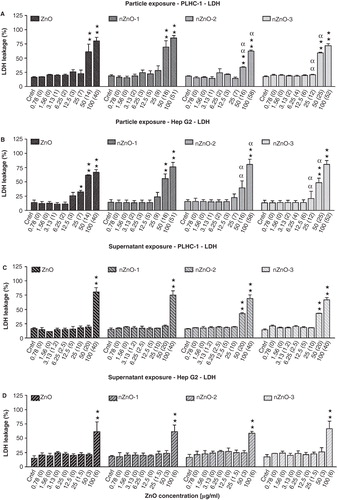
The membrane cytotoxic effects of the particle suspensions and supernatants are shown in . The NOECs of PLHC-1 cells after NP suspension exposure were 25 (7), 25 (9), 25 (7) and 25 (12) µg/ml and with the supernatants exposure, 50 (20), 50 (20), 25 (10) and 25 (10) µg/ml for ZnO, nZnO-1, nZnO-2 and nZnO-3, respectively (). For the Hep G2 cell line, the NOECs after NP suspension exposure were 12.5 (3), 25 (9), 50 (16) and 25 (12) µg/ml for ZnO, nZnO-1, nZnO-2 and nZnO-3, respectively and with the supernatants 50 (3) µg/ml for the four particles (). Taking into account the NOECs from real concentrations, the fish cell line was more sensitive to the ZnO and nZnO-1 suspensions than to the corresponding supernatants. However, these cells responded similarly to the suspensions and supernatants of the nZnO-2 and nZnO-3 NPs (). By contrast, the human cell line was more sensitive to the supernatants of the NPs, but showed similar sensitivity to the bulk material suspension and to the corresponding supernatant (). As shown in , treatment of PLHC-1 and Hep G2 cells with the different ZnO particles resulted in a dose-dependent LDH leakage. summarises the respective IC50 calculated from the full dose–response curve obtained. Using nominal concentrations, the values for PLHC-1 were 43.3, 39.5, 50.5 and 43.7 µg/ml for ZnO, nZnO-1, nZnO-2 and nZnO-3, respectively, whereas the values were 12.2, 14.1, 16.2 and 21.7 µg/ml when calculated using real concentrations. The IC50 values corresponding to the Hep G2 cell line were 26.4, 42.0, 60.1 and 48.8 µg/ml with nominal concentrations and 7.6, 15.2, 18.4 and 24.3 µg/ml with real concentrations. When considering the measured concentrations to which cells have been exposed, both cell lines showed similar sensitivity to the four NPs.
Figure 8. LDH leakage expressed as percent of control after exposure to serial dilutions of ZnO particle suspensions or supernatants in PLHC-1 and Hep G2 cells. The measured concentration that corresponds to each nominal concentration is represented in brackets. A value of zero indicates that the measured concentration was similar to the one measured in control media without ZnO. Columns represent the mean ± SEM of at least three independent experiments. Different symbols are used to indicate statistical significant differences (simple and double superscripts correspond to p < 0.05 and p < 0.01, respectively). Asterisks (*) were used to indicate differences with respect to the controls, α for differences between particle suspension exposures for each concentration in both cell lines.
LUCS assay
ZnO, nZnO-1, nZnO-2 and nZnO-3 showed no cytotoxicity over a wide range of nominal concentrations (0.78–50 µg/ml) in PLHC-1 cells (). However, at the highest nominal concentration (100 µg/ml) a sharp drop, to values lower than 20%, could be observed for all particles. The ZnO particles were more toxic to the Hep G2 cell line () with NOEC nominal values of 25 µg/ml for ZnO, nZnO-1 and nZnO-2 and lower for nZnO-3, and NOEC real values of 7, 9, 7 and 6 µg/ml, respectively. The IC50 values of the particles in these cell lines are shown in . For the fish cells, IC50 values were of 93.0 (36.3), 52.9 (18.9), 94.9 (55.8) and 93.7 (48.5) µg/ml for ZnO, nZnO-1, nZnO-2 and nZnO-3, respectively. The IC50 for the mammalian cells were 44.1 (12.1), 27.7 (9.8), 33.7 (9.7) and 17.4 (8.3) µg/ml for ZnO, nZnO-1, nZnO-2 and nZnO-3, respectively (). With respect to the signal dynamics of the LUCS assay, the increase in fluorescence induced by photo-bleaching of the sample was found to be lower in the PLHC-1 cells than in the Hep G2 cells. While in Hep G2 cells R2/R1 ratios of 1.7–2.0 were reached, ratios in the assays carried out with PLHC-1 cells were usually between 1.4 and 1.7. Taking into account that if the R2/R1 ratios range from 1.0 (maximal intoxication) to 2.0 (control), a deviation of 0.1 in the R2/R1 ratio corresponds to a change of 10% in the resulting cytotoxicity values, whereas in the R2/R1 ratios only range from 1.0 to 1.7, this deviation corresponds to a change of 14% in the resulting cytotoxicity values. The sensitivity of the different assays with respect to the LUCS was evaluated by calculating the IC50 ratios (). In the Hep G2 cell line, the LUCS assay was found to be more sensitive than the MTT and LDH assays to the effects of the three NPs. However, in the fish cell line it was less sensitive than the LDH assay. If considering the concentrations not producing any effect in the fish cell lines, NOECs were higher with the LUCS assay than with the MTT, NR and LDH assays (). However, the LUCS assay was found to be as sensitive as the MTT assay and together more sensitive than NR and LDH assays in the human cell line.
Figure 9. Effects of ZnO particles suspensions on PLHC-1 and Hep G2 cells after a 24 h exposure as determined with the new LUCS assay, measuring DNA alteration level. The data are presented as the mean ± SEM of at least three independent experiments. Significant differences with respect to the controls are indicated with asterisks (*p < 0.05 or **p < 0.01).
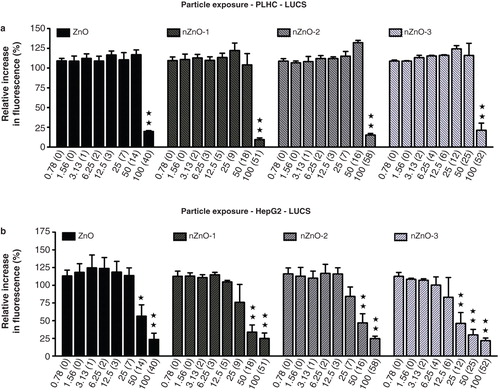
Table V. Sensitivity of the LUCS assay with respect to other cytotoxicity assays as calculated from the IC50 ratios.
ROS production
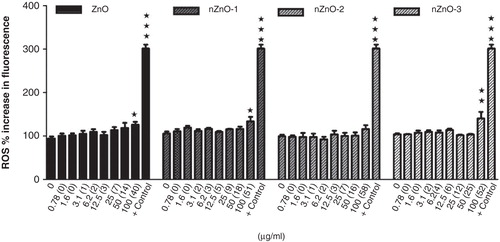
The NPs nZnO-1 and nZnO-3 and the bulk material increased the production of ROS at the highest concentration used, 100 µg/ml, in the PLHC-1 cell line (). However, these particles were not able to induce ROS production in the Hep G2 cell line (data not shown).
Figure 10. Effects of ZnO particles suspensions on ROS generation by PLHC-1 after a 24 h exposure period. The data are represented as the mean ± SEM of at least three independent experiments. Asterisks (*) represent significant differences (*p < 0.05;**p < 0.01) with respect to the controls. Chloramine-T (567.5 µg/ml) was used as positive control (+ control).
Discussion
One of the most critical steps in in vitro as well as in in vivo toxicity studies is the preparation of the NPs suspensions in the media or vehicles used. Previous studies described different methods to prepare NP suspension, either directly in the medium by simple agitation (Yang et al. Citation2009; Yuan et al. Citation2010), by using bath sonication (Huang et al. Citation2010; Pujalté et al. Citation2011; Song et al. Citation2010; Xiong et al. Citation2011) or by probe sonication (De Berardis et al. Citation2010; Hsiao & Huang Citation2011). Other authors used filtration (De Berardis et al. Citation2010) or stabilisers such as bovine serum albumin (Tantra et al. Citation2010; Yang et al. Citation2009) to eliminate possible aggregates. However, it was recently recommended to not discard these aggregates since their implication in the toxicity of ZnO NPs in embryo and adult zebrafish (Bai et al. Citation2010; Xiong et al. Citation2011) and human cells (Yuan et al. Citation2010) was demonstrated. Moreover, it has been described that ZnO NPs rapidly form very large aggregates in deionised water (2990, 6820 and 11,400 nm for concentrations of 1, 10 and 100 µg/ml) that are not easy to disperse after stirring, sonication, using pH variations or even following ultrasonic disruption (Tso et al. Citation2010). Degen and Kosec (Citation2000) found that ZnO suspensions could not be electrostatically stabilised because the colloidal ZnO particles were transformed into Zn ions. Because of these previously reported results, and to have a more realistic scenario of exposure conditions in an aquatic environment, in this work the cells were exposed to freshly prepared NPs suspensions dispersed by vortex for 1 min in culture medium without FBS.
To understand the mechanisms underlying the toxicity of NPs, it is essential to perform a thorough characterisation of their physico-chemical properties (Handy et al. Citation2008a). In this study, the size and shape of the pristine forms were observed by means of TEM. Since polyhedral, rod-like and near-spherical shapes were found to coexist in all tested particle forms, no definite conclusion could be made concerning the implication of the shape on toxicity. The average dimensions in length of the pristine NPs measured by TEM were 165, 51, 35 and 33 nm, for ZnO, nZnO-1, nZnO-2 and nZnO-3, respectively. Thus, the expected microsized particle was very close to the nanometre range and the NPs nZnO-2 and nZnO-3 presented similar average diameters. TEM images of ZnO particles suspended in medium showed aggregated particles with irregular shapes and corners less defined. Such changes in morphology have been explained by other authors as being attributed to the adsorbance of the ions present in the medium on the surface of ZnO particles (Fang et al. Citation2010; Yin Citation2010). Particle size was also studied by DLS in the medium suspensions freshly prepared and after 24 h incubation. Large sizes (>1 µm) could be measured by DLS at time 0 and 24 h. It was observed that the two smallest particles nZnO-2 and nZnO-3 tend to form the largest aggregates in suspension and have a wider size distribution profile (>2000 nm). The size of the aggregates of the bulk material was lower (859–1564 nm). Our results are in close agreement with those of Wong et al. (Citation2010) who found that ZnO NPs tended to form aggregates in the micrometre range (2.3 ± 1.6 µm) in seawater, and these aggregates were bigger than those formed by its bulk counterpart (1.7 ± 1.2 µm). By contrast, in the study of Hsiao and Huang (Citation2011) using ZnO NPs prepared by a precipitation or a solvothermal method, the smaller-sized ZnO particles aggregated to smaller secondary sizes than the larger NPs. These differences may be attributed to the regular shapes of the NPs used in this last study. Others authors also found that ZnO NPs formed large aggregates in algal media (Franklin et al. Citation2007) or in serum-free RPMI 1640 culture medium (Pujalté et al. Citation2011).
As ZnO particles are not soluble in aqueous solutions and form large aggregates on preparation, homogenous dispersions with reproducible concentrations are probably difficult to obtain. It is, therefore, essential to have an accurate estimation of the real concentrations used in the experiments. This has been achieved successfully in this work by means of ICP-MS. To our knowledge, this is the first time that this measurement has been carried out in cytotoxicity studies. From our findings the real concentrations for ZnO NPs were between 1.7 and 3.8 times lower than the nominal ones. Such findings must be kept in mind when interpreting toxicity results.
It has also been described that ZnO NPs can dissolve into Zn ions. The solubility of ZnO in aqueous media can show important variations ranging from 3.7 µg/ml in seawater (Wong et al. Citation2010) to 5.8–7.2 µg/ml in serum-free DMEM medium (Hsiao et al. Citation2011) and up to 15 µg/ml in complete DMEM medium (Xia et al. Citation2008). Since some Zn ions can be released into solution from the particles, a controversy surrounding the role played by these ions on toxicity remains. In the present study this was investigated. ZnO suspensions with the highest concentration used in the exposure experiments (100 µg/ml) were incubated for 24 h at the corresponding temperatures allowing the dissolution of Zn in media. Thereafter, suspensions were centrifuged at two different speeds and the concentration of Zn in the supernatants was measured by ICP-MS. Concentrations obtained in both supernatants were similar, indicating that the lowest speed was enough to remove any particle in suspension, and therefore this speed was selected for further experiments. After centrifugation, ZnO concentrations exhibited important differences depending on the medium used. Values measured were ∼6 µg/ml in EMEM and reached 40 µg/ml in α-MEM. This could be explained by a greater aggregation of the NPs at a higher temperature in the EMEM or by the presence of other medium substances that can stabilise the suspension in the α-MEM. In addition, the DLS measurements of the supernatants showed the presence of a NP population in the α-MEM medium (20–100 nm) that couldn't be clearly observed in the EMEM medium except for the ZnO-3 NP (50–200 nm). These NPs, together with the ions, could also be responsible for the toxicity caused by the supernatants. Other authors have also suggested that the toxicity observed in zebrafish (Bai et al. Citation2010; Xiong et al. Citation2011), Daphnia magna (Wiench et al. Citation2009), bacteria and branchipods (Heinlaan et al. Citation2008), microalgae (Aruoja et al. Citation2009) and in a human cell line (Yuan et al. Citation2010) could not only be attributed to the Zn ions but also to the presence of NPs in the exposure media.
In this work, different cytotoxicity assays have been performed to look into different end points. Results obtained with the MTT assay have shown that the PLHC-1 cell line was more sensitive than the Hep G2 cell line, but only with nZnO-1 and nZnO-2 freshly prepared suspensions. Nevertheless, for the highest concentrations used in the bulk material and in the NPs the effect observed in Hep G2 was significantly stronger than in PLHC-1. No differences in sensitivity between both cell lines could be observed with the NR or LDH assays. However, the LUCS assay indicated a higher sensitivity of the human cell line to ZnO particles than that of the fish one. Results also gave indications concerning the contribution of suspended and dissolved NPs and ions to the toxicity. Treatment of PLHC-1 with ZnO suspensions before and after centrifugation have shown, in the MTT, NR and LDH assays, that these cells were generally more sensitive to the particle suspensions than to the dissolved NPs and ions present in the supernatants. This result points to the involvement of aggregates in the toxicity of ZnO NPs to PLHC-1 cells. Bai et al. (Citation2010) attributed the toxicity in zebrafish embryos in part to the large nZnO aggregates that might block the pore canals of the chorion, resulting in hypoxia to the developing embryos. By contrast, the measured concentrations indicated that Hep G2 cells are more responsive to supernatants than suspended NPs. It could be easier for dissolved NPs or ions to enter the Hep G2 cells when aggregates are not present. In addition, cells treated with supernatants are exposed to the dissolved ions and colloidal NPs longer, than those treated with the suspensions. Song et al. (Citation2010), after exposing mouse macrophage cell lines to ZnO particle suspensions and to supernatants, concluded that the toxic effect at dosages under 10 µg/ml was mainly due to dissolved zinc ions whereas when the concentration of ZnO particles exceeded 40 µg/ml, the enhancement of cytotoxicity was mainly caused by ZnO particles. Similarly, De Berardis et al. (Citation2010) also found in human colon carcinoma cells that cytotoxicity induced by Zn ions was only slightly lower than that induced by ZnO NPs.
Differences in cytotoxicity between nominal and measured concentrations clearly indicate that the estimation of real concentrations is essential to avoid misinterpretations and erroneous conclusions.
One of the aims of this study was to test the applicability of the LUCS test in a fish cell line. Positive results were obtained in PLHC-1 cells, showing that ZnO particles are able to trigger DNA alteration in fish cells. Results obtained with LUCS in the Hep G2 cell line suggested that the three NPs are able to disrupt the DNA helicoidal conformation with a higher intensity than the bulk material. In the case of PLHC-1 cells, when all assays were compared, only LDH and LUCS allowed for IC50 evaluation with a better sensitivity seen using the LDH assay. However, in the case of Hep G2, IC50 were evaluated with MTT, LDH and LUCS assays with a better sensitivity of the latter assay as shown by ratio calculations. If we consider NOEC values, the MTT assay was the most sensitive for the fish cell line whereas the LUCS and MTT assays were most sensitive in the human cell line.
The NPs nZnO-1, nZnO-3 and the bulk material provoked a significant increase in ROS production in the PLHC-1 cell line. However, none of the particles were able to induce ROS production in the Hep G2 cell line in contrast with other studies in mouse or human cell lines where ZnO NPs were able to generate ROS at concentrations ranging from 5 to 100 µg/ml (Yang et al. Citation2009; Huang et al. Citation2010; Song et al. Citation2010). This difference could be explained by the low concentration of ZnO (6 µg/ml) detected in the EMEM supernatants that probably correspond to Zn ions that need to be present and the need of NPs and Zn ions to enter into the cell to generate ROS as previously suggested (Song et al. Citation2010; Yuan et al. Citation2010; Yang et al. Citation2009). Nevertheless, a main implication of zinc ions in the oxidative stress response has been discarded by these authors as well as by Gojova et al. (Citation2007) and Pujalté et al. (Citation2011). It has been reported that although ROS plays an important role in the toxicity of NPs, it is not necessarily the main factor of cytotoxicity of ZnO particles, but the cytotoxic response (Xia et al. Citation2008; Song et al. Citation2010; Wong et al. Citation2010). This might also be the case in this work. The observed cytotoxicity appeared not to be dependent on the induction of oxidative stress.
The relevance of these experimental data to ZnO NPs exposures in vivo remains to be elucidated. The acute toxicity of metal NPs is not always explained, or only partly explained, by the presence of free metal ions. The results of the present work indicate a different sensitivity of both cell lines to the aggregates versus the dissolved fraction. In fish, the dissolution of metal ions from the surface of the particle as well as the presence of dissolved ZnO NPs and large aggregates will determine and influence absorption (dietary versus respiratory or dermal exposure) as well as their presence in different organs. Some studies indicate that the most probable uptake mechanism of NPs is by endocytosis (Handy et al. Citation2008c; Shaw & Handy Citation2011). In this regard, fish may be more vulnerable than mammals, since fish guts are able to take up much larger materials by endocytosis across the gut (Handy et al. Citation2008c). Additionally, their presence in the surface of gills can produce pathologies and toxicity in the internal organs without their direct presence in those tissues (Shaw & Handy Citation2011). The body distribution, metabolism and excretion of metal NPs is poorly documented in fish, but hepatic excretion into the bile seems a more likely mechanism, rather than mainly by renal or branchial excretion (Handy et al. Citation2008c). Evidence suggests that metal NPs can be found in a range of organs including the gill, liver, intestine and brain (Handy et al. Citation2008a, Citationb) and all of them could be targets for NPs and explain or help to explain NP toxicity in vivo. Further studies on the possible absorption of the aggregates and the dissolved fraction in fish will allow a better understanding of the risk of these ZnO NPs to the aquatic environment.
Conclusions
In the present study, the toxic effects of ZnO NPs were not clearly related either with the size or the shape of the used NPs, this latter due to the heterogeneity of the commercial ZnO particles used. However, it is important to take into account that different sizes and shapes of ZnO NPs can coexist in the aquatic environment and contribute collectively to specific toxic effects. ZnO NPs formed large aggregates in culture medium that highly contribute to the toxicity observed in the fish cell line. The effects observed in the human cell line seem to be mainly due to the dissolved ZnO fraction. These results support the idea that, in order to have realistic conditions which consider all possible mechanisms of action, experiments involving exposure to ZnO NPs in aqueous suspensions should be performed without homogeneous dispersion of the NPs. It has been also shown that it is essential to measure real concentrations to avoid making erroneous conclusions when only nominal concentrations are considered.
A battery of end points should be measured to study the cytotoxicity of NPs. In this work, we have introduced the LUCS test, a test to measure toxicity based on DNA alteration. It provides us with extra information regarding cellular events. From the classical cytotoxicity assays used, the MTT gave the highest sensitivity in both cell lines. However, the newly developed LUCS assay appeared to be even more sensitive in the Hep G2 cell line. From both cell lines, the human one appeared to be more sensitive than the piscine one. Of particular interest is the fact that the LUCS has been shown to be applicable to other cell lines than the mammalian ones in which it was originally established. The results from this study also indicated that ROS production is not the main factor causing cytotoxicity of ZnO particles, but cellular damage at the mitochondrial and DNA levels.
Further studies in fish in vivo to address the consequences of environmental exposures to these NPs are needed.
Declaration of interest
The authors report no conflicts of interest. The authors alone are responsible for the content and writing of the paper.
Acknowledgements
This work was supported by the Spanish Ministerio de Medio Ambiente y Medio Rural y Marino (grant number AEG07-060). T Lammel was funded by FP7-PEOPLE-ITN 2008 ECO (Environmental ChemOinformatics) (Project ref. 238701).
References
- Adams LK, Lyon DY, Alvarez PJJ. 2006. Comparative eco-toxicity of nanoscale TiO2, SiO2, and ZnO water suspensions. Water Res 40:3527–3532.
- Aruoja V, Dubourguier H, Kasemets K, Kahru A. 2009. Toxicity of nanoparticles of CuO, ZnO and TiO2 to microalgae Pseudokirchneriella subcapitata. Sci Total Environ 407:1461–1468.
- Bai W, Zhang ZY, Tian WJ, He X, Ma YH, Zhao YL, 2010. Toxicity of zinc oxide nanoparticles to zebrafish embryo: a physicochemical study of toxicity mechanism. J Nanopart Res 12:1645–1654.
- Borenfreund E, Puerner JA. 1985. Toxicity determined in vitro by morphological alterations and neutral red absorption. Toxicol Lett 24:119–124.
- De Berardis B, Civitelli G, Condello M, Lista P, Pozzi R, Arancia G, 2010. Exposure to ZnO nanoparticles induces oxidative stress and cytotoxicity in human colon carcinoma cells. Toxicol Appl Pharmacol 246:116–127.
- Degen A, Kosec M. 2000. Effect of pH and impurities on the surface charge of zinc oxide in aqueous solution. J Eur Ceram Soc 20:667–673.
- Deng XY, Luan QX, Chen WT, Wang YL, Jiao Z. 2009. Nanosized zinc oxide particles induce neural stem cell apoptosis. Nanotechnology 20:115101.
- Derick S, Tocanne JF, Morin B, Narbonne JF, Furger C. 2009. DAP, a new fluorescent cell-based assay which predicts human acute toxicity to 82% [Abstract 501]. In 7th World Congress on Alternatives to Animal Experimentation, vol. 26, 130 Rome (Italy); 30 August-3 September, 2009.
- Dhawan A, Sharma V. 2010. Toxicity assessment of nanomaterials: methods and challenges. Anal Bioanal Chem 398:589–605.
- Fang X, Yu R, Li B, Somasundaran P, Chandran K. 2010. Stresses exerted by ZnO, Ce O(2) and anatase TiO(2) nanoparticles on the Nitrosomas europaea. J Colloid Interface Sci 348:329–334.
- Franklin NM, Rogers NJ, Apte SC, Batley GE, Gadd GE, Casey PS. 2007. Comparative toxicity of nanoparticulate ZnO, bulk ZnO, and ZnCl2 to a freshwater microalga (Pseudokirchneriella subcapitata): the importance of particle solubility. Environ Sci Technol 41:8484–8490.
- Gojova A, Guo B, Kota RS, Rutledge JC, Kennedy IM, Barakat AL. 2007. Induction of inflammation in vascular endothelial cells by metal oxide nanoparticles: effect of particle composition. Environ Health Perspect 115:403–409.
- Handy RD, Owen R, Valsami-Jones E. 2008a. The ecotoxicology of nanoparticles and nanomaterials: current status, knowledge gaps, challenges, and future needs. Ecotoxicology 17:315–325.
- Handy RD, Kammer FVD, Lead JR, Hassellöv M, Owen R, Crane M. 2008b. The ecotoxicology and chemistry of manufactured nanoparticles. Ecotoxicology 17:287–314.
- Handy RD, Henry TB, Scown TM, Johnston BD, Tyler CR. 2008c. Manufactured nanoparticles: their uptake and effects on fish-a mechanistic analysis. Ecotoxicology 17:396–409.
- Heinlaan M, Ivask A, Blinova I, Dubourguier HC, Kahru A. 2008. Toxicity of nanosized and bulk ZnO, CuO and TiO2 to bacteria Vibrio fischeri and crustaceans Daphnia magna and Thammnocephalus platyurus. Chemosphere 71:1308–1316.
- Hsiao IL, Huang YJ. 2011. Effects of various physicochemical characteristics on the toxicities of ZnO and TiO2 nanoparticles toward human lung epithelial cells. Sci Total Environ 409:1219–1228.
- Huang CC, Aronstam RS, Chen D, Huang Y. 2010. Oxidative stress, calcium homeostasis, and altered gene expression in human lung epithelial cells exposed to ZnO nanoparticles. Toxicol In Vitro 24:45–55.
- Kashiwada S. 2006. Distribution of nanoparticles in the see-through Medaka (Oryzias latipes). Environ Health Perspect 114:1697–1702.
- Lin WS, Xu Y, Huang CC, Ma YF, Shannon KB, Chen DR, 2009. Toxicity of nano- and micro-sized ZnO particles in human lung epithelial cells. J Nanopart Res 11:25–39.
- Liu J, Zhang W, Jing H, Popovich DG. 2010. Bog Bilberry (Vaccinium uliginosum L.) extract reduces cultured Hep-G2, Caco-2, and 3T3-L1 cell viability, affects cell cycle progression, and has variable effects on membrane permeability. J Food Sci 75:103–107.
- Mosmann T. 1983. Rapid colorimetric assay for cellular growth and survival: application to proliferation and cytotoxicity assays. J Immunol Methods 65:55–63.
- Pujalté I, Passagne I, Brouillaud B, Tréguer M, Durand E, Ohayon-Courtès C. 2011. Cytotoxicity and oxidative stress induced by different metallic nanoparticles on human kidney cells. Part Fibre Toxicol 8:1–16.
- Scown TM, Goodhead RM, Johnston BD, Moger J, Baalousha M, Lead JR, 2010. Assessment of cultured fish hepatocytes for studying cellular uptake and (eco)toxicity of nanoparticles. Environ Chem 7:36–49.
- Sharma V, Shukla RK, Saxena N, Paramar D, Das M, Dhawan A. 2009. DNA damaging potential of zinc oxide nanoparticles in human epidermal cells. Toxicol Lett 185:211–218.
- Shaw BJ, Handy RD. 2011. Physiological effects of nanoparticles on fish: a comparison of nanometals versus metal ions. Environ Int 37:1083–1097.
- Song W, Zhang J, Guo J, Zhang J, Ding F, Li L, 2010. Role of the dissolved zinc ion and reactive oxygen species in cytotoxicity of ZnO nanoparticles. Toxicol Lett 199:389–397.
- Tantra R, Tompkins J, Quincey P. 2010. Characterisation of the de-agglomeration effects of bovine serum albumin on nanoparticles in aqueous suspension. Colloids Surf B 75:275–281.
- Tso CP, Zhung CM, Shih YH, Tseng YM, Wu SC, Doong RA. 2010. Stability of metal oxide nanoparticles in aqueous solutions. Water Sci Technol 61:127–133.
- Wang H, Joseph JA. 1999. Quantifying cellular oxidative stress by dichlorofluorescein assay using microplate reader. Free Radic Biol Med 27:612–616.
- Wiench K, Wohlleben W, Hisgen V, Radke K, Salinas E, Zok S, 2009. Acute and chronic effects of nano- and non-nano-scale TiO2 and ZnO particles on mobility and reproduction of the freshwater invertebrate Daphnia magna. Chemosphere 76:1356–1365.
- Wong SWY, Leung PTY, Djurisic AB, Leung KMY. 2010. Toxicities of nano zinc oxide to five marine organisms: influences of aggregate size and ion solubility. Anal Bioanal Chem 396:609–618.
- Xia T, Kovochich M, Liong M, Madler L, Gilbert B, Shi H, 2008. Comparison of the mechanism of toxicity of zinc oxide and cerium oxide nanoparticles based on dissolution and oxidative stress properties. ACS NANO 2:2121–2134.
- Xiong D, Fang T, Yu L, Sima X, Zhu W. 2011. Effects of nano-scale TiO2, ZnO and their bulk counterparts on zebrafish: Acute toxicity, oxidative stress and oxidative damage. Sci Total Environ 409:1444–1452.
- Yang H, Liu C, Yang D, Zhang H, Xi Z. 2009. Comparative study of cytotoxicity, oxidative stress and genotoxicity induced by four typical nanomaterials: the role of particle size, shape and composition. J Appl Toxicol 29:69–78.
- Yin H, Casey PS, McCall MJ, Fenech M. 2010. Effects of surface chemistry on cytotoxicity, genotoxicity, and the generation of reactive oxygen species induced by ZnO nanoparticles. Langmuir 26:15399–15408.
- Yuan JH, Chen Y, Zha HX, Song LJ, Li CY, Li JQ, 2010. Determination, characterization and cytotoxicity on HELF cells of ZnO nanoparticles. Colloids Surf B 76:145–150.
- Zhu XS, Zhu L, Duan ZH, Qi RQ, Li Y, Lang YP. 2008. Comparative toxicity of several metal oxide nanoparticle aqueous suspensions to Zebrafish (Danio rerio) early developmental stage. J Environ Sci Health A 43:278–284.
- Zhu X, Wang J, Zhang X, Chang Y, Chen Y. 2009. The impact of ZnO nanoparticle aggregates on the embryonic development of zebrafish (Danio rerio). Nanotechnology 20:195103.