
Abstract
Metal-containing nanomaterials have the potential to be used in dentistry for infection control, but little is known about their antibacterial properties. This study investigated the toxicity of silver (Ag), titanium dioxide and silica nanoparticles (NPs) against the oral pathogenic species of Streptococcus mutans, compared to the routine disinfectant, chlorhexidine. The bacteria were assessed using the minimum inhibitory concentration assay for growth, fluorescent staining for live/dead cells, and measurements of lactate. All the assays showed that Ag NPs had the strongest antibacterial activity of the NPs tested, with bacterial growth also being 25-fold lower than that in chlorhexidine. The survival rate of bacteria under the effect of 100 mg l−1 Ag NPs in the media was 2% compared to 60% with chlorhexidine, while the lactate concentration was 0.6 and 4.0 mM, respectively. Silica and titanium dioxide NPs had limited effects. Dialysis experiments showed negligible silver dissolution. Overall, Ag NPs were the best disinfectant and performed better than chlorhexidine. Improvements to the MIC assay are suggested.
Introduction
The antibacterial properties of metals such as silver, zinc and copper have been known for centuries and this has been exploited in modern medicine for infection control (Weber & Rutala Citation2001). In dental surgery, for example, silver nitrate was one of the first substances suggested for the management of dental caries (Hill & Arnold Citation1937). However, new nanoscale forms of metals are being produced (“nanometals”, Shaw & Handy Citation2011). These metal-containing nanomaterials arise in several chemical forms, including solid nanoparticles (NPs) of metal or metal oxides (e.g., Ag NPs, TiO2 NPs), as well as composite materials with layers of different metals (e.g., Cd-Se quantum dots, Han et al. Citation2010). The potential of engineered nanomaterials (ENMs) as antibacterial agents has been recognised (Li et al. Citation2008), and there is now interest in using ENMs for infection control in dentistry and the management of the oral biofilm (Allaker Citation2010).
The precise mechanism(s) for bacterial toxicity of nanometals is still being elucidated, but the possibilities include free metal ion toxicity arising from the dissolution of metals from the surface of the NPs (e.g., Ag+ from Ag NPs, Kim et al. Citation2007) or oxidative stress via the generation of reactive oxygen species (ROS) on crystal surfaces of some NPs. The latter may be particularly important for anatase forms of TiO2, where the TiO2 surface reacts by photocatalysis with water to release the hydroxyl radical with subsequent formation of superoxide (Linsebigler et al. Citation1995). The ROS can then synergistically act by attacking polyunsaturated phospholipids in bacteria (Wong et al. Citation2006) and cause site-specific DNA damage (Hirakawa et al. Citation2004). Silica NPs have been found to inhibit bacteria adherence to oral biofilms (Cousins et al. Citation2007). Although not strictly having a toxic mechanism, the silica induces an unfavourable change in the biofilm to reduce the adhesion, and therefore proliferation of bacteria.
However, it remains unclear whether nanometals have superior antibacterial properties compared to the traditional metal salts used in dentistry, or to other routine antibacterial products for the oral cavity such as the chlorhexidine used in surgical mouthwashes. Much of the microbial research with ENMs has also been conducted with well-known model organisms, such as Escherichia coli (e.g., as a model for Gram-negative bacteria, Sondi & Salopek-Sondi Citation2004), but less work has been done on the important microbes of the oral cavity. The oral cavity is a dynamic environment where over 500 different bacterial species have been identified, with Streptococcus mutans to be among the most frequently isolated species (Bratthall Citation1972). Oral streptococci, including S. mutans, are the primary plaque-formers (Nyvad & Kilian Citation1990) and as such they are involved in plaque formation and initiation of dental caries (Balakrishnan et al. Citation2000). Compared to other streptococci, S. mutans is a highly cariogenic pathogen mainly due to the fact it is highly acidogenic and can ferment carbohydrates to lactic acid, formate, ethanol and acetate (Shaw Citation1987). This microbe is therefore of considerable clinical importance in dentistry, but compared to other species of microbes, there are relatively few reports on the effects of metal-containing NPs on this organism (e.g., Espinosa-Cristóbal et al. Citation2009).
The primary aim of this study was to assess the antibacterial activity of several metal-containing NPs against S. mutans compared to the equivalent metal salts or bulk powders, and to the widely used clinical disinfectant, chlorhexidine. The NPs were chosen for their different physico-chemical properties and therefore likely modes of action, including Ag NPs as an example of material that may release ions by dissolution, TiO2 NPs as a stable metal oxide that may generate ROS and two different types of silica particles (uncoated and with a coat of alumina, Al2O3). In addition, there are concerns that many of the standardised toxicity protocols for microbes and other organisms that are used in the safety assessment of new substances, including medicines, may require validation for their use with ENMs (review, Handy et al. Citation2012). A secondary aim of this study was to contribute to the ongoing test methods debate by evaluating the routine bacterial growth inhibition assay (minimum inhibitory concentration assay or MIC, Ramalingam et al. Citation2011) which relies on optical absorbance of the liquid media to measure changes in bacterial growth, compared to other approaches that could be used as toxicity end points such as fluorescence measurements (Live/Dead staining kits), and lactate production.
Methods
Experimental design and preparation of microplates
The experimental design involved exposing S. mutans in 96-well microplates for 24 h to a dilution series of a suite of ENMs compared to their equivalent bulk powders or metal salts (see below), and chlorhexidine as a positive control. After a 24 h exposure, growth inhibition, the proportion of live/dead cells, and lactate production were assessed along with measurements of metal concentrations and dissolution rates of dissolved Ag to aid interpretation of the data (see below). Cultures of S. mutans (NCIMB 702062) were grown in Brain Heart Infusion (BHI, product code: OXCM1135B, Fisher Scientific, Loughborough, UK) broth supplemented with 2% sucrose, referred to hereafter as “BHI”. The experimental exposures were conducted in 96-well microplates (flat-bottom sterile polystyrene microplates, FB56416, Fisherbrand, UK), with each well inoculated with 25 μl of bacterial suspension (107 CFU/ml−1) as appropriate, and with all the test materials and controls included on each microplate such that the microplate was the unit of replication in the experimental design (n = 6 plates/treatment).
The controls on each plate included a column of wells with the test organism plus sterile saline only (no added particle control), a 50% dilution series (down to 1/32 of the initial concentration) of 0.5% (v/v) chlorhexidine digluconate (positive control of the routine clinical antiseptic product R4, Septodont Ltd, UK), as well as similar dilutions of the nanomaterial being tested and its equivalent metal salt or bulk material control (see for stock dispersion). The initial 1 g l−1 stock solutions and dispersions were prepared in deionised ultrapure sterile water (see below), and in order to prevent osmotic stress of the test organism, the first row in each plate were dosed with 25 μl of a stock into 225 μl sterile saline (i.e., an initial 1:10 dilution of the appropriate stock in sterile saline). The sterile saline was 0.94% w/v NaCl made in ultrapure water, diluted with the test substances to 0.85% NaCl. This ensured a working concentration of 100 mg l−1 for the ENMs, metal salts or bulk materials in the first row of wells (and 0.5% v/v chlorhexidine in the positive control), which were then subject to 50% serial dilutions down the microplate (i.e., 100, 50, 25, 12.5, 6.25, 3.125 mg l−1 for the test materials). Additional optical controls on the plate included the saline without the inoculum to check for the absorbance of the saline, and a dilution series of the broth alone in ultrapure water to check for turbidity from the broth.
Table I. Characterisation of nanomaterial dispersions in Milli-Q and saline–BHI solutions with a nominal concentration of 100 mg l− 1.
An additional set of turbidity control experiments (in triplicate) were done separately to check for the turbidity due to the ENMs. These reference plates were identical to those in the main experiment, except that the broth added to the plates contained no bacteria (i.e., no bacterial growth, but time-matched turbidity measurements for the ENMs). All microplates were then incubated in the dark for 24 h at 37°C under 5% CO2 in atmospheric air to allow bacterial growth, and at the end of the exposure microplates were assessed for the MIC, the proportion of live and dead cells, and lactate production (see below).
Preparation of the stock solutions/dispersions, and nanomaterial characterisation
Details of the test materials are given (). Stock dispersions of 1 g l−1 were initially prepared in sterile Milli-Q water for TiO2 (nano and a bulk control), Ag NPs compared to AgNO3, and two forms of nanoparticulate silica (SiO2) purchased as solutions (electropositive Ludox® CL and the electronegative Ludox® HS-30). In Ludox® CL, the particles are coated by a layer of alumina (Al2O3) that converts their net charge from negative to positive. Silica microparticles (MPs) served as the bulk material control for the HS-30 silica NPs. An AlCl3 solution served as the control for the CL silica solution and was prepared so that it matched the measured concentration of Al (18.08 ± 0.1 g l−1 of Al, mean and SD, n = 3) in CL silica (equivalent to 1.8% w/v). Where materials were supplied as dry powders, Brunauer–Emmett–Teller (BET) gas adsorption was used to determine the specific surface area of the materials (see ). This used 0.5–1 g of materials, carefully weighted and placed in a BET-nitrogen adsorption analyser (Gemini 2360 surface area analyser, Micromeritics Instrument Co., USA) and analysed according to the instrument manufacturer's instructions. The starting materials were also checked for organic impurities by using an EA 1110 carbon/hydrogen/nitrogen (CHN) analyser (CE instruments, Milan, Italy). Samples (2.0–2.5 mg) were analysed in triplicate according to the manufacturer's protocol against cyclohexanone 2,4-dinitrophenylhydrazone standards, and expressed as weight percentages. In all materials, the carbon, hydrogen and nitrogen contents were all below detection limit (<0.3% by weight); except for the expected nitrogen content of AgNO3, some 4.4% hydrogen in the AlCl3 (the material is hydroscopic and some water vapour adsorption is unavoidable) and a trace amount of carbon in the Ag NPs (1.3%, but in the absence of H or N, indicating this was not due to organic molecules).
The initial g l−1 stocks of TiO2 (NPs and bulk) and Ag NPs were sonicated (35 kHz frequency, Fisherbrand FB 11010, Germany) for 4 h to disperse the materials (based on our previous experience of dispersing metal NPs, e.g., Federici et al. Citation2007). Also, a stock solution of 5% chlorhexidine digluconate was made as a positive control and a sterile saline solution (0.85% w/v NaCl in Milli-Q water) as a negative saline control. All stock dispersions and control solutions were made using sterile Milli-Q ultrapure water. In preliminary experiments, the test materials (not usually sterilised by the manufacturer) were identified as a possible source of bacterial contamination and therefore had to be sterilised. All the stock dispersions and control solutions were autoclaved (121°C for 15 min at 15 psi pressure) to ensure the absence of bacteria, except the TiO2. Titania is well known for its reactivity at increased temperatures and pressures, and to avoid concerns that the autoclave might alter the crystal structure of the titania, the TiO2 NPs and TiO2 bulk powders were sterilised with gamma radiation (36.42–40.72 KGy, 10 h) instead.
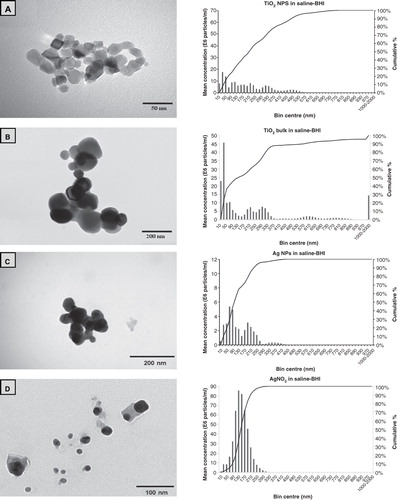
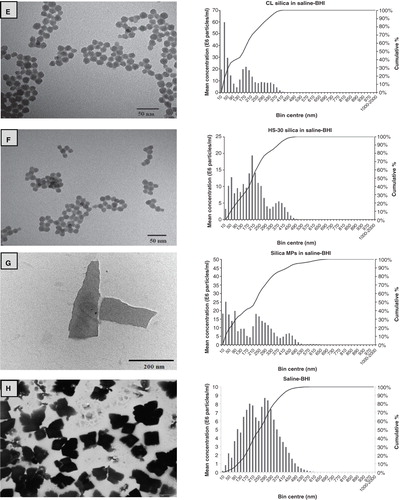
Our approach to characterise the test materials was to analyse them at a concentration of 100 mg l−1 in a saline solution (the 1 g l−1 stock dispersion diluted 1:10 with the saline above at neutral pH) so that this was directly relevant to the ionic strength of the microplates and the highest exposure concentration used in the experiments. The 100 mg l−1 Ag NPs, TiO2 NPs and TiO2 bulk saline dispersions were sonicated for 1 h prior to characterisation to ensure dispersion of the particles. The particle size was determined by two independent methods. First, sub-samples were examined using transmission electron microscopy (TEM, JEOL-1200EX II), and examples of the materials are shown in , and measurements of the primary particle size are reported in . The primary particle diameter was measured on numerous images from multiple TEM grids (at least triplicate sub-samples of the stock dispersions), and counted manually using the cursor function in ImageJ 1.44p software (Rasband W, National Institute of Health, Bethesda, MD, USA) on at least 100 particles. The second approach for particle sizing was NP tracking analysis (NTA, using a Nanosight LM 10, Nanosight, Salisbury, UK, laser output set at 30 mW at 640 nm). This technique uses laser light scattering to visualise individual particles and tracks their Brownian motion. The instrument software uses the rates of diffusion to calculate the hydrodynamic radius of the particles using the Stokes–Einstein equation (review, Filipe et al. Citation2010) and has been used previously by our laboratory many times to characterise particle dispersions (e.g., for TiO2 and Ag NPs, Windeatt & Handy Citation2012). The average particle size of the dispersions measured by NTA and reported as hydrodynamic diameter are given in , with example distributions shown (). Measurements were made on at least 4–6 sub-samples of each 100 mg l−1 stock dispersion using sample volumes of 400 µl. In addition, to enable some understanding of the behaviour of the materials in the presence of bacterial broth, measurements were also repeated in saline-BHI broth solutions (at the concentrations used in the microplates), and in sterile Milli-Q water. Total metal concentrations were measured according to Federici et al. (Citation2007) in the working stock solutions and dispersions by inductively coupled plasma optical emission spectrometry (ICP-OES, Varian 725-ES, Melbourne, Australia fitted with v-groove nebuliser and Sturman–Masters spray chamber). The method used acidified matrix matched standards to verify the concentration of Si, Ti and Ag in the 100 mg l−1 test solutions/dispersions. Values are reported as mg l−1 of total metal.
Figure 1. Example transmission electron microscopy images of ENMs and their salt metal or bulk controls in 100 mg l−1 Milli-Q water solutions showing (A) TiO2 NPs, (B) bulk TiO2, (C) Ag NPs, (D) AgNO3, (E) CL silica NPs, (F) HS-30 silica NPs and (G) silica MPs. Image H shows the saline–BHI + 2% sucrose media where the presence of the NaCl crystals is apparent. The respective nanosight graphs show the particle distribution (bin sizes are hydrodynamic diameter) of the nanomaterials and their salt metal or bulk controls in 100 mg l−1 saline-BHI + 2% sucrose solutions.
MIC assay
This assay is routinely used by microbiologists to measure the reduction of growth of the microbes, usually over a fixed incubation period of about 24 h. The method is based on the US National Committee for Clinical Laboratory Standards guidelines, with modifications incorporated for nanomaterials and S. mutans by Ramalingam et al. (Citation2011). The aim of the test is to work out the minimum dilution of the test substance that gives complete inhibition of growth (undetectable growth in the media), and bacterial growth is measured by a change in the optical density (turbidity) of the wells in the microplate. Preliminary experiments were conducted to optimise sample volumes, incubation times and the wavelength for measuring the materials (data not shown). In the final protocol, the inoculated microplates were incubated for 24 h at 37°C under 5% CO2 in atmospheric air, and then the turbidity values were read at 595 nm (VersaMax microplate reader with SoftMax Pro 4.0 software, Molecular Devices, Sunnyvale, CA, USA). The reference microplates were also read at 595 nm in order to determine the fraction of turbidity caused due to the presence of NPs in the solutions, with reading at time zero (immediately after plate preparation) and again after 24 h to determine any time-dependent changes in the background absorbance due to the materials (i.e., settling of the material).
Live and dead staining
The viability of S. mutans after a 24 h exposure to the test solutions was assessed using the L7012 Live/Dead® Backlight™ Kit (Invitrogen Ltd, Paisley, UK), according to the manufacturer's protocol, but with optimised emission wavelengths. This kit contains SYTO 9, a green fluorescent DNA stain for all kinds of cells, and a red fluorescent DNA stain (propidium iodide) for cells with a compromised membrane. Following the 24 h incubation of the inoculated plates (above), 100 μl of media from each well were transferred to a new plate and were mixed thoroughly with an equal volume of a staining solution. The staining solution was prepared by mixing the two stains provided with the kit at a 1:1 ratio and then adding Milli-Q ultrapure water to a final stain concentration of 0.6%. The bacterial cell suspension mixtures were then incubated at room temperature in the dark for 15 min. The samples were examined immediately using a Cytofluor II, fluorescence plate reader (Perspectives Biosystems, Framingham, MA, USA). The emission wavelengths were set at 530 nm for SYTO 9 and 645 nm for propidium iodide, whereas the excitation wavelength was 480 nm for both dyes. The kit had been previously calibrated so as the experimental fluorescence data obtained corresponded to certain live cells percentage values. For this purpose, the manufacturer's recommended protocol was modified accordingly to match our experimental design (e.g., starting concentration of the S. mutans culture was adjusted to 107 CFU/ml−1, resuspension of the bacterial pellet and washing was performed in saline–BHI broth instead saline). Calibration used 100% live (no treatment) and 100% dead (in 70% isopropyl alcohol for 1 h at room temperature) cells. The calibration curve was designed by plotting the ratio of integrated green/red fluorescence (at the same wavelengths as above) against the known percentage of live cells of the standard cell suspensions (0–100% live cell suspensions with 10% increment steps in between). Samples spiked with ENMs were used to check for interference with the calibration (none observed, and no quenching of either dye), and typical calibrations gave a linear response (e.g., r² = 0.9976; y = 0.0594x + 1.5038).
Determination of the lactate production
Streptococcus mutans is an anaerobic species which ferments the sucrose and other sugars in the broth to lactic acid. The appearance of lactate in the external medium is therefore an indication of metabolically active, viable cells. After exposure of the inoculated microplates to the test materials for 24 h (above), 70 μl of the remaining volume from each well were transferred to new V-bottom 96-well microplates (product number: 3896, Corning, UK) which were then centrifuged (2,000 rpm for 10 min with a 2040 Rotors microplate centrifuge, Centurion Scientific Ltd, Ford, UK) to pellet the NPs and bacteria. Then, 10 μl of the supernatant from each of the wells were removed to new flat bottom 96-well plates for the lactate assay according to Gutmann & Wahlefeld (Citation1974). Briefly, each 10 μl sample of the supernatant was mixed with 211 μl of a lactate assay reagent consisting of 200 μl of 0.4 M hydrazine and 0.5 M glycine solution (buffered to pH 9 with KOH), 10 μl of 40 mM nicotinamide adenine dinucleotide (NAD+, Melford Laboratories Ltd, Suffolk, UK) and 1 μl of 1000 units/ml lactate dehydrogenase (LDH, Sigma-Aldrich Ltd, Dorset, UK). Samples were then incubated for 2 h at 37°C, and absorbance read at 340 nm (microplate reader as above). The lactate production of S. mutans was calculated using a calibration curve of lactic acid standards in triplicates (0, 0.125, 0.25, 0.5, 1.0, 2.0, 4.0 and 8 mM).
Dialysis experiment
Ag NPs may release Ag+ ions by dissolution into water, and in order to enable interpretation of the Ag NPs response in this study, a dialysis experiment was done to measure the dissolution rate of the Ag NPs in the saline–BHI media used here for the ENM exposures, and in the saline only (0.85% w/v NaCl), as well as in Milli-Q water only. The dialysis method was based on Handy et al. (Citation1989) with modifications for ENMs. Briefly, 100 mg l−1 of metal as Ag NPs or AgNO3 solutions in saline–BHI, identical to those used for the exposure experiments were prepared as above. Ag NPs and AgNO3 solutions at the same concentration were also prepared in saline only and Milli-Q water. A saline–BHI solution (no Ag NPs or AgNO3 added) was assigned as the control. All glassware and dialysis tubing had been acid washed (5% nitric acid) and triple rinsed in deionised (Milli-Q) water. Dialysis tubing (product code: D9777, cellulose membrane with molecular weight cut off at 12,000 Da, Sigma-Aldrich Ltd, Dorset, UK) with an approximate exclusion size of 2.5 nm was used to make 70 mm long × 25 mm wide dialysis bags which were filled with 8 ml of the appropriate Ag NP or AgNO3 solution. The ends of the tubings were secured with mediclips to prevent leaking. The filled dialysis bags were then placed immediately in a beaker containing 492 ml of the appropriate media (bringing the total volume to 500 ml). Care was taken to use beakers of identical shape/size for the experiments, and each experiment was performed in triplicate (three separate beakers) for each material and external medium (saline–BHI, saline only, Milli-Q water or saline–BHI control). The solutions in the beakers were gently agitated with a multipoint magnetic stirrer (RO 15P power, Ika-Werke GmbH & Co. KG, Staufen, Germany) for 24 h at room temperature. Samples of the external media (4.5 ml) were taken from each beaker at 0, 30 min, 1 h, 2, 3, 4, 6, 8 and 24 h. Controls also included dialysis blanks (empty dialysis bags, the external media only to check for ion leakage from the glassware; (Na+, K+, H+ leak, see Handy et al. Citation1989, not observed). At the end of experiment, the remaining contents of the dialysis bags were also collected. Samples were analysed by ICP-OES for total Ag concentration as above. The pH of the samples and the temperature of the media in the beakers were also measured during the experiments.
Statistics
All data are presented as mean ± standard deviation and were analysed using version 18.0 of SPSS software for Windows. The differences between the treated samples and the negative or positive controls (treatment effect), as well as the differences within each group (dilution effect), were evaluated using one-way analysis of variance (AVONA, Tukey post hoc test). Saline–BHI media containing NPs were tested against their salt metal or bulk controls using two-way ANOVA, with Tukey's post hoc test. All statistical analysis used a 95% confidence limit, so that p values ≥ 0.05 were not considered statistically significant. Dissolution curves were fitted using SigmaPlot 12.0 (Systat Software, Inc.) applying the legal binding one site saturation equation on the raw data points.
Results
Minimum inhibitory concentration
The turbidity of the inoculated test and control saline–BHI media was measured at the end of the incubation period (). The measured absorbance values were due to the combined turbidity effect of bacterial growth and the intrinsic turbidity of the NPs in the media. The high turbidity observed for the first three dilutions of the TiO2 NPs and TiO2 bulk in the saline–BHI media was due to the high concentration of suspended particles. This is illustrated in . Absorbance values above line A, but below line B were expected to be due to bacterial growth; whereas values higher than line B were due to the added effect of the MPs or NPs in the media. In order to correct the turbidity of the test material and identify the exact fraction of the turbidity caused exclusively by bacterial growth, the absorbance values measured for the reference (non-inoculated) microplates containing the test materials were deducted from the values of the experimental inoculated plates (). The turbidity values of the reference microplates did not change over 24 h (data not shown), verifying that the incubation had no effect on the non-inoculated reference plates.
Figure 2. The effect of nanomaterials on bacterial growth in the MIC test, measured as absorbance values recorded after a 24 h exposure of the S. mutans to the test media compared to appropriate controls. Dilutions series of 1, 1/2, 1/4, 1/8, 1/16 and 1/32 correspond to 100, 50, 25, 12.5, 6.25 and 3.125 mg l−1, respectively of each material used. (A) Total absorbance values caused by bacterial growth as well as the natural turbidity of the solutions. Line A corresponds to the absorbance for the inoculated saline control before incubation representing the absorbance levels for complete inhibition of bacterial growth and line B corresponds to the absorbance for the inoculated saline after 24 h of incubation expressing no antibacterial activity. (B) Absorbance values related exclusively to the bacterial growth, after correction for the natural turbidity of the solutions; “*” shows significant difference from the saline negative control and “+” shows statistical difference from the corresponding dilution of the chlorhexidine positive control (one-way ANOVA, p < 0.05). Within a test solution, different letters indicate significant differences (one-way ANOVA, p < 0.05) between the dilution series, whereas complete absence of letters means no statistical difference between any of the dilutions; “#” shows that the nanosolutions were significantly different (two-way ANOVA, p < 0.05) from their corresponding salt metal or bulk control, whereas “NS” means no significant difference. Brackets show the groups compared.
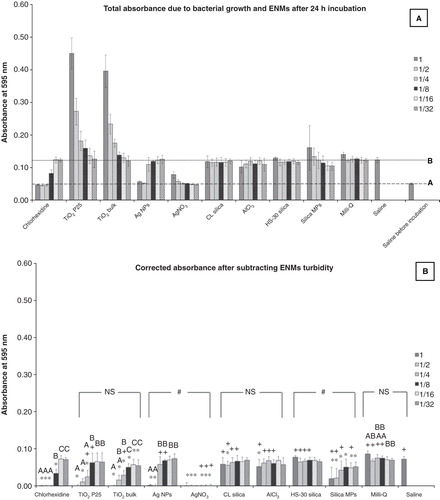
When the data were corrected for particle turbidity (), AgNO3 was found to be the most effective against S. mutans by inhibiting bacterial growth for all dilutions tested (up to 3.125 mg l-1) followed by Ag NPs and chlorhexidine with MICs of 50 mg l−1 and 0.125% (v/v) (≈1250 mg l-1), respectively. The 100 mg l−1 TiO2 NPs and TiO2 bulk in the saline–BHI media also showed a complete bacterial growth inhibition. For the other materials tested, bacterial growth inhibition was not achieved (). Statistical analysis confirmed the antibacterial effectiveness of Ag NPs (up to 50 mg l−1) and AgNO3, as absorbance values for those were significantly lower compared to the saline negative control (one-way ANOVA, p < 0.05), while not statistically different from the respective dilutions of chlorhexidine, for which no bacterial growth was also observed (one-way ANOVA, p > 0.05). The AgNO3 solution was significantly more antibacterial compared to Ag NPs (two-way ANOVA, p < 0.05).
Live and dead staining
The viability of S. mutans was assessed using the Live/Dead® Backlight™ Kit, after a 24 h exposure to ENMs (). Checks on the dye calibrations showed no fluorescence quenching due to the presence of any of the test materials. Thus, changes in fluorescence were exclusively due to variances in cell viability. Overall, the data confirmed a high survival rate for bacteria in the saline negative control, while 0.25% v/v chlorhexidine was the threshold for 100% mortality. Among all the ENMs tested, only Ag NPs showed a clear concentration-related antibacterial effect. High concentrations of TiO2 bulk and silica MPs were found to cause some mortality (). AgNO3 had the most antibacterial effect of any of the metal-containing substances with a 100% killing rate for all dilution series tested.
Figure 3. Percentage of live S. mutans after a 24 h exposure to dispersions of nanomaterials compared to bulk or metal salt controls. Dilutions series of 1, 1/2, 1/4, 1/8, 1/16 and 1/32 correspond to 100, 50, 25, 12.5, 6.25 and 3.125 mg l−1, respectively of each material used; “*” shows significant difference from the saline negative control and “+” shows statistical difference from the corresponding dilution of the chlorhexidine positive control (one-way ANOVA, p < 0.05). Within a test solution, different letters indicate significant differences (one-way ANOVA, p < 0.05) between the dilution series, whereas complete absence of letters means no statistical difference between any of the dilutions; “#” shows that the nanosolutions were significantly different (two-way ANOVA, p < 0.05) from their corresponding salt metal or bulk control, whereas “NS” means no significant difference. Brackets show the groups compared.
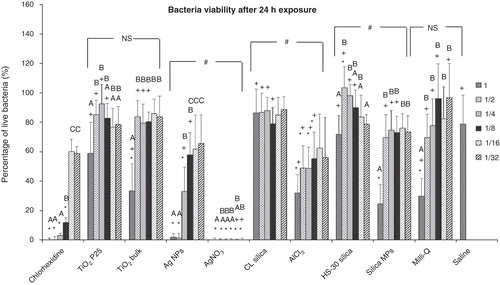
The cell viability remained good in the saline control with a measured percentage of live bacteria 78.8 ± 19.5% (mean ± S.D, n = 36), whereas no live microorganisms were detected in chlorhexidine for concentrations up to 0.25% (v/v). Chlorhexidine continued to have a strong antibacterial effect until the threshold of 0.0625% (v/v) where cell viability was less than 12% (live bacteria: 11.8 ± 3.4%). Interestingly, the viability of S. mutans in pure Milli-Q water (29.8 ± 12.0%, n = 6) was substantially less compared to the saline control (one-way ANOVA, p < 0.05), indicating osmotic shock as an antibacterial mechanism. The cell survival rate under the effect of 50 mg l−1Ag NPs was limited (1.4 ± 3.1%, n = 6), and viability increased as the Ag NPs were diluted. However, unlike chlorhexidine, this happened gradually with no sudden threshold in the Ag NP response. All the remaining ENMs (TiO2 P25, CL and HS-30 silicas) had no effect on S. mutans as their performance was not found significantly different compared to the saline control (one way ANOVA, p > 0.05).
The AlCl3 maintained a mild antimicrobial activity until the third dilution series (12.5 mg l−1), where the survival rate of bacteria was 29.9% or less compared to the saline control. TiO2 bulk and silica MPs solutions were antibacterial only at 100 mg l−1 with cell viability rates being 33.3 ± 18.5% and 24.6 ± 13.1%, respectively (n = 6). The cell viability was found to be statistically lower in all the metal or bulk controls compared to their nanoparticulate counterparts (two-way ANOVA, p < 0.05), except for TiO2 NPs compared to TiO2 bulk that were not significantly different from each other (two-way ANOVA, p > 0.05).
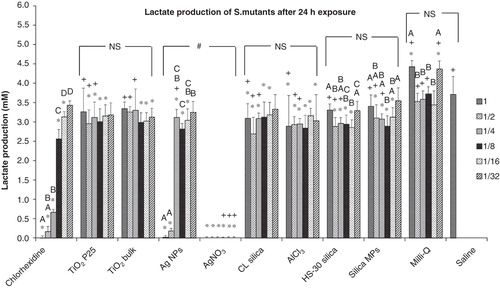
Lactate production
The lactate produced by S. mutans after a 24 h exposure to ENMs was measured (). No lactate was produced under the effect of the highest dilutions of chlorhexidine (0.5% v/v) and Ag NPs (100 mg l−1). The AgNO3 solution had the highest antibacterial activity as no lactate was detected for any of the dilutions tested. Milli-Q water did not have a negative impact on the production of lactate by S. mutans. The lactate production by S. mutans in saline was 3.70 ± 0.47 mM (n = 36). Chlorhexidine had a concentration effect on the production of lactate. The concentrations of lactate in 0.25% and 0.125% (v/v) chlorhexidine were lower compared to the saline control by 95.7% and 82.2%, respectively. Among the ENMs tested, Ag NPs had the most profound effect up to the 50 mg l−1 dilution, when lactate was measured to be 95.1% lower than in saline. When Ag NPs were further diluted, the lactate production increased but remained at statistically lower levels compared to the saline control up to the threshold of 6.25 mg l−1. The lactate measured in the remaining nanoparticulate solutions (TiO2 NPs, nanosilicas) was significantly lower compared to saline for most of the dilution series, but in these treatments the lactate production remained at millimolar levels (>2.69 mM). Statistical analysis showed that the ENMs were not different from their equivalent salt metal or bulk controls (two-way ANOVA, p > 0.05), with the exception of the Ag NPs compared to AgNO3.
Figure 4. Lactate production of S. mutans after a 24 h exposure to dispersions of nanomaterials compared to bulk or metal salt controls. Dilutions series of 1, 1/2, 1/4, 1/8, 1/16 and 1/32 correspond to 100, 50, 25, 12.5, 6.25 and 3.125 mg l−1, respectively of each material used; “*” shows significant difference from the saline negative control and “+” shows statistical difference from the corresponding dilution of the chlorhexidine positive control (one-way ANOVA, p < 0.05). Within a test solution, different letters indicate significant differences (one-way ANOVA, p < 0.05) between the dilution series, whereas complete absence of letters means no statistical difference between any of the dilutions; “#” shows that the nanosolutions were significantly different (two-way ANOVA, p < 0.05) from their corresponding salt metal or bulk control, whereas “NS” means no significant difference. Brackets show the groups compared.
Dissolution of dissolved silver from Ag NPs
This experiment was conducted to determine whether Ag NPs would release dissolved Ag in the saline–broth mixture used for the exposure studies. As expected, dissolved Ag from the AgNO3 salt (control experiment) rapidly appeared in the external media at milligram concentrations (). However, in comparison, Ag NPs released only a few micrograms of metal over 24 h (). Overall, the total dissolution of Ag from 100 mg l−1 Ag NPs solutions was around 9 µg l−1 or much less (). The release rate of Ag from the Ag NPs was 0.025, 0.047 and 0.058 μg min−1 for Milli-Q water, saline–BHI and saline alone respectively, which at the first hour of the experiment, was equivalent to 0.2%, 0.4% and 0.4% of the initial amount of metal in the dialysis bag. The saturation point in all three media was reached soon after, and the maximum release as a percentage of the initial amount of metal for Ag NPs was 0.2%, 0.6% and 0.6% for Milli-Q water, saline–BHI and saline alone, respectively; indicating that the Ag NPs remain practically insoluble regardless the media they were suspended in.
Figure 5. Dialysis curves showing the release of total dissolved silver from (A) AgNO3 and (B) Ag NPs over a 24 h period when suspended in Milli-Q, saline and saline–BHI media. A pure saline–BHI media was assigned as control. Data are means ± S.D, n = 3 replicates. Curves were fitted using SigmaPlot 12 (Systat Software, Inc.) applying the legal binding one site saturation equation on the raw data: (i) y = 1.35·abs(x)/(0.38 + abs(x)), (ii) y = 0.64·abs(x)/(30.46 + abs(x)), (iii) y = 316222.27·abs(x)/(32353213.72 + abs(x)), (iv) y = 0.003·abs(x)/(2.40E-017 + abs(x)), (v) y = 0.01·abs(x)/(0.38 + abs(x)), (vi) y = 0.01·abs(x)/(1.45E-017 + abs(x)) and (vii) y = 0.0002·abs(x)/(1.64E-016 + abs(x)). The y-axis scale for panel B is notably smaller compared to that of panel A. All three curves for Ag NPs shown in panel B are practically superimposed with the curve of the saline–BHI control in panel A. r 2 values for curve fits for AgNO3 (0.89-0.997) and for Ag NPs in saline (0.75) were good, but not for Ag NPs in Milli-Q water or saline-BHI media (<0.2) as ion release was very low.
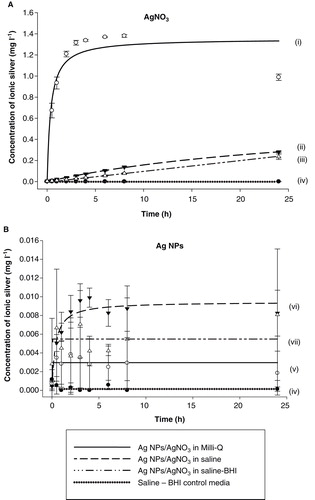
The total dissolution of Ag as a percentage of the initial amount of metal in the Milli-Q water solution of AgNO3 was 86.3% after 24 h. As expected, the corresponding values were considerably lower for total dissolved Ag in the saline and saline–BHI media (17.6% and 16.2%, respectively, ). Nonetheless, despite these losses of dissolved Ag in saline conditions, the Ag concentrations in the beakers were around 250 µg l−1 after 24 h. The maximum release rate of Ag (maximum slope, when the dialysis was not at equilibrium, t = 1 h), was 0.17, 0.17 and 8.24 μg min−1 for saline–BHI, saline alone and Milli-Q water, respectively. In Milli-Q water the dialysis did reach an equilibrium concentration after 8 h, but steady-state Ag concentrations were not achieved with other media, indicating the volume of the beakers was not limiting the dissolution. The blanks and beakers of control saline–BHI media did not contain any measurable silver (at detection limit of 1.2 µg l−1).
Discussion
This study reports the antibacterial effect of Ag, TiO2 and silica nanoparticulate dispersions against the oral pathogenic species, S. mutans. The antibacterial activity of the ENMs was tested in a high ionic strength medium of saline–BHI broth supplemented with 2% sucrose which, to our knowledge, has not been used previously to compare different materials. Overall, the data shows that AgNO3 was the most effective antibacterial agent, while Ag NPs was the most antibacterial among the ENMs. Although chlorhexidine is an effective antibacterial agent, it was not as effective as either AgNO3 or Ag NPs. In terms of antimicrobial end points, although the MIC assay has been routinely used for decades, our study suggests that this technique can be problematic for ENMs because it relies on measuring the absorbance of turbid solutions, and additional measurements are needed to correct this. In contrast, lactate production, and especially Live/Dead staining are sensitive alternative end points.
Material exposure and distribution of the particles in the test solutions
The exposure of S. mutans to the test media containing either NPs or MPs was confirmed by the measured metal concentrations (), and particle dispersion by NTA in the saline–BHI medium in the wells of the microplates (). Some loss of TiO2 due to unavoidable settling at the high ionic strength of the saline-containing media was expected (Vevers & Jha Citation2008), but the settling was modest with 60–80% of the nominal exposure concentration achieved (). For AgNO3 in saline conditions, speciation theory predicts rapid precipitation of the silver as insoluble silver chloride, with <0.01% of the silver remaining as the free Ag+ ion which is thought to be responsible for silver toxicity to microbes (see discussion in Bradford et al. Citation2009). This was reflected in loss of some of the measured total Ag from the test media, but this was not as great as expected, with about 22% of the total Ag remaining in the dispersion. This was almost certainly not free Ag+ ions in solution, but more likely, Ag chelated with the proteins in the broth (e.g., with high affinity cysteine residues), or dispersed aggregates of insoluble silver chloride particles formed in the saline component of the media (particles were readily detected above the media background by NTA, ). Crystals from the AgNO3 solution are evident from the electron micrographs (), and this is not easily explained by dehydration artefact since the crystals will have already formed in the saline solution and are evident as particles by the separate technique of NTA. In the case of Ag NPs, with negligible release of free silver ions (see below), the situation was worse with only 9 mg l−1 of the original 100 mg l−1 remaining (). This was confirmed by NTA which showed particle numbers approaching the background level for the medium, a complex dispersion containing NaCl crystals (), indicating that most of the Ag NPs had settled very quickly (seconds-minutes) from the test media. However, despite only about 10% of Ag NPs remaining in dispersion in the test media, it was still very toxic to S. mutans (, ). The silica-containing NPs seemed to remain dispersed at the nominal concentration in the test media, but approximately 40% of the concentration of silica from silica MPs was lost and may simply be associated with settling of the larger micron scale material (). Interestingly, the aggregate size of the remaining silica MPs was about the same as the aggregates of HS-30 silica NPs (both around 200 nm by NTA, ).
MIC assay
The MIC assay is widely used as an antimicrobial susceptibility test, and standardised protocols have been developed by several agencies (e.g., review by Andrews Citation2001). However, while this test may have some utility for testing ENMs, the measurements are ultimately based on the absorbance of the samples. The 100 mg l−1 silica MPs dispersion as well as the TiO2 NPs and TiO2 bulk dispersions were so naturally turbid that this masked the absorbance caused by bacterial growth (). However, at concentrations of 12.5 mg l−1 or less of the NPs, this was not a problem. Separate plates were also needed to enable turbidity corrections due to the ENMs alone, and this adds extra logistics to the protocol. Thus, overall the established MIC assay would benefit from some modification to work with NPs, including using low mg l−1 dilutions of NPs and a particle turbidity control in every experiment. The amount of turbidity correction is particle-specific (compare ), and this is expected since factors such as the size, shape and crystallinity of the different particles will affect the absorbance measurements. This approach to turbidity correction for the presence of the particles is likely to be the worst case scenario (maximum correction required) as it assumes that the microbes themselves are not lowering the particle number concentration or agglomerate size in the media. Unfortunately, there is no way of measuring particle distributions with the microbes present, as the microbes mask the NTA measurements of the particles, and dynamic light scattering measurements are well known to be skewed by small numbers of large micron scale items (such as the microbes; see CitationHandy et al. 2012, for discussion of optical methods). It has been suggested that the presence of bacteria may be promoting particles agglomeration (Kendall et al. Citation2010), but equally the protein exudating from microbes might have the opposite effect and stabilise dispersions (Horst et al. Citation2010).
Nonetheless, with careful controls the assay can give useful information, and here the MIC for the Ag NPs was 50 mg l−1, compared to 3.125 mg l−1 for AgNO3. MIC values for AgNO3 have not been previously reported for saline–BHI media, but the value here is much lower than those reported in other growth media for S. mutans (e.g., 20 mg l−1 in tryptone–glucose–Marmite medium, 24 h incubation time, Thibodeau et al. Citation1978; 100 mg l−1 in basal medium, 24 h incubation time, Youravong et al. Citation2011), suggesting that Ag was more bioavailable in the media used in the present study. Reports of MIC values for 24 h exposures of S. mutans to sub-100 nm-sized Ag NPs also vary (e.g., 67 mg l−1, particles size: 9 nm, S. mutans inoculum: 6 × 10⁵ CFU/ml−1 in BHI + 2% sucrose, Espinosa-Cristobal et al. Citation2009; 4.9 ± 2.7 mg l−1, particle size: 25 nm, S. mutans inoculum: 1.5 × 10⁵ CFU/ml−1 in saline–phosphate buffer solution, Hernandez-Sierra et al. Citation2008). Notably, the MIC value reported by Espinosa-Cristobal et al. (Citation2009) using very similar BHI media was closer to the present study (). This suggests that, from the view point of metal speciation and the behaviour of metallic ENMs, it would be prudent to standardise the chemical composition of bacterial media used for the MIC assay wherever possible (e.g., the same saline recipe, comparable additions of protein). However, nutritional supplements should not be neglected in this standardisation, and for S. mutans, additions of sucrose can increase the resistance of the organism to antibacterial agents (Kreth et al. Citation2008); resulting in higher MIC values. Recently it has been suggested that the crystallinity of Ag NPs, or defects in the crystal structure leading to shedding of Ag ions could be important in toxicity (in rainbow trout gill epithelial cells, George et al. Citation2012). This may not be important in the present study (negligible dissolution of Ag ion occurred as measured by dialysis, ) and Suresh et al. (Citation2012) argues that it is not the crystallinity of the material per se but any organic coating formed on it (intentionally, or by adsorption from the culture media) that is more important. In the present study, the complex broth used almost certainly will have coated the Ag NPs (all the materials) with a myriad of macromolecules, and it seems unlikely that the bacteria would not be exposed directly to the particle surfaces.
Live/Dead kit and lactate assay
The turbidity interference with the MIC assay is clearly a limitation of this test, and for hazard assessment of ENMs, a weight of evidence from more than one approach is advocated (see Klaine et al. Citation2012). The Live/Dead kit, which is based on fluorescence instead of absorbance, was used to investigate the cell viability after 24 h of exposure to the test media. This kit has been used previously to determine the proportions of dead microbes in studies with ENMs (e.g., Se NPs, Tran & Webster Citation2011; Ag NPs, Santoro et al. Citation2007; Nano emulsions, Ramalingam et al. Citation2011). Data on Ag NP toxicity to S. mutans using this kit appears not to have been reported. However, for Pseudomonas aeruginosa the Live/Dead kit reported no cell mortality with 10 µM Ag NPs (about 1 mg l−1 Ag NPs) over 10 days, but some mortality with 4 µM AgNO3 (Santoro et al. Citation2007). The present study suggests that around 35% of S. mutans are killed at Ag NPs concentrations of 3.125 mg l−1 (the 1/32 dilution, ), indicating that the threshold for Ag NPs toxicity is a little less likely than this (perhaps around 1–2 mg l−1 or 9–18 µM) for Ag NPs using this kit.
The Live/Dead kit confirmed the antibacterial effect of AgNO3, Ag NPs and chlorhexidine in accordance to the results of the MIC assay (). The data acquired also supported those of the MIC assay showing a reduced bacterial viability for 100 mg l−1 TiO2 (NPs and bulk) and SiO2 MPs. Aluminium was expected to be the active moiety in the AlCl3 and CL silica NPs media, imposing a toxic effect on bacteria. However, although both media carried the same total aluminium metal content, only AlCl3 had a significant antibacterial effect on S. mutans (). The fact that CL silica showed no antibacterial activity suggests that the alumina coating on the surface of the silica NPs remains inert or not very bioavailable in the media. The latter is unsurprising with the low bioavailability of Al in the gut (1% or less, DeVoto & Yokel Citation1994) being partly associated with the ability of Al to form relatively stable complexes with phosphate or citrate and would be bound to amino acid residues (histidine, cysteine) on proteins in the broth. However, there appears to be no previous reports of the antibacterial effectiveness of aluminium-bearing silica NPs against S. mutans.
It has been suggested that metabolic end points in bacteria relating to respiration or biochemical functions of the bacterial cell wall may be more sensitive end points than traditional growth or survival assays for microbes with ENMs (Handy et al. Citation2012). The lactate assay is arguably a more sensitive sub-lethal end point related to microbial respiration (fermentation of sugars to lactate), and the absence of any lactate production would indicate the failure of respiration (i.e., cell damage or mortality). The lactate results () were broadly in agreement with the MIC assay () and the Live/Dead kit () with respect to the effectiveness of the AgNO3, Ag NPs and chlorhexidine. However, the low cell viability suggested by the Live/Dead kit assay for S. mutans exposed to 100 mg l−1 TiO2 bulk and 100 mg l−1 silica MPs was not confirmed by the lactate assay which showed some increase in lactate (i.e., more survival than predicted by the other assays). A similar disagreement between the Live/Dead kit and lactate assay results was also observed for bacteria exposed to AlCl3 and Milli-Q water. However, these differences between end points could be attributed to early lactate release in the microbes relative to the more rapid settling rate of the media (i.e., a mismatch of exposure and effect because of the dynamics of the media and the organism). The bulk TiO2 and silica MPs dispersions contained the largest primary particles (), and at high concentrations, the suspended particles were more prone to settling. Thus, for the first few hours of the incubation period, the bacteria remained suspended in the media, while a considerable number of the particles in the 100 mg l−1 TiO2 bulk and silica MPs may have already precipitated. During this time, bacteria in suspension continued to produce lactate. However, in artificial media such as the BHI broth, S. mutans are known to grow in chains (Huser et al. Citation1983), and when these chains become long enough they precipitate due to increased weight. This requires some time to occur, perhaps a few hours, depending on the experimental conditions. For example, Beckers & van der Hoeven (Citation1982) have reported that the doubling time for S. mutans under a sucrose diet is 1.1 ± 0.2 h. Nonetheless, the resulting effect would be that the microbes are now at the bottom of the well and once again in direct contact with the test materials (and will die as the MIC assay or Live/Dead kit predicts), but the metabolically produced lactate is already in the media.
This illustrates a very important point about method development for microbial assays with ENMs in toxicity testing strategies; it is not just the particles that settle. Microbes may do as well, but at a different rate to the test material, leading to the risk of artefacts (false positive in metabolic end points) or even misinterpretation of the results. It is possible to predict the likelihood of settling in test media by calculating the stability ratio (W) which considers factors other than particle size including ionic strength and temperature (see Handy et al. Citation2012 for details and equations). However, this approach is problematic with cells present because of their different surface chemistries (see CitationHandy et al. 2012, for microbial cell wall chemistry in relation to ENMs) and irregular (i.e., non-spherical) shapes. Nonetheless, researchers can make critical coagulation concentration measurements (Handy et al. Citation2012) in the presence/absence of the test organism to get some understanding of the setting behaviour of their test system.
Are ENMs better disinfectants than chlorhexidine?
Current regulatory procedures for approving new medicines or medical devices depend on two key foundations: (i) demonstrating that the new product is better or more effective than the existing product and (ii) that the new product is safe, or safer than the old one. Using three different assays (, , ) this study demonstrated that Ag NPs are much more effective at killing S. mutans than the traditional chlorhexidine disinfectant (or any of the other ENMs tested). This difference was considerable. When compared to chlorhexidine, Ag NPs were found to have a 25-fold lower MIC value (). The survival rate of S. mutans was 30-fold lower after exposure to 100 mg l−1Ag NPs media than to the equivalent concentration of chlorhexidine (), while the lactate production was also seven times less in the Ag NP treatment (). Thus, from the perspective of efficacy, Ag NPs were the best performing NP and better than chlorhexidine.
However, safety and biocompatibility also need to be considered. Although chlorhexidine is widely used as a disinfectant or antiseptic in dentistry with the reported advantage of commencing microbial killing within 20 s (Hugo & Longworth Citation1964), it also has some disadvantages. Patient information with the commercial product indicates that it should not be used for individuals with allergies, during pregnancy or breastfeeding. Its long-term use is also associated with taste disturbances as well as the discolouration of the teeth and tongue (Flotra et al. Citation1971). Chemical reactivity with other dental products is a more significant problem, and for example, chlorhexidine has also been reported to deteriorate the mechanical properties of dental restorative materials when added as a constituent (Takahashi et al. Citation2006). The clinical safety issues relating to the use of chlorhexidine should therefore be balanced against those for Ag NPs.
The silica and TiO2 NPs examined in this study showed limited or no effect against S. mutans and thus they cannot be considered as substitutes for chlorhexidine. This finding comes in agreement with previous studies having shown that considerably higher concentrations of either silica or TiO2 (>1000 mg l−1) are required to start providing some evidence of bacterial growth inhibition (Adams et al. Citation2006). Although it has been suggested that the surface charge can determine the cytotoxicity of Si NPs towards human cells, with positively charged particles being 250-fold more cytotoxic compared to their negatively charged counterparts (Bhattacharjee et al. Citation2010), no such evidence was shown in our study. The results for both CL and HS-30 silica NPs were very similar suggesting that the particle charge/coating did not affect the antibacterial behaviour of silica NPs against S. mutans at any of the concentrations tested. It is theoretically possible that the macromolecules (proteins, etc.) in the broth may have coated both types of particles, so that the test organism was effectively exposed to the same surface, but this seems a less likely, given that Ag NPs in the same saline–broth mixture was toxic. The absence of an Al coating effect due to low Al bioavailability (above) seems a more likely explanation for the silica NPs. However, the role of different types of silica in preventing bacterial adherence on organic or inorganic substrates should be further investigated.
The biocompatibility of Ag NPs compared to AgNO3 for clinical use in dentistry
Ag NPs have already been used in polymers for invasive medical devices (e.g., cardiovascular implants, venous and neurosurgical catheters) to diminish the incidence of bacterial infections (Chaloupka et al. Citation2010), and while hazard data on dental applications remains to be collected, it seems logical that most dental procedures would be less invasive than the clinical uses of Ag NPs already approved. In dentistry, nanocomposites and orthodontic adhesives seem to be the major applications for Ag NPs, with promising results for antibacterial properties so far (Ahn et al. Citation2009; Travan et al. Citation2009). The Ag NPs offer a number of advantages over AgNO3 in terms of both biocompatibility and utility as a material for dental applications. While AgNO3 (, , ) was the best antibacterial agent of all the substances tested, Ag metal salts are also toxic with a threshold dose for no effect around 1–200 mg Ag kg−1 day−1 in rodents (review Ratte Citation1999). Concerns have been raised about the biocompatibility and historic use of Ag compounds in dentistry; especially on the issue of long-term Ag accumulation in the skin, internal organs and subsequent chronic toxicity (review, Peng et al. Citation2012). Dissolved Ag is acutely toxic to mammalian cells in culture at micromolar concentrations. For example, 5 µM AgNO3 is enough to cause oxidative stress in human skin fibroblasts, while 40 µmol l−1 (about 6.8 mg l−1) is acutely toxic to the cells in 24 h (Cortese-Krott et al. Citation2009). The inevitable black staining of the oral mucosa from AgNO3 is also aesthetically undesirable. In contrast, Ag NPs appear to be at least ten times less toxic to mammalian cells in culture (lethal toxic effects in the 50–1000 mg l−1 range in 24 h, Mukherjee et al. Citation2012) but would still provide the antibacterial properties shown here.
Concerns of free metal ion toxicity in the oral cavity from Ag NPs are also unfounded. At the high ionic strength of the saline used here, there was almost no measurable release of Ag from the Ag NPs () and this is in agreement with Stebounova et al. (Citation2011) who found the dissolution of Ag NPs to be less than 0.1% in biological fluids. Stebounova et al. (Citation2011) used particles with a measured size of about 22 nm in the aerosols used (compared with 56 nm here, ) but did not report the maximum dissolution rates except the relative total amounts. A particle size comparison on dissolution rates across studies is therefore not possible. Theoretically, one might expect faster dissolution from the smaller particle, but the BET surface area measurements in the two studies were similar (3 ± 2 m2 g−1 compared to 4.8 m2 g−1 here). The presence of a surface coating could potentially act as a barrier for the Ag+ release, but the Ag NPs used in this study bore no coating at the start (confirmed by energy dispersive X-ray analysis, data not shown) and there were no organic molecule impurities that could be discerned by CHN analysis. Consequently, the most likely explanation for low Ag dissolution is the ionic strength of the media. Both the present study and Stebounova et al. (Citation2011) used physiological salines with mM levels of NaCl. Typically, NaCl concentration in the oral cavity mucus secretions is approximately 10 mM (White et al. Citation1955), and low dissolution is therefore expected in dental patients because any trace Ag released into the oral cavity at such ionic strengths would rapidly form insoluble choro-complexes (see above) and therefore not be very bioavailable. Taken together these observations suggest that the biocompatibility of Ag NPs may be good, and that on the criteria of both efficacy and safety Ag NPs may be a viable alternative to both chlorhexidine and AgNO3.
The way in which Ag ions are delivered by Ag NPs may also resolve the classical dilemma faced by most medicines, that is, how to have a beneficial biological effect without inherent toxicity to the patient. The microbes in this study were killed by Ag NPs, in conditions where free Ag+ in the media will likely be very low. One possible mode of action is direct contact of the particles with the bacterial cell wall. In this instance the particles are far too large to penetrate the bacterial cell wall, but the release of Ag+ ions locally in the microenvironment on the surface of the organism would result in locally high (toxic) concentrations that could kill the organism. Effects on the electrical and biochemical integrity of the bacterial cell wall also cannot be excluded (see discussion in Handy et al. Citation2012). Nonetheless, the bacteria are killed, and the patient would be protected by the slow dissolution rate and high ionic strength of the oral cavity.
Conclusions
Of the materials tested, Ag NPs and AgNO3 were more antibacterial to S. mutans than the traditional chlorhexidine disinfectant used in dentistry. The widely used MIC assay remains a useful tool for assessing the antibacterial properties for ENMs but recommendations for improvements in the protocol include additional controls for the inherent turbidity of the materials and the use of low milligram dilutions of the test material in the microplates. The use of the fluorescence-based Live/Dead staining assay also has utility as a sensitive alternative method. However, lactate production while sensitive and easily quantified may have limitations with larger particle sizes. Silica MPs may offer an alternative mode of antibacterial protection that requires further investigation.
Declaration of interest
The authors report no conflicts of interest. The authors alone are responsible for the content and writing of the paper.
Acknowledgements
This work was supported by strategic funding from the University of Plymouth awarded to Handy and De Peralta. Technical support from M Emery for preparing microbial cultures is gratefully acknowledged.
References
- Adams LK, Lyon DY, Alvarez PJ. 2006. Comparative eco-toxicity of nanoscale TiO2, SiO2, and ZnO water suspensions. Water Res 40:3527–3532.
- Ahn SJ, Lee SJ, Kook JK, Lim BS. 2009. Experimental antimicrobial orthodontic adhesives using nanofillers and silver nanoparticles. Dent Mater 25:206–213.
- Allaker RP. 2010. The use of nanoparticles to control oral biofilm formation. J Dent Res 89:1175–1186.
- Andrews JM. 2001. Determination of minimum inhibitory concentrations. J Antimicrob Chemother 48:5–16.
- Balakrishnan M, Simmonds RS, Tagg JR. 2000. Dental caries is a preventable infectious disease. Aust Dent J 45:235–245.
- Beckers HJ, van der Hoeven JS. 1982. Growth rates of Actinomyces viscosus and Streptococcus mutans during early colonization of tooth surfaces in gnotobiotic rats. Infect Immun 35:583–587.
- Bhattacharjee S, de Haan LH, Evers NM, Jiang X, Marcelis AT, Zuilhof H, et al. 2010. Role of surface charge and oxidative stress in cytotoxicity of organic monolayer-coated silicon nanoparticles towards macrophage NR8383 cells. Part Fibre Toxicol 7:25–36.
- Bradford A, Handy RD, Readman JW, Atfield A, Mühling M. 2009. Impact of silver nanoparticle contamination on the genetic diversity of natural bacterial assemblages in estuarine sediments. Environ Sci Technol 15:4530–4536.
- Bratthall D. 1972. Demonstration of Streptococcus mutans strains in some selected areas of the world. Odontol Revy 23:401–410.
- Chaloupka K, Malam Y, Seifalian AM. 2010. Nanosilver as a new generation of nanoproduct in biomedical applications. Trends Biotechnol 28:580–588.
- Cortese-Krott MM, Munchow M, Pirev E, Hessner F, Bozkurt A, Uciechowski P, et al. 2009. Silver ions induce oxidative stress and intracellular zinc release in human skin fibroblasts. Free Radic Biol Med 47:1570–1577.
- Cousins BG, Allison HE, Doherty PJ, Edwards C, Garvey MJ, Martin DS, et al. 2007. Effects of a nanoparticulate silica substrate on cell attachment of Candida albicans. J Appl Microbiol 102:757–765.
- DeVoto E, Yokel RA. 1994. The biological speciation and toxicokinetics of aluminum. Environ Health Perspect 102:940–951.
- Espinosa-Cristobal LF, Martinez-Castanon GA, Martinez-Martinez RE, Loyola-Rodriguez JP, Patino-Marin N, Reyes-Macias JF, et al. 2009. Antibacterial effect of silver nanoparticles against Streptococcus mutans. Mater Lett 63:2603–2606.
- Federici G, Shaw BJ, Handy RD. 2007. Toxicity of titanium dioxide nanoparticles to rainbow trout (Oncorhynchus mykiss): gill injury, oxidative stress, and other physiological effects. Aquat Toxicol 84:415–430.
- Filipe V, Hawe A, Jiskoot W. 2010. Critical evaluation of Nanoparticle Tracking Analysis (NTA) by NanoSight for the measurement of nanoparticles and protein aggregates. Pharm Res 27:796–810.
- Flotra L, Gjermo P, Rolla G, Waerhaug J. 1971. Side effects of chlorhexidine mouth washes. Scand J Dent Res 79:119–125.
- George S, Lin S, Ji Z, Thomas CR, Li L, Mecklenburg M, et al. 2012. Surface defects on plate-shaped silver nanoparticles contribute to its hazard potential in a fish gill cell line and zebrafish embryos. ACS Nano 6:3745–3759.
- Gutmann I, Wahlefeld AW. 1974. L-(+)-lactate determination with lactate dehydrogenase and NAD. In: Bergmeyer HU, editor. Methods in enzymatic analysis. London: Academic Press. pp 1464–1468.
- Han DM, Song CF, Guo GS, Li XY. 2010. Synthesis and fluorescence properties of CdSe/CdS nanoparticles in aqueous media. Sci China Chem 53:1055–1059.
- Handy RD, Eddy FB, Romain G. 1989. In vitro evidence for the ionoregulatory role of rainbow trout mucus in acid, acid/aluminium and zinc toxicity. J Fish Biol 35:737–747.
- Handy RD, van den Brink N, Chappell M, Mühling M, Behra R, Dušinská M, et al. 2012. Practical considerations for conducting ecotoxicity test methods with manufactured nanomaterials: What have we learnt so far? Ecotoxicology 21:933–972.
- Hernandez-Sierra JF, Ruiz F, Pena DC, Martinez-Gutierrez F, Martinez AE, Guillen Ade J, et al. 2008. The antimicrobial sensitivity of Streptococcus mutans to nanoparticles of silver, zinc oxide, and gold. Nanomedicine 4:237–240.
- Hill TJ, Arnold FA. 1937. The effect of silver nitrate in the prevention of dental caries. J Dent Res 16:23–28.
- Hirakawa K, Mori M, Yoshida M, Oikawa S, Kawanishi S. 2004. Photo-irradiated titanium dioxide catalyzes site specific DNA damage via generation of hydrogen peroxide. Free Radic Res 38:439–447.
- Horst AM, Neal AC, Mielke RE, Sislian PR, Suh WH, Madler L, et al. 2010. Dispersion of TiO2 nanoparticle agglomerates by Pseudomonas aeruginosa. Appl Environ Microbiol 76:7292–7298.
- Hugo WB, Longworth AR. 1964. Some aspects of the mode of action of chlorhexidine. J Pharm Pharmacol 16:655–662.
- Huser H, Goeke L, Karst G, Fehrenbach FJ. 1983. Fermenter growth of Streptococcus agalactiae and large-scale production of CAMP factor. J Gen Microbiol 129:1295–1300.
- Kendall K, Kendall M, Rehfeldt F. 2010. Adhesion of cells, viruses and nanoparticles. New York: Springer. pp 246–248.
- Kim JS, Kuk E, Yu KN, Kim JH, Park SJ, Lee HJ, et al. 2007. Antimicrobial effects of silver nanoparticles. Nanomedicine 3:95–101.
- Klaine SJ, Koelmans AA, Horne N, Carley S, Handy RD, Kapustka L, et al. 2012. Paradigms to assess the environmental impact of manufactured nanomaterials. Environ Toxicol Chem 31:3–14.
- Kreth J, Zhu L, Merritt J, Shi W, Qi F. 2008. Role of sucrose in the fitness of Streptococcus mutans. Oral Microbiol Immunol 23:213–219.
- Li Q, Mahendra S, Lyon DY, Brunet L, Liga MV, Li D Alvarez PJ. 2008. Antimicrobial nanomaterials for water disinfection and microbial control: potential applications and implications. Water Res 42:4591–4602.
- Linsebigler AL, Lu G, Yates JT. 1995. Photocatalysis on TiO2 surfaces: principles, mechanisms, and selected results. Chem Rev 95:735–758.
- Mukherjee SG, O’Claonadh N, Casey A, Chambers G. 2012. Comparative in vitro cytotoxicity study of silver nanoparticle on two mammalian cell lines. Toxicol In Vitro 26:238–251.
- Nyvad B, Kilian M. 1990. Comparison of the initial streptococcal microflora on dental enamel in caries-active and in caries-inactive individuals. Caries Res 24:267–272.
- Peng JJ-Y, Botelho MG, Matinlinna JP. 2012. Silver compounds used in dentistry for caries management: A review. J Dent 40:531–541.
- Ramalingam K, Amaechi BT, Rawls HR, Lee VA. 2011. Antimicrobial activity of nanoemulsion on cariogenic Streptococcus mutans. Arch Oral Biol 56:437–455.
- Ratte HT. 1999. Bioaccumulation and toxicity of silver compounds: a review. Environ Toxicol Chem 18:89–108.
- Santoro CM, Duchsherer NL, Grainger DW. 2007. Antimicrobial efficacy and ocular cell toxicity from silver nanoparticles. NanoBiotechnology 3:55–65.
- Shaw BJ, Handy RD. 2011. Physiological effects of nanoparticles on fish: a comparison of nanometals versus metal ions. Environ Int 37:1083–1097.
- Shaw JH. 1987. Causes and control of dental caries. N Engl J Med 317:996–1004.
- Sondi I, Salopek-Sondi B. 2004. Silver nanoparticles as antimicrobial agent: a case study on E. coli as a model for Gram-negative bacteria. J Colloid Interface Sci 275:177–182.
- Stebounova LV, Adamcakova-Dodd A, Kim JS, Park H, O'Shaughnessy PT, Grassian VH, et al. 2011. Nanosilver induces minimal lung toxicity or inflammation in a subacute murine inhalation model. Part Fibre Toxicol 8:5.
- Suresh AK, Pelletier DA, Wang W, Morrell-Falvey JL, Gu B, Doktycz MJ. 2012. Cytotoxicity induced by engineered silver nanocrystallites is dependent on surface coatings and cell types. Langmuir 28:2727–2735.
- Takahashi Y, Imazato S, Kaneshiro AV, Ebisu S, Frencken JE, Tay FR. 2006. Antibacterial effects and physical properties of glass-ionomer cements containing chlorhexidine for the ART approach. Dent Mater 22:647–652.
- Thibodeau EA, Handelman SL, Marquis RE. 1978. Inhibition and killing of oral bacteria by silver ions generated with low intensity direct current. J Dent Res 57:922–926.
- Tran PA, Webster TJ. 2011. Selenium nanoparticles inhibit Staphylococcus aureus growth. Int J Nanomedicine 6:1553–1558.
- Travan A, Pelillo C, Donati I, Marsich E, Benincasa M, Scarpa T, et al. 2009. Non-cytotoxic silver nanoparticle-polysaccharide nanocomposites with antimicrobial activity. Biomacromolecules 10:1429–1435.
- Vevers WF, Jha AN. 2008. Genotoxic and cytotoxic potential of titanium dioxide (TiO2) nanoparticles on fish cells in vitro. Ecotoxicology 17:410–420.
- Weber DJ, Rutala WA. 2001. Use of metals as microbicides in preventing infections in healthcare. In: Block SS, editor. Disinfection, sterilization, and preservation. Philadelphia: Lippincott Williams and Wilkins. pp 415–427.
- White AG, Entmacher PS, Rubin G, Leiter L. 1955. Physiological and pharmacological regulation of human salivary electrolyte concentrations; with a discussion of electrolyte concentrations of some other exocrine secretions. J Clin Invest 34:246–255.
- Windeatt KM, Handy RD. 2012. Effect of nanomaterials on the compound action potential of the shore crab, Carcinus maenas. Nanotoxicology. [Epub ahead of print].
- Wong MS, Chu WC, Sun DS, Huang HS, Chen JH, Tsai PJ, et al. 2006. Visible-light-induced bactericidal activity of a nitrogen-doped titanium photocatalyst against human pathogens. Appl Environ Microbiol 72:6111–6116.
- Youravong N, Carlen A, Teanpaisan R, Dahlen G. 2011. Metal-ion susceptibility of oral bacterial species. Lett Appl Microbiol 53:324–328.