
Abstract
The four copper nanoparticles (CuNPs) with the size of 25, 50, 78 and 100 nm and one type of micron-sized particles (MPs) (∼500 nm) were exposed to two mammalian (H4IIE and HepG2) and two piscine (PLHC-1 and RTH-149) cell lines to test the species-specific toxicities of CuNPs. The results showed that the morphologies, ion release and size of the particles all played an important role when investigating the toxicity. Furthermore, the authors found that the particle forms of CuNPs in suspensions highly contribute to the toxicity in all exposed cell lines whereas copper ions (Cu2+) only caused significant responses in mammalian cell lines, indicating the species-specific toxicity of CuNPs. This study revealed that the morphologies, ion release rate of NPs as well as the species-specific vulnerabilities of cells should all be considered when explaining and extrapolating toxicity test results among particles and among species.
Introduction
Considering the wide application of copper nanoparticles (CuNPs) in a variety of fields, such as in facial spray, as additives in lubricants, in metallic coating and inks, anode materials for lithium ion batteries (Cioffi et al. Citation2005; Guo et al. Citation2002; Lei et al. Citation2008; Liu et al. Citation2004), CuNPs can enter into diverse environmental compartments and be taken up by organisms through intake of water, food and even from soil by plant species resulting in reduced seedling growth (Lee et al. Citation2008). Therefore, the potential risks from exposure to CuNPs must be further investigated.
Various studies showed that CuNPs can cause a diversity of toxic effects to biological systems. CuNPs showed a size- and concentration-dependent toxicity to dorsal root ganglion neurons of rat (Prabhu et al. Citation2010). Lei et al. (Citation2008) claimed that CuNPs could cause scattered dot hepatocytic necrosis and widespread renal proximal tubule necrosis in the rat. Chen et al. (Citation2006) showed that only CuNPs can induce toxicological effects and severe pathological injuries to the kidney, liver and spleen of mice when compared with copper at micrometer size. It is already known that the toxicity caused by micro copper is lower than the toxicity of CuNPs and the toxicity caused by copper ions in CuNPs media and the toxicity of copper oxide NPs cannot be simply explained by Cu ions released into the cell medium (Chen et al. Citation2006; Karlsson et al. Citation2008). However, little attention has been paid to species-specific NP toxicity and only a limited number of studies have quantified the toxicity contribution of the particle form of NPs and released ions to the total toxicity of particle suspensions (Patra et al. Citation2007). Therefore, the sensitivity of four different hepatoma cell lines, two mammalian and two piscine in origin, exposed to four sizes of CuNPs and one type of micron-sized copper particles (MPs), was investigated in this study. The aim is to evaluate the species-specific acute toxicity of CuNPs at the cellular level and to evaluate the toxicity contribution of the particle form of CuNPs and ions to the total toxicity of particle suspensions, respectively. Uptake of NPs is not investigated in this study since uptake of NPs cannot always and also is not the only pathway to cause acute toxicity to cells (George et al Citation2009). For instance, a large amount of uptake may not cause any toxic effect due to the inert characterisation of NPs or the high tolerability of cells (Connor et al. Citation2005). Cytotoxic effects and reactive oxygen species (ROS) levels were correlated with the physico-chemical properties of the CuNPs and the cell types. Liver being the critical organ for copper storage, homeostasis and excretion of several species and an inherited disorder of copper metabolism can cause Wilson's disease in humans (Tao & Gitlin, Citation2003). Therefore, hepatocytes were chosen as the cell lines for this research. The preliminary hypotheses of this study are: 1) size or shape of CuNPs can influence their toxicity; 2) the toxicity of CuNPs can be related to the type of the cells that they are exposed to; 3) ion release is not the dominant factor inducing toxicity of CuNPs.
Materials and methods
Chemicals and reagents
CuNPs of 25, 50 and 100 nm sizes were purchased from IoLiTec, Inc., Germany. CuNPs of 78 nm as well as the MPs (nominal size of MPs is 500 nm) were purchased from NanoAmor®, USA (Houston, TX , USA). All particles are uncoated. The resazurin in vitro toxicology assay kit, 6-carboxy-2′7′-dichlorofluorescein diacetate (DCFH-DA) probe and copper (II) nitrate hydrate (Cu(NO3)2) were purchased from Sigma Aldrich, Madrid, Spain. Ethanol was from Panreac (Barcelona, Spain). Ultraglutamine 1 (200 mM), l-glutamine (200 mM), foetal bovine serum (FBS), penicillin and streptomycin (P/S) (10,000 U/ml/10 mg/ml), non-essential amino acids 100X (NEAA), sodium pyruvate (100 mM), Eagle's Minimum Essential Media (EMEM) for cell culture and Alpha Minimum Essential Media (α-MEM) were purchased from Lonza (Barcelona, Spain). Phenol-red free, serum free Minimum Essential Media (MEM) was sourced from PAN Biotech GmbH, Germany. Analysis grade nitric acid 65% from Scharlau (Barcelona, Spain) purified by sub-boiling distillation in a Milestone Duopur (Milestone srl., Italy) and high purity water (>18 MΩ/cm) obtained from a Milli-Q Element A10 Century (Millipore Ibérica, Spain) were used for inductively coupled plasma mass spectrometry (ICP-MS) analysis.
Preparations of CuNPs
Stock copper suspensions (200 µg/ml) of the four types of CuNPs (25, 50, 78 and 100 nm), of the MPs and of Cu(NO3)2 were freshly prepared and dispersed in culture media used for culturing each cell line (Supplementary 1) using sonication for 10 min in an S 40 H Elmasonic water bath sonicator (Elma, Germany). The MPs were included to compare the toxicity of nano/microparticles. Cu(NO3)2 was used as a positive control and the response curves of Cu(NO3)2 were used to calculate the effects of copper ions (Cu2+) present in copper suspensions.
Physico-chemical characterisation
Dynamic light scattering
The size distributions of all particles at 200 µg/ml were measured directly after preparation (0 h) in four types of culture media and after 24 h incubation under relevant culture conditions (see cell cultures section) by dynamic light scattering (DLS) on a Zetasizer Nano-ZS instrument (Malvern, Instruments Ltd., UK). Three independent measurements were taken with each measurement consisting of four measurements. The different types of culture media were also included in measurements to act as background controls as the presence of large proteins and other media components may affect the DLS measurements. Any peaks detected in the same size range as those found in the media were attributed to media components (Supplementary 2). This instrument was also used to ensure that there were no CuNPs but only copper ions in the supernatants of centrifuged media suspensions in the copper ion release experimental setup (see Actual exposure concentrations and copper ion release section). A Zetasizer Nano-ZS instrument was also used to try to measure the zeta potential of nanoparticles in culture medium (200 µg/ml). However due to the high (>9 mS/cm) conductivity of EMEM, medium quality criteria could not be met and measurements were aborted.
Transmission electron microscopy
Transmission electron microscopy (TEM) analysis was used to characterise the morphology and size distribution of copper suspensions after 24 h incubation. Analysis was only performed in one type of culture medium, EMEM culture medium, because the DLS measurements showed that the different media compositions and temperatures did not influence the hydrodynamic size profiles of the CuNPs. TEM was also used to characterise the primary particle size of the copper suspensions using ethanol as a dispersant. This allowed us to compare profiles and analyse the impact of the media. A JEOL 2100 HT (JEOL Ltd., Japan) TEM was used, operating at an accelerating voltage of 200 kV with integrated energy dispersive X-ray (EDX) spectroscopy (EDX) (Oxford Inca, UK). Stock copper suspensions (200 µg/ml) were deposited onto copper grids and images of CuNPs in ethanol and following 24 h of incubation in EMEM culture medium were collected. Morphology and size distribution of CuNPs were analysed by ImageJ (National Institutes of Health, Bethesda, MD, USA). Size distribution analysis was only performed when individual well-defined NPs could be determined.
Actual exposure concentrations and copper ion release
The actual exposure concentrations of copper suspensions (including both CuNPs, MPs suspensions and Cu(NO3)2 solution, five concentrations) were prepared freshly and measured using ICP-MS with a quadrupole-based instrument (Thermo X-Series II – Thermo Scientific, Bremen, Germany). Many studies report the release of metal ions as a contributing factor to the toxicity of NPs (Jiang et al. Citation2009, Wang et al. Citation2009), therefore the ion release from all copper suspensions (200 µg/ml) in the four different culture media under four culture conditions were quantified using ICP-MS (Supplementary 3). One ml CuNPs suspensions were sampled at time 0, 24 and 48 h after incubation and centrifuged at 13,362 g for 20 min, at 4°C (5415 R series centrifuge, Eppendorf, Germany) to remove CuNPs from suspensions (Fernández-Cruz et al. Citation2012). The supernatants were analysed using DLS to confirm that all CuNPs were removed. The supernatants were then analysed using ICP-MS. Copper ion release (%) was calculated as percentage of the total copper concentration.
Cell cultures
Four liver cell lines were used in this study, two mammalian in origin; a rat hepatoma (H4IIE) and a human hepatocellular carcinoma (HepG2) and two from fish; the topminnow fish (Poeciliopsis lucida) hepatocellular carcinoma (PLHC-1) and rainbow trout (Oncorhynchus mykiss) hepatoma (RTH-149). All cell lines were obtained from the American Type Culture Collection (ATTC) (Manassas, VA, USA). According to the cell type, the EMEM culture media was supplemented with necessary components for optimum cell growth (Supplementary 1). H4IIE and HepG2 were cultured at 37°C, PLHC-1 and RTH-149 were cultured at 30 and 20°C, respectively. A 5% CO2 atmosphere was applied to all culture conditions. The media was changed every 48 h and cells were split one to two times per week using 0.5% trypsin/0.02% EDTA.
Cell exposure
Due to different growth rates and morphologies, cells were seeded in 96-well plates (Greiner-Bio one, CellStar, Spain) with different densities (2.5 × 10⁴ cells/well for H4IIE, 7.5 × 10⁴ for HepG2 and 5 × 10⁴ for RTH-149 and PLHC-1) in 100 μl culture media per well under each culture condition, respectively. After 24 h, the culture media was removed and the cells were washed with phosphate buffer saline (PBS). Cells were exposed to all copper suspensions and the Cu(NO3)2 using the nominal concentration range of 12.5–200 µg/ml immediately following 10 min water bath sonication. A cell free 96-well plate with the same generated nominal concentration range was also prepared for each culture media and used to measure copper concentration by ICP-MS to determine the actual exposure concentrations.
Toxicity evaluation
Cytotoxicity
The assay based on the ability of mitochondrial oxidoreductases to reduce the indicator dye resazurin (7-hydroxy-3H-phenoxazin-3-one-10 oxide) to resorufin has been used (O’Brien et al. Citation2000). After 24 h exposure under relevant incubation conditions, the medium was removed and the cells were washed once with PBS; 100 μl culture media together with 5 μl of resazurin dye was added to the wells. Fluorescence intensity (532 nm excitation and 595 nm emission) was quantified on a GENios microplate reader (Tecan, Männendorf, Switzerland) after 2 h incubation. Potential interference of all copper suspensions with the fluorescence of the indicator dyes was checked by preparing a plate with corresponding concentration ranges as exposures (12.5–200 µg/ml) but without cells and quantifying the fluorescence intensity of wells after 2 h. Cellular toxicity (%) was calculated as the decrease in fluorescence intensity and expressed as a percentage of control.
Oxidative stress
Intracellular ROS production was determined using the fluorescent probe DCFH-DA. The probe was prepared in phenol-red free, serum free MEM media (100 µM) under dark conditions just prior to carrying out the assay. Culture media was removed from the exposed cells following the exposure timeframe (24 h) and cells were washed with PBS. The DCFH-DA probe was loaded to the wells, dark conditions were maintained and the plates were incubated under culture conditions for 30 min. Following the 30 min period cells were washed twice with PBS to remove any extracellular probe. Cells were then reconstituted with phenol-red free, serum free MEM media. Fluorescence (485 nm excitation and 530 nm emission) was measured on a GENios microplate reader immediately upon reconstitution and then 60 min after incubation under respective culture conditions. Potential interferences of copper suspensions with the fluorescence of the probe were checked by preparing a sample plate of copper suspensions without cells and quantifying the fluorescence intensity of wells after 60 min. Oxidative stress (%) was calculated as the percentage of fluorescence increase over 60 min.
Data analysis and statistics
Statistics
All exposures were performed in triplicate, with the mean ± standard deviation of three independent tests being represented in the final results. The data were analysed by one-way ANOVA followed by Dunnett's post hoc-test (treatment vs. control) in SigmaPlot® 12.0 (Systat Software Inc., Chicago, IL, USA ). The normality and homoscedasticity of all data was checked prior to carrying out statistical analysis.
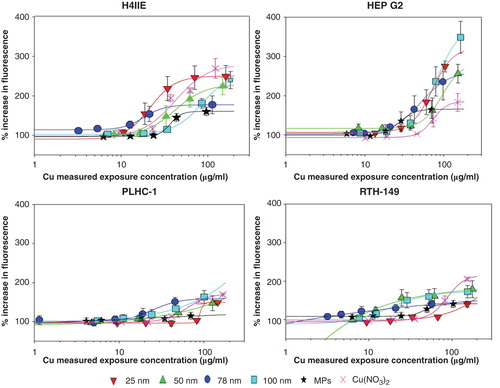
The calculation of the IC50 (concentration causing a 50% of inhibition with respect to the controls) caused by copper suspensions and by Cu(NO3)2 (resazurin assay) was performed by SPSS 16.0 using the function of the Probit regression (IBM SPSS, Armonk, NY, USA). The statistical significances (p < 0.05) were compared among different particles and among different cell lines using TTest2 (Matlab, MathWorks, Natick, MA, USA), respectively. The results are listed in Supplementary 6. The dose–response curves of oxidative stress production (exposure concentration range: 12.5–200 µg/ml) were plotted in . The increase of ROS production (%) caused by 50 and 80 µg/ml (measured exposure concentration) of each copper suspension was calculated from the fitted curve in order to further compare the different responses among cell lines. These values were then used for pairwise comparisons to detect significant differences in the abilities of the different sized NPs to increase ROS production. Multiple comparisons among groups were carried out using a one-way ANOVA followed by a Holm-Sidak method (p < 0.05). This allowed determining any size-dependent differences in toxicity as well as providing a statistical way for species-dependent sensitivity analysis.
Figure 1. Intracellular ROS levels in the four cell lines following 24 h exposure to the different copper suspensions and Cu(NO3)2. ROS levels are quantified by measuring the % of increase in fluorescence with respect to the control (100%). Results are expressed as means ± standard error of the mean. Standard curves are presented using a four parameter logistic function to fit the data to a sigmoidal curve.
Toxic contribution of the particle form of CuNPs and Cu2+
Both the Cu2+ and the particle form of CuNPs contribute to the toxicity of copper suspensions in living cell lines. The toxicity of Cu2+ in copper suspensions can be determined by the concentration–response curve of Cu(NO3)2. The actual concentrations of Cu2+ released by CuNPs (200 µg/ml) have been measured by ICP-MS (see Actual exposure concentrations and copper ion release section). When calculating the contribution of Cu2+ and CuNPs to the overall toxicity of the suspensions, it was assumed that the release of copper ions is independent of the concentration of CuNPs. Subsequently, the toxicity of Cu2+ (ECu 2+) in the copper suspensions could be determined according to the concentration–response curve of Cu(NO3)2. Furthermore, it is assumed that there are no interactions between Cu2+ and CuNPs.
The total toxicity of copper suspensions was assessed experimentally. Therefore, the toxic effect of the particle form of the CuNPs (ECuNPs) can be estimated using the response addition model (Backhaus et al. Citation2000):
Where Etotal represents the total cell toxicity caused by the copper suspensions. ECuNPs and ECu 2+ represent the cell toxicity caused by the particle form of CuNPs and Cu2+, respectively.
The cellular toxicity (%) caused by copper suspensions was plotted as a function of the total copper concentration, together with the corresponding toxic contribution of the particle form of CuNPs and Cu2+. The IC50 caused by copper suspensions and the IC50 caused by the particle form in each copper suspension were plotted together with the IC50 values caused by Cu(NO3)2. The IC20, IC50 and IC80 caused by the particle form of each suspension were calculated and listed together with the IC20, IC50 and IC80 of copper suspensions for comparison in the Supplementary 5.
Results
Physico-chemical characterisation of CuNPs
Transmission electron microscopy
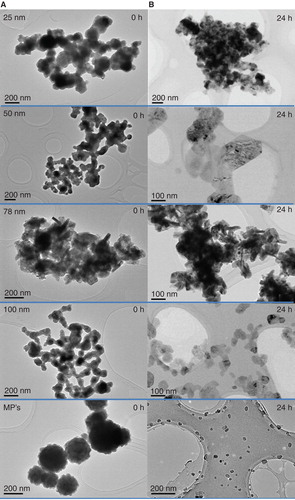
shows the TEM micrographs of the copper particles indicating the size, shape and distribution status in ethanol and after 24 h incubation in culture media. The results revealed that none of the CuNPs appear in the specified size according to the suppliers. The pristine CuNPs are present as aggregates and therefore it is very difficult to differentiate individual NPs to determine their size from TEM images except for the MPs. CuNPs of 25, 50 and 100 nm are spherical particles but are present in aggregates of irregular shape that appear conjoined. The 78 nm CuNPs interestingly appear to have rod-shaped nanostructures visible within aggregates. The MPs aggregates have a defined shape, distinctly spherical with a rough surface in nature. After 24 h incubation under culture conditions, 25, 50 and 100 nm CuNPs retain the aggregate status with a lighter appearance. The form of the 78 nm CuNPs after 24 h incubations was similar as the initial forms. The MPs retain their rough edged appearance with lighter appearances as well but the size decreased by a factor of 10 according to size distribution analysis from TEM images. The mean size at 0 h was 360.2 nm with more than 85% of the particles between 200 and 600 nm. However, after 24 h incubation in culture media, 90% of the MPs were smaller than 60 nm and the mean size decreased to 35 nm (Supplementary 4).
Figure 2. TEM images of copper particles (A) in their pristine form (prepared in ethanol) and (B) following 24 h incubation in EMEM culture medium under culture conditions (37°C/5% CO2). Scale bars indicate size (nm).
Dynamic light scattering
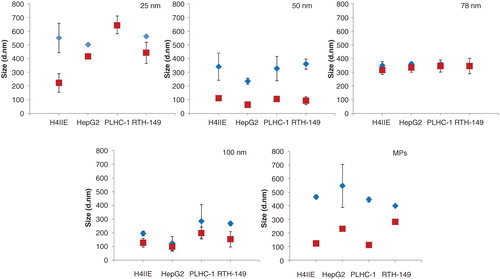
The hydrodynamic sizes of suspensions before and after 24 h incubation in the four culture media are presented in . The results illustrate that all the copper particles are present largely in aggregates with sizes 200–700 nm in diameter depending on the type of particles. Slight differences in sizes were measured in the different culture media, with no apparent trend or temperature/media compositions influencing factor seen. Following 24 h of incubation, the general trend was a decrease in the hydrodynamic diameters of the particles under each culture condition. The 78 nm CuNPs showed higher stability than all other particles under culture conditions, with similar sizes at 0 and 24 h after incubation, which is consistent with the TEM results. The DLS profiles of all the supernatants showed that there are no peaks except the media profiles, indicating no particles present in the supernatants after centrifugation and the measured copper concentration using ICP-MS in the supernatants were solely copper ions.
Figure 3. Size distributions of the copper particles measured by DLS directly after preparation (0 h) and after incubation (24 h) in four different culture media, designated H4IIE (37°C), HepG2 (37°C), PLHC-1 (30°C) and RTH-149 (20°C) according to the which cell line it is used for. Results are expressed as means ± standard deviation.
Actual exposure concentration and ion release
Measured concentrations of copper suspension versus nominal exposure concentrations are presented in . Measured concentrations are the mean of four measurements in different culture media. The measured copper concentrations in experimental media deviated from 23% to 55% from the desired nominal concentrations depending on the CuNPs. The 78 nm CuNPs and the MPs showed the largest deviations, possibly due to the difficulties encountered in their manipulation (partly due to visible adherence of the particles to the plastic). Therefore, all responses in toxicity assays are correlated with the measured concentrations in this study.
Table I. Nominal exposure concentration ranges vs. the measured concentration (ICP-MS) ranges expressed as mean ± standard deviation (µg Cu/ml of medium suspension).
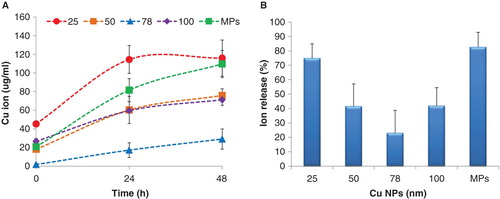
The ICP-MS results showed that there were no significant differences in measured ion release rates between the different media. Therefore, the mean of four measurements in different media and standard deviation (SD) are shown in . Ion release profiles were distinct for all CuNPs. The release of copper ions was time-dependent. At 0 h copper ions were present at low levels in particle suspensions of 200 µg/ml, with Cu2+ concentrations ranging from 2 ± 1 to 45 ± 3 µg/ml depending on the types of copper particles. The dissolution rate was very fast in the first 24 h, with the majority of ions being released in the culture media during this time period. The 78 nm CuNPs showed the lowest rate of dissolution among all suspensions. illustrates the percentage of ion release from CuNPs and the MPs calculated as a percentage of the measured total copper concentration. Only 23 ±15% of 78 nm CuNPs was present as dissolved Cu2+ after 24 h. The 50 and 100 nm CuNPs showed similar percentages of dissolution, approximately 41%. Approximately 70–80% of 25 nm CuNPs and the MPs were dissolved after 24 h. The ion release of all CuNPs slows down after 24 h. Only 3% and 11% of 25 and 78 nm suspensions, respectively, were released as ions during the later 24 h. The percentage of Cu2+ released by 50 and 100 nm CuNPs was very similar after 48 h (approximately 50%). However, about 98% of the MPs were dissolved after 48 h.
Figure 4. Copper ion release profiles for the copper suspension (a) over time and (b) the ion release after 24 h incubation, expressed as percentage of the total copper suspension concentration. Results are expressed as means ± standard deviation.
Toxicity evaluation
Cellular toxicity
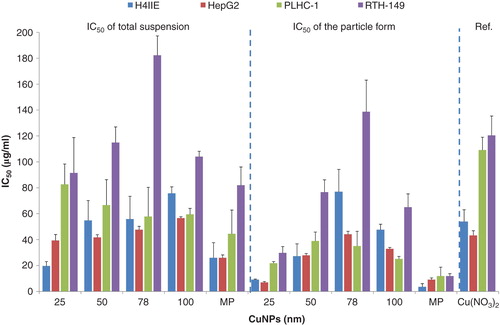
There was a clear dose–effect relationship after exposure of the different cell lines with the different copper suspensions. Values of the IC50 for each copper suspension and of the IC50 for each particle form in each suspension in different cell lines are plotted in . The IC50 of Cu(NO3)2 to each cell line was plotted as a reference in this figure. The corresponding significant statistical analyses between different particles and between different cell lines are shown in Supplementary 6. There is a strong contrast between the sensitivities of cell lines to copper suspensions. In general, the mammalian cell lines are more sensitive than the piscine cell lines, most strikingly in the case of exposure to Cu(NO3)2 and 25 nm CuNPs. The lowest IC50 was seen following exposure to 25 nm in the H4IIE cell line. Exposure to the MPs induced a lower IC50 value in both the mammalian cell lines and the piscine cell lines as compared with the CuNPs. The piscine cell line RTH-149 shows the highest resistance to all copper suspensions and Cu(NO3)2. The lowest IC50 was 74 ± 14 µg/ml when RTH-149 was exposed to the MPs.
Figure 5. The IC50 caused by each copper suspension and the IC50 caused by the particle form in each copper suspensions to mammalian (H4IIE, HepG2) and piscine cell lines (PLHC-1 and RTH-149). The IC50 of Cu(NO3)2 for four types of cell lines is shown separately. Results are expressed as means ± standard deviation.
Toxic contribution of the particle form of CuNPs and Cu2+
The IC50 of the particle form in each suspension in different cell lines was much lower than the IC50 of the Cu2+ ions, except when H4IIE was exposed to the 78 nm CuNP (). The IC50 of the particle form of 78 nm CuNPs is 77 ± 17 µg/ml for the H4IIE cell line, whereas the IC50 of the Cu2+ is 54 ± 9 µg/ml for H4IIE cells; 25 nm CuNPs and the MPs were the most toxic particles to all cell lines. The lowest value of the IC50 4 ± 3 µg/ml was found when H4IIE was exposed to MPs, and the second lowest value of IC50 was 7 ± 1 µg/ml when HepG2 cells were exposed to 25 nm CuNPs. RTH-149 shows the highest resistance to all copper particles.
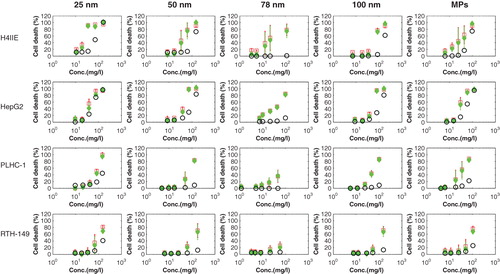
The cellular toxicity(%) caused by copper suspensions is plotted against the total copper concentration (measured values) in , together with the corresponding toxic contribution of the particle form of CuNPs and Cu2+, respectively. The particle form of CuNPs significantly contributed to the toxicity of the copper suspensions in all four cell lines. However, the toxic contribution of Cu2+ and of the particle form of CuNPs is dependent on the type of CuNPs and cell lines. The IC50 of Cu2+ in Cu(NO3)2 in mammalian cell lines (54 ± 9 µg/ml for H4IIE and 43 ± 4 µg/ml for HepG2) was about half of the value found for piscine cell lines (109 ± 10 µg/ml for PLHC-1 and 120 ± 15 µg/ml for RTH-149). Cu2+ only significantly contributed to the total toxicity in the H4IIE and HepG2 cell lines exposed to 25, 50, 100 nm CuNPs and the MPs as shown in . Cu2+ exhibited little toxicity to the total toxicity when H4IIE and HepG2 exposed to 78 nm CuNPs, because of the low levels of Cu2+ in the 78 nm suspensions. The piscine cell lines showed a high resistance to Cu2+ in all cases.
Figure 6. The total cellular toxicity (%) caused by copper suspensions (red, square), and the cellular toxicity (%) caused by particle forms of each copper suspension (CuNPs) (green, solid diamond) and Cu2+ (blue, circle) plotted against the total copper concentrations, respectively. Results are expressed as means ± standard deviation.
The IC20, IC50 and IC80 of Cu(NO3)2, of the copper suspensions and of the particle form in each copper suspension when exposed to each cell line are given in Supplementary 5. The particle form of CuNPs can cause 20% of cellular toxicity at much lower concentration compared with Cu(NO3)2 in most of cases (Supplementary 5). For instance, the particle form of the 25 nm CuNPs and of the MPs can cause 20% cellular toxicity at 6 ± 2 and 4 ± 0 µg/ml to HepG2 cell lines, respectively. But the IC20 of Cu(NO3) is 18 ± 2 µg/ml to HepG2 cell lines, which is three times higher (less toxic) than the IC20 of the particle form of the 25 nm CuNPs and the MPs.
ROS levels
The ability of copper suspensions and Cu(NO3)2 to elicit the generation of intracellular ROS was also investigated. Curves representing the response of each cell line to all copper particles and Cu(NO3)2 are compared in . The ability of CuNPs to increase intracellular ROS levels is concentration and cell type dependent. The corresponding responses to two different concentrations (50 and 80 µg/ml) are extrapolated from the fitted curves to compare the different responses of different cell lines (Supplementary 7). Although no differences in ROS generation were detected among cell lines after exposure to low concentrations, at the highest concentrations the mammalian cell lines (H4IIE and HepG2) exhibited a higher sensitivity to CuNPs than the piscine cell lines used in this study. Mammalian cell line H4IIE responses are significantly different (p < 0.01) from both piscine responses upon exposure to the 25 nm CuNPs and Cu(NO3)2. The 25 nm CuNPs elicit the highest increase in ROS levels in H4IIE compared with all other suspensions, even above those elicited by Cu(NO3)2. However, there is no significant difference of ROS response among cell line when exposed to other CuNPs. Furthermore, the difference of ROS generation among CuNPs in same cell lines is not apparent. The results showed that only the ROS response of 25 nm in H4IIE is significantly different (p < 0.05) from the response to the 100 nm CuNPs for the 50 µg/ml dose. And only the 78 nm CuNPs elicits an increased response significantly different (p < 0.05) from the 25 nm NP and the MPs in the PLHC-1 cell line for the 80 µg/ml.
Discussion
Behaviour of NPs in culture media
It was found that all tested CuNPs aggregated immediately in the culture media. All CuNPs and the MPs underwent dissolution releasing copper ions under exposure conditions, however to different extents depending on the type of CuNPs. The increase in dissolution rates over time is consistent with the fact that the hydrodynamic sizes of CuNPs in culture media decreased after 24 h, as shown by the DLS and TEM measurements. This suggests that the decrease in size of the CuNPs is due to dissolution. The net surface area may be a dominating factor affecting ion release of CuNPs. The smaller the NPs, the larger the net surface area. The large dissolution rate of 25 nm CuNPs could be explained by the largest net surface area. The rough surface of MPs causes fast decomposition of MPs. Therefore, the size of MPs decreases sharply as the net surface area and ion release rate of MPs increases dramatically. Much lower Cu2+ ion levels and constant morphologies were detected before and after 24 h incubations of 78 nm CuNPs which may be due to the 78 nm CuNPs being rod-shaped according to the TEM observation. The net surface area of rod-shaped particles is much smaller compared with the same amount of spherical CuNPs according to mathematic calculation. Therefore, the rod shape of 78 nm CuNPs has much lower dissolution compared with other CuNPs.
Although (Liu and Hurt Citation2010) reported that the ion release rates of silver NPs can increase with temperature in the range 0−37°C, no clear relationship was found between the rate of ion release, temperature (20, 30 and 37°C) and the original size of the CuNPs in this study (). The ionic strengths of the culture media for all cell lines are expected to be quite similar (Supplementary 1). It is also difficult to conclude if the ion strength of the culture media has clear impact on Cu2+ ion release from . Further studies are needed to investigate the effect of temperature and different compositions of culture mediums on aggregation size and the rate of ion release of CuNPs.
Physical properties and toxicities of CuNPs suspensions
The toxicity of CuNPs suspensions (except MPs) in mammalian cell lines increased with a decrease of the nominal size of the particles (, left part). The toxicity of CuNPs showed the same trend in RTH-149 when the nominal particle size of the particle is less than 100 nm. If we only consider the IC50 caused by the particle form of 25, 50, 78 nm CuNPs suspensions, then the toxicity of CuNPs increased with the decrease of nominal particle size in H4IIE, HepG2 and RTH-149 cell lines (, middle part). Therefore, the original size could be one of parameters which affect the toxicity of CuNPs suspensions. However, the particles were present as big aggregates in the culture media and all particles went through dissolution processes. Whereas also the shape of the particles was different (78 nm CuNPs is rod, the rest of CuNPs is spherical). Furthermore, there is no significant difference of toxicities between different copper suspensions in PLHC-1 cell lines (Supplementary 6). No correlation could be established between the initial size of aggregates or the aggregates after dissolution and the toxicity of CuNPs suspensions. Therefore, the size of particle matters, but size is not the only dominant factor regarding the toxicity of CuNPs.
Both the particle form of CuNPs and Cu2+ are responsible for the adverse effects observed for the copper suspensions (). However, the particle form of CuNPs was the dominant source of toxicity of copper suspensions in all cases. Cu2+ only contributed significantly when mammalian cell lines exposed to 25, 50, 100 nm CuNPs and the MPs. The IC50(particle) found for the particle form of 25 nm CuNPs and the MPs was extremely low due to the large surface area of the particles before (25 nm) and especially after dissolution. The high surface reactivity of CuNPs can cause oxidative stress via the Fenton reaction or induce mitochondrial depolarisation of cells (Karlsson et al. Citation2009). The high ion concentrations also caused severe damage to all cells. Therefore, the total toxicities were quite high in both cases. All copper suspensions and Cu(NO3)2 can generate a high level of ROS following 24 h exposure, indicating that ROS may be the potential mechanism causing cell toxicity in both cases. In addition, all copper suspensions generated higher ROS levels than Cu(NO3)2 in HepG2 and some CuNPs also produced higher ROS levels than Cu(NO3)2 in the other cell lines. These results indicate that the particle form of CuNPs also plays an important role in ROS production to cells in all suspensions.
Morphology of CuNPs is one of the important properties affecting their toxicity. Compared with spherical CuNPs, the rod particle form of CuNPs (78 nm) expressed quite low toxicity to H4IIE and HepG2 cell lines. Rod-shaped particles have a smaller surface area as compared with the same quantity of spherical-shaped particles according to the mathematic calculation. Therefore, the lower toxicity of the rod particle form of 78 nm CuNPs can be explained by the low reactivity of the surface area of the rod-shaped particles. In addition, there is evidence that spherical NPs are easier to be taken up by H4IIE cells than rod-shaped NPs (Arnida et al. Citation2010). Singh et al. (Citation2007) reported that the spherical shape of CuNPs facilitates physical interaction with cells, allowing them to be more efficiently attached to the surface of cells and be taken up more efficiently through endocytosis, specifically pinocytosis processes.
Species-specific toxicity of CuNPs suspensions
The uptake and toxicities of CuNPs were associated with the properties of the cells. The RTH-149 cell lines have higher resistance to toxicity of copper suspensions compared with mammalian cell lines and PLHC cell lines in general. The ROS generation in piscine cell lines was lower than the ROS generation in mammalian cell lines. Particularly, the IC50 of 25 nm CuNPs suspensions and of Cu(NO3)2 in mammalian cell lines was two times lower than the IC50 of piscine cell lines, indicating the higher vulnerability of mammalian cell lines. The mammalian cells were susceptible to both the particle form of CuNPs and Cu2+ in the suspensions, but piscine cells seem to be only vulnerable to the particle form of CuNPs (). The particle form of CuNPs can induce severe damage to all cell lines, revealing the low resistance of all cell lines to CuNPs in particle forms. The different toxicities of copper ions to all tested cell lines were due to variations in biological properties and the responses of the four cell lines. Copper ions can be metabolised in hepatoma cells and be transferred in metallothionein by reduced glutathione (Chen et al. Citation2006). The overloading of copper ions leads to cellular toxicity. Cu2+ contributes significantly when exposed to mammalian cells but little effect was found on piscine cells indicating that piscine cells have greater abilities to metabolise and transport copper ions than mammalian cells. Therefore, species-specific cell features significantly affect the toxicity profile of copper suspensions.
The sizes and the shapes of different cells are different. The average diameter of HepG2 ranges from 1.5 to 3.5 µm and they normally grow in clusters because of the irregular cytoplasmic expansions and microvilli on the plasma membranes connecting them (Bouma et al. Citation1989). PLHC-1 cell lines have round shapes and these cells appear loosely organised and form monolayers of 4–8 µm thick in culture (Hightower & Renfro, Citation1988). H4IIE cells have the fastest growth rate compared with the rest of the cell lines and RTH-149 is the only one with fabric shapes, multiple nuclei and connecting filaments. All these factors can also affect the exposure, uptake and toxicity of CuNPs and Cu2+. Also the culture conditions of the cell lines are different, and the metabolism inside the cells may proceed slower at lower temperatures, all of which may affect the uptake of CuNPs and their level of toxicity. For instance, the higher resistance of the piscine cell lines and in particular of the RTH-149 cell line to the toxicity of copper suspensions compared with the other cell lines used could be related with the lower temperature of culture of the piscine cell lines, and in particular of RTH-149 cells. The properties of cells and the exposure conditions should therefore also be taken into account when discussing the toxicity of the CuNPs.
Conclusions
By investigating the behaviour and toxicity of CuNPs using four different cell lines, this study revealed that the toxicity of CuNPs cannot be simply linked with a single physico-chemical property of CuNPs. The decrease in particle size can be linked to the toxicity of CuNPs, but the morphologies of CuNPs and the species-specific vulnerabilities of cells also play important roles in evaluating the toxicity profile of CuNPs. The particle form of CuNPs highly contributes to the toxicity in all copper suspensions whereas copper ions only caused significant impacts on mammalian cell lines. More research should be carried out to investigate the mechanisms of uptake and toxicity of NPs in different species regarding the specific properties of cell lines, the contribution of particle and ion form of NPs as well as the exposure conditions. It is clear that the extrapolation of toxicities among species and different test concentrations needs to be handled carefully.
Declaration of interest
The authors declare that they have no conflict of interest.
Supplementary 7
Download MS Word (608.5 KB)Acknowledgements
L Song and M Connolly have contributed equally to this work. Both of them are sponsored by the Environmental ChemOinformatics Marie Curie Initial Training Network (ECO-ITN) within the seventh research framework programme of the European Union (238701). MG Vijver is supported via VENI grant (863.08.023) awarded by The Netherlands Organization for Scientific Research (NWO). Part of the work was performed within the framework of the RIVM sponsored project “IRAN” and the INIA project AT2011-0001.
References
- Arnida Malugin A, Ghandehari H. 2010. Cellular uptake and toxicity of gold nanoparticles in prostate cancer cells: a comparative study of rods and spheres. J Appl Toxicol 30:212–217.
- Backhaus T, Scholze M, Grimme LH. 2000. The single substance and mixture toxicity of quinolones to the bioluminescent bacterium Vibrio fischeri. Aquat Toxicol 49:49–61.
- Bouma ME, Rogier E, Verthier N, Labarre C, Feldmann G. 1989. Further cellular investigation of the human hepatoblastoma-derived cell line HepG2: morphology and immunocytochemical studies of hepatic-secreted proteins. In Vitro Cell Dev Biol 25:267–275.
- Chen Z, Meng H, Xing G, Chen C, Zhao Y, Jia G, et al. 2006. Acute toxicological effects of copper nanoparticles in vivo. Toxicol Lett 163:109–120.
- Cioffi N, Ditaranto N, Torsi L, Picca RA, Sabbatini L, Valentini A, et al. 2005. Analytical characterization of bioactive fluoropolymer ultra-thin coatings modified by copper nanoparticles. Anal Bioanal Chem 381:607–616.
- Connor EE, Mwamuka J, Gole A, Murphy CJ, Wyatt MD. 2005. Gold nanoparticles are taken up by human cells but do not cause acute cytotoxicity. Small 1:325–327.
- Fernández-Cruz ML, Lammel T, Connolly M, Conde E, Barrado AI, Derick S, et al. 2012. Comparative cytotoxicity induced by bulk and nanoparticulated ZnO in the fish and human hepatoma cell lines PLHC-1 and Hep G2. Nanotoxicology 0:1–18.
- George S, Pokhrel S, Xia T, Gilbert B, Ji Z, Schowalter M, et al. 2009. Use of a rapid cytotoxicity screening approach to engineer a safer zinc oxide nanoparticle through iron doping. ACS Nano 4:15–29.
- Guo K, Pan Q, Wang L, Fang S. 2002. Nano-scale copper-coated graphite as anode material for lithium-ion batteries. J Appl Electrochem 32:679–685.
- Hightower LE, Renfro JL. 1988. Recent applications of fish cell culture to biomedical research. J Exp Zool 248:290–302.
- Jiang W, Mashayekhi H, Xing B. 2009. Bacterial toxicity comparison between nano- and micro-scaled oxide particles. Environ Pollut 157:1619–1625.
- Karlsson HL, Cronholm P, Gustafsson J, Moller L. 2008. Copper oxide nanoparticles are highly toxic: a comparison between metal oxide nanoparticles and carbon nanotubes. Chem Res Toxicol 21:1726–1732.
- Karlsson HL, Gustafsson J, Cronholm P, Möller L. 2009. Size-dependent toxicity of metal oxide particles—A comparison between nano- and micrometer size. Toxicol Lett 188:112–118.
- Lee WM, An YJ, Yoon H, Kweon HS. 2008. Toxicity and bioavailability of copper nanoparticles to the terrestrial plants mung bean (Phaseolus radiatus) and wheat (Triticum aestivum): Plant agar test for water -insoluble nanoparticles. Environ Toxicol Chem 27:1915–1921.
- Lei R, Wu C, Yang B, Ma H, Shi C, Wang Q, et al. 2008. Integrated metabolomic analysis of the nano-sized copper particle-induced hepatotoxicity and nephrotoxicity in rats: a rapid in vivo screening method for nanotoxicity. Toxicol Appl Pharmacol 232:292–301.
- Liu G, Li X, Qin B, Xing D, Guo Y, Fan R. 2004. Investigation of the mending effect and mechanism of copper nano-particles on a tribologically stressed surface. Tribol Lett 17:961–966.
- Liu J, Hurt RH. 2010. Ion release kinetics and particle persistence in aqueous nano-silver colloids. Environ Sci Technol 44:2169–2175.
- O’Brien J, Wilson I, Orton T, Pognan F. 2000. Investigation of the Alamar Blue (resazurin) fluorescent dye for the assessment of mammalian cell cytotoxicity. Eur J Biochem 267:5421–5426.
- Patra HK, Banerjee S, Chaudhuri U, Lahiri P, Dasgupta AK. 2007. Cell selective response to gold nanoparticles. Nanomedicine 3:111–119.
- Prabhu BM, Ali SF, Murdock RC, Hussain SM, Srivatsan M. 2010. Copper nanoparticles exert size and concentration dependent toxicity on somatosensory neurons of rat. Nanotoxicology 4:150–160.
- Singh S, Shi T, Duffin R, Albrecht C, Van Berlo D, Höhr D, et al. 2007. Endocytosis, oxidative stress and IL-8 expression in human lung epithelial cells upon treatment with fine and ultrafine TiO2: Role of the specific surface area and of surface methylation of the particles. Toxicol Appl Pharmacol 222:141–151.
- Tao TY, Gitlin JD. 2003. Hepatic copper metabolism: insights from genetic disease. Hepatology 37:1241–1247.
- Wang H, Wick RL, Xing B. 2009. Toxicity of nanoparticulate and bulk ZnO, Al2O3 and TiO2 to the nematode Caenorhabditis elegans. Environ Pollut 157:1171–1177.