
Abstract
The lung provides the main route for nanomaterial exposure. Surfactant protein A (SP-A) is an important respiratory innate immune molecule with the ability to bind or opsonise pathogens to enhance phagocytic removal from the airways. We hypothesised that SP-A, like surfactant protein D, may interact with inhaled nanoparticulates, and that this interaction will be affected by nanoparticle (NP) surface characteristics. In this study, we characterise the interaction of SP-A with unmodified (U-PS) and amine-modified (A-PS) polystyrene particles of varying size and zeta potential using dynamic light scatter analysis. SP-A associated with both 100 nm U-PS and A-PS in a calcium-independent manner. SP-A induced significant calcium-dependent agglomeration of 100 nm U-PS NPs but resulted in calcium-independent inhibition of A-PS self agglomeration. SP-A enhanced uptake of 100 nm U-PS into macrophage-like RAW264.7 cells in a dose-dependent manner but in contrast inhibited A-PS uptake. Reduced association of A-PS particles in RAW264.7 cells following pre-incubation of SP-A was also observed with coherent anti-Stokes Raman spectroscopy. Consistent with these findings, alveolar macrophages (AMs) from SP-A−/− mice were more efficient at uptake of 100 nm A-PS compared with wild type C57Bl/6 macrophages. No difference in uptake was observed with 500 nm U-PS or A-PS particles. Pre-incubation with SP-A resulted in a significant decrease in uptake of 100 nm A-PS in macrophages isolated from both groups of mice. In contrast, increased uptake by AMs of U-PS was observed after pre-incubation with SP-A. Thus we have demonstrated that SP-A promotes uptake of non-toxic U-PS particles but inhibits the clearance of potentially toxic A-PS particles by blocking uptake into macrophages.
Introduction
The ability of nanotechnology to produce engineered nanoparticles (NPs) of various shapes and materials has opened up new applications in areas such as medicine, engineering, electronics, textiles and cosmetics. The number of consumer products containing NPs is rapidly increasing and is now counted in thousands (Nanotechnologies, Citation2014). This reflects the unique and diverse properties of nanomaterials, which can be very different from the bulk material due, in part, to their enhanced surface to mass ratio (Oberdörster et al., Citation2005a).
Exposure to nanomaterials is not a new phenomenon. Throughout evolution, humans have been exposed to nanosized particles from both biogenic and anthropogenic sources. However, human lung exposures have risen dramatically due to anthropogenic emission from diesel engines, power stations and engineering processes optimised for manufacturing nanoscale materials (Oberdörster et al., Citation2005b). Due to the small size of nanomaterials, they are often airborne and have the capability of reaching the alveolar compartment of the lungs (Oberdörster et al., Citation2002, Citation2005b). Once inside the airways, the NPs can be adsorbed onto the mucosal surface in the upper airways and into surfactant lining the lower airways. A nano-bio corona of biological molecules then forms on the NP surface, which can in turn influence the clearance, bioavailability and potential toxicity of the NPs (recently reviewed in Kendall & Holgate (Citation2012)).
Pulmonary surfactant is a multi-layered lipoprotein substance, comprising approximately 90% lipids and 10% protein, and lines the alveolar epithelium at the air liquid interface. Pulmonary surfactant performs two vital functions in the lung; reducing alveolar surface tension and protecting the lung from microbial infection (reviewed in Pérez-Gil (Citation2008)). Surfactant protein A (SP-A) and its sister protein surfactant protein D (SP-D) are both hydrophilic proteins found in surfactant belonging to the calcium-dependent (C-type) lectin sub-family known as “collectins” (collagenous lectins). Collectins are oligomeric proteins made up of trimeric units. The trimeric units are composed of three monomers, each with its own carbohydrate recognition domain (CRD) containing the lectin activity (Figure S1). The trimeric units are characterised by four structural domains: an amino terminus (where the oligomerisation between trimeric units take place), a collagenous domain, a neck region and the CRD region. Six of these trimeric units oligomerise to form octadecamers, the native form of SP-A (Figure S1). As SP-A has a bend in the collagenous region, the quaternary structure has been described as a “bunch of tulips” similar to the complement C1q molecule (Voss et al., Citation1988). Four trimeric units come together to form SP-D in the shape of a cross (Figure S1). SP-A is the most abundant of the two proteins with approximately 10 times more SP-A in surfactant than SP-D (Pastva et al., Citation2007). The pulmonary collectins, SP-A and SP-D, play an important role in the innate immune defence of the lung; they are pattern recognition molecules and are able to protect the lung from infection through a variety of mechanisms. They recognise and bind specific carbohydrate moieties on the surface of micro-organisms via the CRD and can facilitate microbial clearance through agglutination and opsonisation (reviewed in Pastva et al. (Citation2007)). They also promote uptake and clearance of dead and dying apoptotic cells in the airway and bind to cell-surface exposed and free DNA debris (Clark et al., Citation2002; Palaniyar et al., Citation2003). Both SP-A and SP-D rapidly promote microbial uptake into phagocytes and have anti-inflammatory effects by inhibiting cytokine and chemokine responses of phagocytes and lymphocytes after initial infection. Phagocytosis is believed to keep the phagocytosed material contained and the lung in an inflammation-free and quiescent state for optimal lung function (Brinker et al., Citation2003; Borron et al., Citation1996, Citation1998, Citation2000; Hansen et al., Citation2007). In vivo studies with mice deficient for SP-A (SP-A−/− mice) have shown that SP-A is important for the phagocytosis and clearance of both bacteria and viruses from the lung (LeVine et al., Citation1997, Citation1998, Citation1999a,Citationb, Citation2002; Li et al., Citation2002). Recent studies have suggested that SP-A and SP-D also play a role in the clearance of non-infectious particulate matter in the lung (Kendall et al., Citation2013; Ruge et al., Citation2011, Citation2012).
We have previously characterised the interaction of SP-D with various NPs including unmodified (U-PS) and amine (A-PS) surface-modified polystyrene particles (Kendall et al., Citation2013). SP-D co-localised to 200 nm A-PS NPs in A549 epithelium cells in vitro (Kendall et al., Citation2013). Furthermore, alveolar macrophages (AMs) from wild type (WT) C57Bl/6 mice showed enhanced uptake of both 100 nm and 500 nm U-PS and A-PS particles compared with AMs isolated from mice deficient in SP-D (SP-D−/− mice) (Kendall et al., Citation2013). Addition of exogenous SP-D to AMs from SP-D−/− mice enhanced the percentage of AMs taking up 100 nm A-PS (Kendall et al., Citation2013). Both SP-A and SP-D have been found to bind to carbon nanotubes (Salvador-Morales et al., Citation2007). The binding was calcium-dependent and was variable between batches of nanotubes indicating that the binding was mediated by surface impurities or chemical modifications of the nanotubes (Salvador-Morales et al., Citation2007). Differential interaction of SP-A was also observed with metal oxide NPs, including titanium oxide and cerium oxide particles, where differences were seen with different surface-modified particles derived from the same bulk-material highlighting the importance of the particle size, surface charge and chemistry (Schulze et al., Citation2011). SP-A has also been found to bind to certain surface-modified magnetic NPs (Ruge et al., Citation2011). It was shown that SP-A specifically interacted with magnetic NPs modified with starch, carboxymethyldextran, chitosan, poly-maleic-oleic acid and phosphatidylcholine compared with bovine serum albumin (BSA) (Ruge et al., Citation2011). SP-A also enhanced the association of the surface-modified magnetic particles to AMs, except for starch, when compared with BSA. Furthermore, SP-A increased the uptake of phosphatidylcholine NPs into AMs, whereas the presence of BSA resulted in a decrease in particles taken up by the cells (Ruge et al., Citation2011). SP-A was also found to facilitate the uptake of aggregated NP-sized tacrolimus complexes (an immunosuppressive agent) into human macrophage-like U937 cells.
In this study, we characterise the interaction of SP-A with polystyrene NPs with well-defined different surface characteristics and size. As in previous studies with SP-D, we focused on U-PS and A-PS at 100, 200 and 500 nm. We characterised the effect of SP-A on uptake of NPs in the murine macrophage cell line, RAW264.7, before extending the results into primary AMs isolated from SP-A-deficient mice and C57Bl/6 wild type control mice. The effects of interaction of SP-A and NPs are distinct from our previous report for SP-D.
Materials and methods
Nanoparticles
Polystyrene particles with and without surface modification with sizes of 100 nm, 200 nm and 500 nm were purchased (Polysciences Inc, Northampton, UK or Sigma-Aldrich, Dorset, UK). The particles were unmodified polystyrene (U-PS), amine-modified polystyrene (A-PS) and carboxylate-modified polystyrene (C-PS). Fluorescent green 100 nm U-PS and fluorescent orange 100 nm A-PS were purchased from Polysciences and Sigma-Aldrich, respectively.
SP-A purification
Human bronchoalveolar lavage (BAL) was obtained from patients with written informed consent undergoing lung washings for therapeutic purposes including pulmonary alveolar proteinosis. The procedure was approved by the London National Health Service Research Ethics Committee (NRES reference 10/H0504/9). Native human SP-A was purified from the SP-A-rich BAL pellet either by gel chromatography or butanol extraction as described previously (Suwabe et al., Citation1996; Wright et al., Citation1987). The purity of SP-A was verified by sodium dodecyl sulphate polyacrylamide gel electrophoresis (SDS-PAGE), Western blotting and N-terminal sequencing. The purified SP-A protein was diluted with nanopure water or Tris-buffered saline (TBS) with 2–5 mM calcium before mixing with particles.
Characterisation of the NP and SP-A interaction by dynamic light scatter analysis and zeta potential
The interaction between SP-A and NPs was characterised by dynamic light scatter (DLS; HPPS and Zetasizer Nano ZS, Malvern Instruments, Worcestershire, UK) and zeta potential (ZP; Zetasizer Nano ZS, Malvern Instruments). This was initially performed in nano pure water as described previously (Kendall et al., Citation2013). The DLS and ZP analyses were also performed in TBS and serum-free (SF) RPMI-1640 medium without phenol red (Gibco, Life Technologies, UK). In these experiments, A-PS or U-PS particles were suspended in TBS with 5 mM calcium at a concentration of 12.5 cm2/mL. These particles were diluted with equal volumes of protein (SP-A or BSA) suspended in TBS + calcium at 50 µg/mL. The size and ZPs of these suspensions were measured immediately before (T-2) and after (T0) the addition of protein. The particle suspensions were then incubated at 37 °C for 48 min, the size and ZP were then measured before (T48) and after (T60) the addition of SF RPMI. This yielded a TBS/RPMI ratio of 2:3 and final concentrations of proteins and particles of 10 µg/mL and 2.5 cm2/mL, respectively. The size and ZP of the suspensions were measured again following incubation for a further two hours at 37 °C (T180). All measurements were conducted at 37 °C using reusable or disposable capillary cells (Malvern Instruments).
RAW cells
RAW264.7 cells are a mouse macrophage-like cell line established from murine tumours induced with Abelson leukaemia virus (Raschke et al., Citation1978). Cells were routinely grown in RPMI-1640 (Gibco) supplemented with 1% L-glutamine (Gibco), 1% penicillin/streptomycin (Gibco) and 10% heat-inactivated foetal calf serum (Sigma-Aldrich) at 37 °C in a humidified atmosphere with 5% CO2. The semi-adherent cell line was routinely sub-cultured using a cell scraper every third day.
Uptake of unlabelled A-PS NPs
RAW264.7 cells were scrapped and plated in six-well plates on sterile cover slips with 500 000 cells/well. The cells were allowed to adhere for 24 hours, and then the cells were incubated with 5 µL of NPs (in general 1013 NPs/mL corresponding to 5 × 10¹⁰ NP/well) in a total volume of 1 mL SF RPMI medium for two hours. The cells were washed carefully with phosphate-buffered saline (PBS) twice and then fixed in 1% paraformaldehyde in PBS for one hour at room temperature. The cover slips, with attached cells, were mounted on a glass side upside down and the edges sealed with clear nail polish. The slides were then analysed using Coherent anti-Stokes Raman scattering (CARS).
Uptake of fluorescent A-PS and U-PS particles in RAW cells
Aliquots of 100 nm fluorescent orange A-PS or fluorescent green U-PS particles were mixed with SP-A in TBS containing 5 mM calcium to yield concentrations of 9.4 cm2/mL particles and 25 µg/mL proteins. Particle–protein suspensions were incubated for one hour at 37 °C in 96-well round bottom plates. RAW264.7 cells were washed three times in SF RPMI and dissociated from culture flasks using a cell scraper. Cells were suspended in SF RPMI at a concentration of 1.67 × 10⁶ cells/mL, and 30 μL aliquots were added to each well yielding a final particle concentration of 3.75 cm2/mL and a TBS/RPMI ratio of 2:3. The cells were incubated for one hour at 37 °C in a humidified atmosphere. The cells were washed once in 1 mL PBS and centrifuged at 400 g for 10 min to remove excess particles. The cells were resuspended in 40 μL PBS and kept on ice prior to analysis. Trypan blue was added to the cells immediately before the analysis of 5000 cells per sample using flow cytometry (BD FACSAria, BD Biosciences, Oxford, UK).
CARS analysis
CARS microscopy is a label-free chemical imaging technique, which generates contrast using molecular vibrations, which are specific to an individual molecule (Patel et al., Citation2013). A home-built CARS setup comprising of a Chameleon (Coherent) and Compact OPO (APE Berlin) coupled to an inverted Nikon Ti-U 2000 microscope (Nikon, Kingston upon Thames, UK) was used to acquire images. The beams were temporally overlapped using a delay stage and combined to form a spatially overlapped collinear beam. The pump beam was set to 835 nm, and the Stokes beam from the OPO was tuned to target the Raman frequency of 2850 cm–1 to target the CH2 stretching band. Due to the higher concentration of CH2 bonds in polystyrene beads and the fact that CARS has a quadratic dependence on the number of oscillators, the PS beads offer high contrast to enable qualitative and quantitative analysis. Amine-modification of the surface of a polystyrene bead will not affect the bulk of the –CH2 CARS signal (at 2850 cm−1) from the 200 and 500 nm beads used in this work and changes, if any, are well within the spectral resolution of the system.
A series of images was taken for every time point and each individual cell sample. Dwell times of 30 μs were usually chosen, and an area of 30 μm × 30 μm scanned at 1024 × 1024 pixels to generate a highly resolved image. Images were acquired with a 40 × (NA: 1.2) water-immersion objective (Nikon). Four images were acquired at random on cell areas on the glass coverslip for each separate treatment. In separate experiments to characterise the spatial (lateral) resolution of the CARS microscope, particles of various sizes (100–1000 nm) were imaged. It was found that 200 nm sized PS particles were resolvable and hence, the quantitative analysis based on CARS was carried out ≥200 nm particles. At the above target vibrational frequency of 2850 cm−1, the PS particles showed up as highly CARS-active areas, which were quantified using a code written in MATLAB (MathWorks, Cambridge, UK). The number of pixels with intensities exceeding a certain threshold (defined by the background) was counted. This area contributing to the signal is related directly to the number of NPs due to the nature of the CARS signal generation process (multiphoton and hence, inherently confined to the focal plane), and the images presented in this work are 2D rather than 3D projections/stacks. This number corresponding to the bright areas was compared with the overall cell area in pixels to obtain a ratio of NP over cell area.
Mouse BAL and isolation of AMs
Wild type (WT) C57Bl/6 mice and SP-A-deficient mice (SP-A−/−; Li et al., Citation2002), back-crossed at least 10 times onto the C57Bl/6 mouse background, were housed in specific pathogen-free housing at the Biomedical Research Facility at the University of Southampton. Mice received sterile rodent chow and water ad libitum with a 12-hour light and dark cycle. All animal procedures were approved by university local animal ethics committee and the Home Office, UK. The mice were sacrificed by CO2 asphyxiation prior to cannulation of the trachea with a fine bore cannula. The BAL was performed by instillation and withdrawal of 3 × 1 mL of PBS with 0.5 mM EDTA, which was subsequently pooled. Cells were pelleted by centrifugation at 300 g for 10 min. The cell pellet was re-suspended in SF RPMI. Differential cell counts on cytospin preparations after staining with Diff-Quick (Scientific Products, McGaw Park, IL) confirmed that more than 95% of the cells isolated this way were AMs.
AM uptake of fluorescent microspheres
The NPs used in the ex vivo experiments were either 100 nm or 500 nm U-PS (Sigma-Aldrich) or A-PS (Sigma-Aldrich) and were labelled with green fluorescent dye (fluorescein isothiocyanate (FITC), Sigma-Aldrich) dissolved in carbonate buffer (Sigma-Aldrich) at pH 9.6 at a concentration of 1 mg/mL. The FITC was then diluted 1:10 in nanopure water containing the NPs and incubated at room temperature for one hour with rotation. The NPs were centrifuged for 10 min at 20 937 g and washed twice with nanopure water. We have previously shown that the coupling of FITC to the NPs by this methodology only provides minimal leaching at pH 7.4 and 4.0, to mimic the conditions of the extracellular and endosomal environments, respectively (Kendall et al., Citation2013). AMs were isolated from C57Bl/6 and SP-A−/− mice as described above, the cells were washed and then incubated with NPs (1:5; 25 000 cells:125 000 NPs), after 5 min sonication, at 37 °C for 30 min. The cells were centrifuged at 300 g for 10 min and washed three times with RPMI (Gibco) to remove excess beads and re-suspended in cytofix (BD Biosciences) containing 0.2% trypan blue to quench extracellular fluorescence as previously described (Hartshorn et al., Citation1994). The fixed cells were then analysed by fluorescence-activated cell sorting (FACS).
The effects of SP-A on AM uptake of Fluorescent Microspheres
Fluorescent A-PS (Sigma-Aldrich) or U-PS 100 nm NPs (Polysciences) were used to determine the effects of exogenous SP-A on NP uptake in AMs isolated from C57Bl/6 wild type and SP-A−/− mice as described above. NPs were prepared as described in the section for the “Uptake of fluorescent A-PS and U-PS particles in RAW cells” and incubated for 90 min at 37 °C, 5% CO2; 17 000 AMs in colourless RPMI were added to the SP-A/NP preparation and incubated for a further 90 min at 37 °C, 5% CO2. Cells were then washed with PBS with 1% BSA and 5 mM EDTA (FACS buffer) and centrifuged at 400 g for 10 min to remove excess particles. The cells were then re-suspended in FACS buffer containing 0.2% trypan blue for FACS analysis.
FACS analysis
The FACS analysis was performed on a FACS Aria machine (BD Biosciences). Both forward and side-scatter threshold values were set to 200 to exclude free beads and cell debris from the analyses. Between 5000 and 10 000 cells were counted for each sample. The cells that contained beads (FL-1 > ∼50) were counted through gating and analysed using BD FACSDiva software, v4.3 (BD Biosciences).
Statistical analysis
Collected data were normal distributed, and the parametric unpaired t-test with the Holm–Sidak method was used for testing between two groups, and ANOVA (with Bonferroni post hoc test) was used to test results between multiple groups. Data were analysed using SPSS version 20 (IBM SPSS Statistics, Portsmouth, UK) or GraphPad Prism, version 6 (La Jolla, CA). Results were considered statistically significant when p < 0.05.
Results
We have previously measured the size distributions and ZP of a range of similarly sized polystyrene particles (A-PS, C-PS and U-PS), silicone particles (200 V and R816) and carbon black particles (CB400R) in water over time with the addition of purified human SP-D (Kendall et al., Citation2013). These results showed that SP-D interacted differently with these particles. In this study, we present the interaction of A-PS and U-PS particles with purified human SP-A.
The size distribution of purified human SP-A in water was measured by light intensity and number. The SP-A preparation was polydispersed with two peaks between 10 and 500 nm. A few macromolecules were also evident in this preparation with a small peak around 4500 nm. The majority of the human SP-A, measured by number of particles, showed a median of 30 nm in size (Figure S2). The ZP of SP-A alone in water was −11.8 mV.
In order to fully characterise the effect of SP-A on particle size and ZP, these measurements were taken in nanopure water and the media used for cell experiments (i.e. TBS/RPMI). First, we examined the hydrodynamic size and ZPs of A-PS and U-PS particles in nanopure water without calcium with and without the addition of SP-A (Table S1). In nanopure water, A-PS particles had a strong positive (+60 mV) ZP, which became negative with the addition of SP-A (−22.8 mV). U-PS particles had a ZP of −38.5 mV, which moved closer to zero following the addition of SP-A (−18.7 mV). The z average increased for both A-PS (49.1%) and U-PS (14.3%) particles when incubated with SP-A for 1440 min (Table S1).
The extent of the increase in the z average for 100 nm U-PS particles when incubated with SP-A for 24 hours is indicative of the formation of a protein corona rather than particle agglomeration. Calcium is essential for the lectin activity of SP-A as the ion is involved in the coordination of several of the amino acid residues involved in binding to carbohydrates (Head et al., Citation2003). We therefore investigated the effect of calcium concentration on the agglomeration rate of 100 nm U-PS particles within a range of 0–2 mM to elucidate if the CRD in SP-A could be involved in agglomeration. The results showed that the agglomeration rate of U-PS depended on the calcium concentration with the addition of 2 mM of calcium required for SP-A-mediated agglomeration to occur (Figure S3B). When the calcium concentration was 1 mM or lower, agglomeration of U-PS particles in the presence of SP-A was not observed. In the presence of 2 mM calcium, SP-A agglomerated the U-PS particles within 10 min, and the agglomerates increased in size over time (Figure S3C). Based on these results, a minimum concentration of 2 mM CaCl2 was used in the following experiments.
In order to maintain the calcium concentration above 2 mM at all stages of the in vitro cellular experiments, the particles were pre-incubated with SP-A in TBS containing 5 mM calcium before the addition of cells suspended in SF RPMI media. The proportion of TBS to RPMI used in the experiments (2:3) was pre-determined not to cause precipitation of calcium – which occurred following the addition of 2 mM calcium directly to RPMI. The size and ZPs were measured in TBS or TBS/RPMI at various time points (T-2 to T180). These results are listed in and and . The time points chosen reflect the incubation periods for the in vitro cellular experiments. Size and ZP were measured in TBS + Ca immediately before (T-2) and after (T0) the addition of protein. The particle–protein suspensions were incubated at 37 °C and the size distributions and ZP measured before (T48) and after (T60) the addition of RPMI. This incubation period reflected the pre-incubation of particles and proteins before the addition of cells. The particle suspensions were incubated again for a further two hours to reflect the incubation period with the cells (T180).
Figure 1. Dynamic light scattering analysis of the size distributions of 100 nm A-PS and U-PS particles in TBS/RPMI. Size distributions of 100 nm A-PS (A and B) and 100 nm U-PS (C and D) nanoparticles in TBS-RPMI; 12.5 cm2/mL of particles in TBS with 5 mM Ca2+ were mixed with 50 µg/mL BSA (▪) or 50 µg/mL SP-A (▴) or TBS only (•) for one hour before being mixed with RPMI (TBS:RPMI; 2:3) and their size distributions immediately measured at 37 °C (A and C, T60) and again two hours later (B and D, T180). The final protein concentration was 10 µg/mL, and nanoparticle concentrations were 2.5 cm2/mL. Size distributions of nanoparticles in TBS only at T-2 are shown as dashed line.
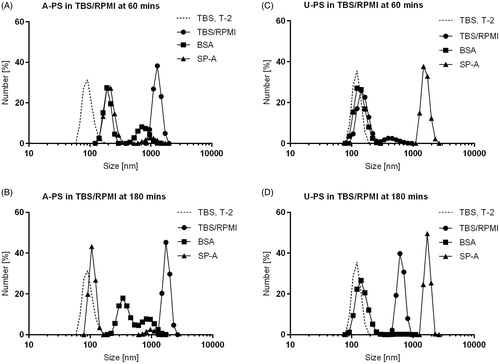
Figure 2. Effect of SP-A on A-PS and U-PS particle agglomeration. The effect of SP-A (10 µg/mL) in the presence and absence of calcium (2 mM) in PBS on the agglomeration of 100 nm fluorescent orange-labelled A-PS or 100 nm fluorescent green-labelled U-PS particles (3.8 cm2/mL) was evaluated using fluorescence microscopy. A-PS and U-PS particles were incubated with or without proteins for one hour at 37 °C before being mounted onto slides for microscopy. Pictures were taken at 400× magnification.
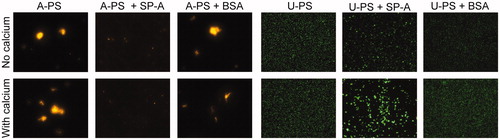
Table 1. Hydrodynamic size and zeta potential of A-PS and U-PS particles following incubation with SP-A or BSA.
Interestingly, the incubation of A-PS particles in TBS/RPMI (T60) resulted in the self agglomeration of the particles at physiological temperatures (i.e. 37 °C); pre-incubation with SP-A resulted in a reduction in the A-PS particle self agglomeration at this temperature. BSA also inhibited this self agglomeration ( and ). The particle size distributions show that SP-A reversed the self agglomeration of A-PS particles over time (). However, this did not seem to be the case when examining the Z-average of the particles (). This may be related to the high polydispersity of the samples and the presence of a few large agglomerates skewing the z average. The incubation of SP-A with U-PS particles for 60 min at 37 °C greatly enhanced the particle size (). The incubation of BSA with U-PS particles resulted in a slight increase in the size of the majority of particles and the generation of a small number of larger particle agglomerates around 500 nm in size. At T180 U-PS particles had begun to self agglomerate, a process which was inhibited in the presence of BSA. This was evident by examining both the z average and the size distribution by number. RPMI promoted the agglomeration of both particles (see ).
A-PS particles had a positive ZP in TBS with calcium, which reduced slightly over time at 37 °C. The addition of RPMI to the A-PS particles resulted in a negative ZP (). The addition of SP-A or BSA to the A-PS particles also resulted in negative ZPs (). The U-PS particle ZP became closer to zero over time and following the addition of RPMI (). The addition of SP-A or BSA had similar effects in making the U-PS ZPs closer to zero ().
Due to the large polydispersity indices for the DLS measurements and the differing results when comparing particle agglomeration kinetics, fluorescence microscopy was also used to examine NP agglomeration in buffered saline with or without calcium following incubation with SP-A or BSA. The micrographs show that the U-PS particles remained stable either in the presence or absence of calcium at physiological temperatures (). The incubation of U-PS particles with SP-A in the absence of calcium resulted in a small degree of particle agglomeration; however, this agglomeration was greatly enhanced in the presence of 2 mM calcium and SP-A (). In order to ascertain whether the effect was specific to SP-A, we performed the experiment with a similar concentration of BSA and observed no agglomeration with or without the presence of calcium (). A-PS particles self-agglomerated at physiological temperatures (i.e. 37 °C). This self-agglomeration was inhibited in the presence SP-A in a calcium-independent manner. However, large agglomerates were still evident when A-PS particles were incubated with BSA ().
The association of SP-A with A-PS and U-PS particles was also examined using SDS-PAGE analysis. Particles were incubated with SP-A for 24 hours at 37 °C in TBS containing calcium or EDTA. The particles were then centrifuged and washed twice in the appropriate buffer (i.e. TBS containing Ca or EDTA), and the pellet was examined using reduced SDS-PAGE. This allowed the determination of the hard (i.e. strongly bound) SP-A corona. SP-A strongly associated to U-PS particles and the association independent of calcium. SP-A was found not to strongly associate with the A-PS particles whether in the presence of calcium or EDTA (see Figure S4).
Toxicity of U-PS and A-PS NPs
In order to establish whether particle toxicity could influence cellular uptake of the particles, the effect of the NPs on cellular toxicity was investigated using the tetrazolium dye (MTT) colorimetric assay for cellular growth and viability. RAW264.7 cells were incubated with A-PS and U-PS particles in a range from 1 to 15 cm2/mL and were found not to be toxic to RAW264.7 cells at one hour (A-PS: p = 0.85 and U-PS: 0.82, Figure S5). Following 24 hours of incubation, the A-PS particles reduced cellular viability (p < 0.05 for concentrations ≥3.75 cm2/mL), whereas no effect was observed for the U-PS particles (p = 0.79, Figure S5). The results of the dose response at 24 hours were verified with a clonogenic assay, which showed significant toxicity of the A-PS particles from a concentration of ≥0.23 cm2/mL (p < 0.05, Figure S6) but not for the U-PS particles when compared with no NP particles present (p = 0.34, Figure S6).
A-PS particle association to macrophage-like RAW cells analysed by coherent anti-Stokes Raman spectroscopy
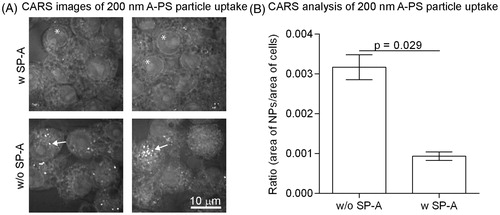
Imaging with coherent anti-Stokes Raman spectroscopy (CARS) was used to quantify the association of unlabelled A-PS particles to the murine macrophage-like RAW 264.7 cells. Some of the NPs were pre-incubated with SP-A (10 µg/mL) for an hour before incubating with the cells. Initial experiments showed that individual 100 nm NPs could not be resolved with enough specificity using this technique (data not shown). However, 200 nm A-PS particles were resolvable and therefore used in this study. The CARS analysis showed that SP-A inhibited the association of the A-PS NPs to the cells (). Quantification of the 200 nm A-PS particles compared with the area of the cells showed that SP-A significantly decreased the association of the A-PS NPs with the cells (p = 0.029, ).
Figure 3. The association of 200 nm unlabelled A-PS with (w) and without (w/o) SP-A to macrophage-like RAW264.7 cells visualised and quantified by CARS. (A) CARS images; 200 nm A-PS particles show up as white particles (arrows). Note that other –CH2-rich structures, such as the nuclear membrane, shows up as a visible ring in each cell (asterisks). (B) CARS images were analysed using MATLAB software as described in the materials and methods section. N = 4 per column. Shown is the mean ± standard derivation. p < 0.05 was considered statistically significant.
NP uptake into RAW cells and mouse AMs analysed by FACS
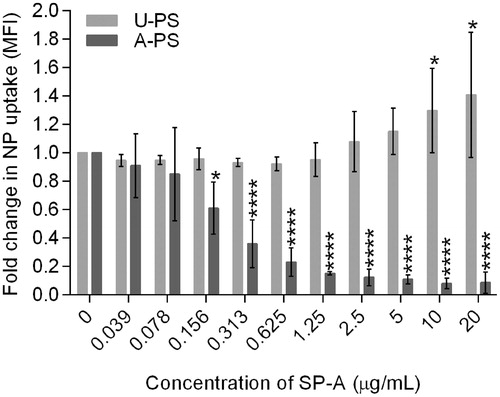
To examine the effect of SP-A interaction with 100 nm NPs specifically on cellular uptake, rather than just cellular association, we performed dose-response experiments using a two-fold serial dilution of SP-A from 20 to 0 µg/mL with 100 nm fluorescent U-PS or A-PS NPs using the macrophage-like cell line RAW264.7 in the presence of calcium (). Following NP treatment and directly before FACS analysis, the cells were treated with trypan blue, which quenches the fluorescent signal outside the cells (Hartshorn et al., Citation1994). SP-A significantly increased the uptake of U-PS into the RAW cells at concentrations of ≥10 µg/mL (p < 0.01 with SP-A ≥10 µg/mL), whereas the uptake of A-PS was significantly reduced in the presence of SP-A at concentrations of ≥0.156 µg/mL (p < 0.05 at SP-A ≥ 0.156 µg/mL) compared with the absence of SP-A (). BSA was used as a non-specific protein control at a concentration of 20 µg/mL for both types of particles. BSA caused non-significant increases in the uptake of both U-PS particles (3.8% increase, p = 0.44) and A-PS particles (9.1% increase, p = 0.19; data not shown).
Figure 4. The effect of exogenous SP-A on the uptake of 100 nm A-PS and U-PS particles in macrophage-like RAW264.7 cells. Two-fold serial dilution of SP-A was incubated with fluorescent 100 nm A-PS or U-PS particles (3.8 cm2/mL) in the presence of calcium before incubating with RAW cells. Extra cellular association of NPs with cells were quenched using trypan blue. The particle uptake was analysed using FACS. Shown are the mean ± standard derivation of four independent experiments. *p < 0.05 and ****p < 0.0001.
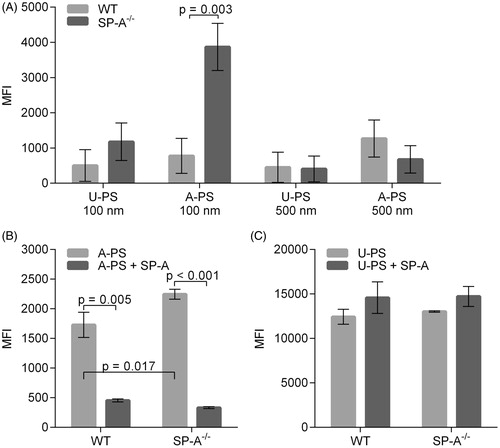
The effect of SP-A on the uptake of A-PS and U-PS in the AMs from wild type (WT) and SP-A knock-out mice (SP-A−/−) was also examined. An increase in the uptake of 100 nm A-PS particles in AM from SP-A−/− mice was observed when compared with AM isolated from WT mice (). No statistically significant difference was seen when the uptake of 100 nm U-PS particles was compared in AMs from SP-A−/− and WT mice (). Furthermore, no statistically significant difference was seen in the uptake of either 500 nm U-PS or A-PS particles in SP-A−/− and WT AMs (). This suggests there might be a dependency on both the size and surface chemistry of the SP-A inhibition observed for the 100 nm A-PS particles. We next investigated the effect of exogenous SP-A on the uptake of 100 nm U-PS and A-PS particles into AMs isolated from SP-A−/− and WT mice. The 100 nm particles were chosen for the SP-A add back experiments as no significant difference was observed in the uptake of either the 500 nm A-PS or 500 nm U-PS particles between WT and SP-A−/− mice. Consistent with the previous experiments, there was a significant increase in the uptake of 100 nm A-PS particles in SP-A−/− macrophages compared with WT macrophages (p < 0.002; ). The pre-incubation of exogenous SP-A with A-PS particles decreased the uptake by AMs from both groups of mice significantly compared to in the absence of SP-A (p < 0.001 for both mouse groups; ). An increase was seen in the uptake of 100 nm U-PS particles by the addition of SP-A to AMs isolated from both groups of mice, but this did not reach statistical significance (WT: p = 0.26 and SP-A−/−: p = 0.17; ).
Figure 5. Uptake of U-PS and A-PS and the effects of 10 µg/mL SP-A on the uptake by alveolar macrophages isolated from wild-type and SP-A−/− mice. (A) Uptake of FITC labelled 100 and 500 nm U-PS and A-PS particles (5:1 NP/cell) by AMs isolated from wild type mice (light grey) and SP-A−/− mice (dark grey). (B) Fluorescent orange-labelled 100 nm A-PS (3.8 cm2/mL) in the absence (light grey) of presence (dark grey) of SP-A with AMs from wild-type mice and SP-A−/− mice. (C) Fluorescent green-labelled 100 nm U-PS (3.8 cm2/mL) in the absence (light grey) or presence (dark grey) of SP-A with AMs from wild-type mice and SP-A−/− mice. The statistical analysis was determined using unpaired t-test as described in the materials and method section. p < 0.05 was considered statistical significant and significant values are shown in the figure. Data show relative mean fluorescence intensity (MFI) ± standard derivation derived from three () and two () independent experiments with n = 3 mice per experiment.
Discussion
We have previously characterised the interaction between SP-D and PS particles with different surface modifications (Kendall et al., Citation2013). This showed that SP-D differentially interacts with particles, modifying their uptake by AMs and lung-derived dendritic cells. The purpose of this study was to investigate whether SP-A showed differential interaction with PS NPs with different surface charge and if this interaction affected uptake of these NPs into macrophages in a similar or complementary way to SP-D.
NP characterisation
The size of SP-A in water remained stable at around 30 nm, which is consistent with the literature, where human SP-A has previously been measured by DLS to be 42 ± 6 nm (López-Sánchez et al., Citation2011) and electron micrographs of recombinant human SP-A being less than 50 nm in length (Voss et al., Citation1988).
The incubation of U-PS particles with SP-A or BSA resulted in the ZPs of the particle suspensions moving closer to zero. This shows that the addition of protein to the particle suspension results in a reduction in colloidal stability, a process which enhances the likelihood of particle agglomeration. This observation is similar to the findings by Ruge et al (Citation2011), where they observed that SP-A and BSA had similar effects when incubated with magnetite NPs with different surface charges. In this study, SP-A changed the ZP for A-PS particles from a positive to a negative charge when incubated in TBS with calcium (+24.4 to −7.4 mV) or nanopure water (+60 to −22.8 mV). This is also similar to the findings by Ruge et al. (Citation2011) when using particles with a positive ZP.
Protein coronas, which form around NPs, usually consist of an outer layer of loosely associated proteins termed the “soft” corona and an inner layer of strongly associated proteins called the “hard” corona (Barran-Berdon et al., Citation2013; Deng et al., Citation2012). Differences in particle agglomeration following incubation with SP-A may be linked to altered protein association with the particles. In particle association studies using SDS PAGE, we found that SP-A formed a hard corona around U-PS but not A-PS particles (Figure S4). The changes in the DLS and ZP measurements suggest that SP-A forms a soft corona around the A-PS particles. This shows that differences in the particle surface chemistry can influence the interaction of SP-A with the particles, which in turn may influence particle agglomeration and uptake. Furthermore, this study has shown that although SP-A-mediated agglomeration of U-PS particles depends on the presence of calcium, the association of SP-A with these particles is calcium independent. Although the ZP for both NPs bound by SP-A is around −20 mV in nanopure water and around −10 mV in TBS, the agglomeration kinetics are different. The U-PS particles agglomerated in the presence of SP-A, whereas disagglomeration occurred for A-PS particles. This again implies a differential SP-A-binding mechanism for these two types of particle. SP-A has been reported to self-agglomerate under certain conditions. Binding of SP-A to U-PS particles could facilitate conformational changes in SP-A that would enhance protein self-agglomeration or agglomeration of the U-PS particles. In the case of A-PS particles, the results indicate that the presence of the SP-A molecule at the particle surface may block the sites on the particle involved in self-agglomeration. SP-A would thereby inhibit A-PS self-agglomeration. The degree to which this is an SP-A-specific effect is unclear as BSA also inhibits A-PS agglomeration. Further work examining the particle agglomeration kinetics following SP-A incubation is necessary using techniques that allow the accurate quantification of particle size in highly polydispersed suspensions.
SP-A-mediated agglomeration of U-PS is dependent on calcium concentration
We found that a minimum concentration of 2 mM calcium was required for SP-A to agglomerate the 100 nm U-PS particles (Figure S3). This minimum calcium concentration is consistent with findings reported by Haagsman et al. (Citation1990) who observed that SP-A became saturated with calcium around a free calcium concentration of 2 mM. This also agrees with structural findings reported for the recombinant fragment of human SP-D, where this calcium concentration was thought to act like a molecular switch in the lectin-binding site (Shrive et al., Citation2003). These findings indicate that the CRD may be involved in the agglomeration of the U-PS particles. Calcium is required to stabilise the conformation of the lectin-binding domain (Head et al., Citation2003). By using the structure of trimeric fragment of rat SP-A and computer modelling, Head et al. (Citation2003) showed that the electrostatic surface of the CRD of the SP-A becomes less negatively charged when calcium is present in the CRD. The SP-A-induced agglomeration of NPs might not directly involve the actual lectin binding site in the CRD region, but the overall conformation or electrostatic surface charge induced by calcium could result in a differential interaction than that seen in the absence of calcium. We have previously shown that a recombinant fragment of SP-D, containing a trimeric unit of neck and CRD regions only (Figure S1), is enough to interact with the particles used in this study (Kendall et al., Citation2013). It therefore seems plausible to extend this finding to SP-A. SP-A would, by crosslinking individual particles via individual trimeric units, be able to agglomerate NPs. These results also show that SP-A has a different interaction with surface-modified NPs compared with native SP-D. SP-A inhibits the agglomeration of A-PS particles, whereas SP-D facilitates A-PS particle agglomeration. Both SP-A and SP-D agglomerated U-PS particles in the presence of calcium (summarised in ).
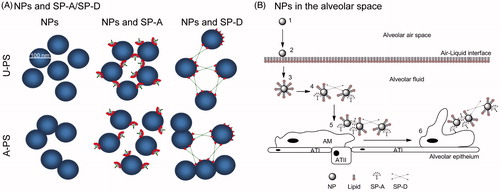
Figure 6. The role of collectins in agglomeration of NPs. (A) Differential interaction of SP-A, SP-D and rfhSP-D with 100 nm U-PS and A-PS particles. Both SP-A and SP-D agglomerates U-PS particles in the presence of calcium. A-PS particles tend to self-agglomerates at 37 °C but SP-A inhibits that by binding to the particles, whereas SP-D facilitates further agglomeration. The rfhSP-D binds to both A-PS and U-PS particles but does not facilitate agglomeration of the particles as seen with native SP-D (Kendall et al., Citation2013). The NPs, SP-A, SP-D and rfhSP-D are approximately to scale. (B) Simplistic model showing the roles of SP-A and SP-D and NP clearance in vivo in the alveolar space. Inhaled particles enter the alveolar space (1) and deposit onto the air-liquid interface of the alveolus (2). The particles are then displaced into the fluid phase through wetting forces, resulting in the formation of a lipid biocorona (3). The biocorona is then modified through the incorporation of surfactant proteins, potentially resulting in particle agglomeration dependent on the surface chemistry of the particle (4). Particle agglomerates are recognised by alveolar macrophages (5) and phagocytosed (6). ATI, alveolar epithelial type I cells; ATII, alveolar epithelial type II cells. Model not to scale.
NP toxicity
We show here that the used A-PS and U-PS particles were not toxic to the RAW 264.7 cells over short incubation periods such as those used in the in vitro cellular experiments (Figure S5 and S6). The observed difference between in the effect of SP-A on A-PS and U-PS particles is therefore not due to the toxicity of short-term exposure of the cells with the NPs. However, when extending the incubation period from 1 hour to 24 hours, the A-PS particles did show toxic effects on the cells, while no toxic effect was observed for the U-PS particles. This is consistent with previous reports where it was observed that A-PS, but not U-PS, particles had a toxic effect on the TT1 cell line, a human alveolar epithelial type I like cell line (Ruenraroengsak et al., Citation2012). This highlights the difference between the “high dose–short exposure” acute toxicity models often used in in vitro assays and real-life exposure scenarios where there is often low concentration of NPs but a long/chronic exposure period.
SP-A promotes or inhibits cellular uptake of NPs depending on the surface chemistry and size of particle
Macrophage-like RAW264.7 cells were used to investigate the interactions of SP-A with NPs on phagocytic NP uptake. We found that SP-A enhanced the uptake of U-PS particles in a dose-dependent manner, but inhibited the uptake of A-PS particles. To investigate this further, we isolated AMs from SP-A−/− mice, which would have no SP-A associated with them and compared them with AMs from WT mice, that would have SP-A associated with them. SP-A−/− AMs were not deficient in uptake of 100 nm or 500 nm U-PS or 500 nm A-PS particles compared with the control WT AMs. However, there was a significantly increased uptake of 100 nm A-PS into AMs isolated from SP-A−/− mice compared with WT AMs. The interaction was further confirmed by coating NPs with SP-A prior to incubation with AMs isolated from SP-A−/− and WT mice, respectively, showing that SP-A inhibited the uptake of A-PS particles by cells from both groups of mice. The reduction of macrophage clearance of 100 nm A-PS particles following pre-incubation of SP-A could be mediated, at least in part, through the inhibition of A-PS self-agglomeration at physiological temperatures. However, BSA also showed the ability to inhibit A-PS agglomeration but had little effect on the uptake of A-PS particles by RAW cells. This finding coupled with the enhanced uptake of A-PS particles by AM from SP-A−/− mice suggests that mechanisms other than the inhibition of A-PS agglomeration may be involved in the SP-A-mediated reduction of A-PS uptake. The reduction in phagocytic clearance of potentially toxic particles may result in enhanced exposure or damage to the alveolar epithelium and/or increased translocation to extrapulmonary sites through the systemic circulation. We have previously shown that exogenous SP-D can enhance the uptake of 100 nm A-PS particles by AMs from SP-D-deficient mice (Kendall et al., Citation2013). It would therefore be interesting to determine in future experiments whether the presence of SP-D could alter the ability of SP-A to inhibit the clearance of these particles by AMs.
Potential impact in vivo
It is thought that NPs move by diffusion and pass through the trachea bronchiolar region into the alveoli, where they are deposited and may remain for some time (Muhlfeld et al., Citation2008). Once they enter the surfactant hypophase, they have the opportunity to interact with surfactant lipids and proteins such as SP-A and SP-D (). Lipids and proteins absorb onto the particle surface forming coronas (Walkey et al., Citation2012). This bio-corona leads to changes in surface chemistry and colloidal stability (Ruge et al., Citation2012). The particles may be directly taken up by AMs (Erpenbeck et al., Citation2005; Geiser et al., Citation2008). However, changes to surface chemistry could result in different pattern recognition by defence molecules or surface receptors on cells and could therefore potentially influence the fate of nanomaterials. As SP-A and SP-D show differential interaction with the particles used in this article, the two proteins could potentially complement each other in vivo.
It has been shown that both lipids and proteins from surfactant interact with NPs (Bakshi et al., Citation2008; Kendall, Citation2007). In order to create a more realistic in vitro model of in vivo conditions, it would be beneficial to include lipids in these models for future experiments. Ruge et al. (Citation2012) looked at SP-A and SP-D with metal-NPs with different surface coatings and found differential effects of SP-A and SP-D. They also observed that incorporating surfactant lipids into the in vitro models modified the effects of SP-A and SP-D (Ruge et al., Citation2012). This highlights the fact that current in vitro models do not reflect what happens in vivo. Human BAL can agglomerate NPs (Kendall et al., Citation2002). An in vitro model using the natural porcine surfactant preparation Curosurf (devoid of SP-A and SP-D) also modified the effect of multi-walled carbon nanotubes and enhanced their oxidative and pro-inflammatory effects (Gasser et al., Citation2012). In order to have a comprehensive understanding of how NPs interact with both surfactant proteins and lipids, it is important to understand how NPs interact not only with specific subcomponents of surfactant but also implementing a model system that resembles in vivo circumstances as recently highlighted by Schleh et al. (Citation2013).
Agglomeration seems to be the key to enhanced uptake into AMs in these observations and the surface chemistry described provides a mechanism for agglomeration by SP-A. However, SP-A provides important immune functions within the airspace and sequestering by NPs may leave an individual vulnerable to other pathogenic events and uncontrolled inflammation. We have previously shown that three different types of carbon black particles, ranging from 25 to 75 nm in diameter, were able to completely eliminate SP-D from a suspension (Kendall et al., Citation2004). Furthermore, an animal study exposing rats infected with Streptococcus pneumoniae to PM2.5 particles resulted in an exacerbation of the on-going infection (Zelikoff et al., Citation2003). We have recently shown that incubating these NPs with SP-A and SP-D alters the ability of these proteins to neutralise influenza A infection in vitro (McKenzie et al., Citation2015). This implies that sequestering immune-related proteins could result in functionally deficient individuals resulting in an increase in their susceptibility towards bacterial and viral infections and other inflammatory conditions as observed in mice deficient for SP-A or SP-D (Hawgood et al., Citation2004; LeVine & Whitsett, Citation2001; Li et al., Citation2002). It is therefore important that more research is performed to elucidate the implications of the interactions between SP-A and -D and NPs in order to evaluate the potential health implications when implementing the usage of NPs in the working environment and everyday modern consumer products.
Conclusions
In this study, we have characterised the interaction between NPs and SP-A, examined the effect on cellular uptake, and propose uptake mechanics into macrophages. SP-A showed material-specific binding and calcium-dependent agglomeration of U-PS NPs. We showed that SP-A inhibited the uptake of 100 nm A-PS NPs into macrophage-like cells and primary AMs using CARS (unlabelled 200 nm NPs) and FACS (fluorescent NPs), but this was not observed for larger (500 nm) A-PS particles.
This study combined with previous studies with SP-A and SP-D shows that these molecules may have a (complementary) role in clearing non-pathogen particulate and nanoparticulate materials in vivo. An important factor, when examining the interaction of SP-A or SP-D with NPs, is to consider how the interplay between surfactant lipids and proteins in the bio-corona will affect the interaction and the subsequent downstream bioavailability of the collectins. Future in vivo studies focusing on the interaction between these lung collections, NPs and the clearance route(s) into cells and body compartments is required to provide further insight into the role(s) of SP-A and SP-D in response to inhalation of NPs.
Supplementary material available online
Supplementary Table S1 and Figures S1-S6.
Supplemental Material.pdf
Download PDF (416.4 KB)Acknowledgements
S. M. acknowledges EPSRC Laser Loan Pool support, which enabled the CARS experiments. M. K., H. W. C. and J. M. developed the concepts in all the detailed experiments. M. K., H. W. C. and J. M. wrote and managed the proposal outlining the experimental design. M. G. and C. M. organised and collected the human BAL. Z. M., H. W., C. E. and P. D. prepared the materials and conducted DLS. Z. M., M. K., H. W., C. E. and P. D. jointly interpreted and synthesised the protein-NP data to form conclusions. Z. M., R-M. M., H. W. C. and J. M. designed the RAW264.7 and alveolar macrophage experiments. Z. M. and R-M. M. conducted the RAW264.7 and alveolar macrophage experiments. S. M. performed the CARS experiments and the analysis Z. M., M. K. R-M. M., H. W. C. and J. M. jointly interpreted and synthesised the cell data to form the protein-NP manuscript. Z. M., M. K., R-M. M., H. W., C. E., P. D., M. G., C. M., S. M., H. W. C and J. M. jointly revised the manuscript critically for important intellectual content. We thank Dr. Tony Willis for the N-terminal sequencing of purified native human SP-A.
Declaration of interest
The authors do not have any competing financial interests with the work in this article.
This work was funded under the Joint Environment and Human Health programme (NERC-EPSRC Project NEE009395-1), funded by agencies of the UK Government: The Natural Environment Research Council (NERC), Department for Environment Food and Rural Affairs (Defra), Environment Agency (EA), Ministry of Defence (MOD) and the Medical Research Council (MRC). We gratefully acknowledge the financial support of the MRC ITTP Toxicology Unit for Z. M. The use of FENAC (Facility for Environmental Nanoscience Analysis and Characterisation) was supported by NERC FENAC access grant 2013/05/004. This work was also supported by the National Institute of Health Research (NIHR) funded Respiratory Biomedical Research Units of University Hospital Southampton and the Royal Brompton and Harefield NHS Foundation Trust.
References
- Bakshi MS, Zhao L, Smith R, Possmayer F, Petersen NO. 2008. Metal nanoparticle pollutants interfere with pulmonary surfactant function in vitro. Biophys J 94:855–68
- Barran-Berdon AL, Pozzi D, Caracciolo G, Capriotti AL, Caruso G, Cavaliere C, et al. 2013. Time evolution of nanoparticle-protein corona in human plasma: relevance for targeted drug delivery. Langmuir 29:6485–94
- Borron P, Mcintosh JC, Korfhagen TR, Whitsett JA, Taylor J, Wright JR. 2000. Surfactant-associated protein a inhibits lps-induced cytokine and nitric oxide production in vivo. Am J Physiol Lung Cell Mol Physiol 278:L840–7
- Borron P, Veldhuizen RA, Lewis JF, Possmayer F, Caveney A, Inchley K, et al. 1996. Surfactant associated protein-A inhibits human lymphocyte proliferation and Il-2 production. Am J Respir Cell Mol Biol 15:115–21
- Borron PJ, Crouch EC, Lewis JF, Wright JR, Possmayer F, Fraher LJ. 1998. Recombinant rat surfactant-associated protein D inhibits human T lymphocyte proliferation and Il-2 production. J Immunol 161:4599–603
- Brinker KG, Garner H, Wright JR. 2003. Surfactant protein A modulates the differentiation of murine bone marrow-derived dendritic cells. Am J Physiol Lung Cell Mol Physiol 284:L232–41
- Clark H, Palaniyar N, Strong P, Edmondson J, Hawgood S, Reid KB. 2002. Surfactant protein D reduces alveolar macrophage apoptosis in vivo. J Immunol 169:2892–9
- Deng ZJ, Liang M, Toth I, Monteiro MJ, Minchin RF. 2012. Molecular interaction of poly(acrylic acid) gold nanoparticles with human fibrinogen. Acs Nano 6:8962–9
- Erpenbeck VJ, Malherbe DC, Sommer S, Schmiedl A, Steinhilber W, Ghio AJ, et al. 2005. Surfactant protein D increases phagocytosis and aggregation of pollen-allergen starch granules. Am J Physiol Lung Cell Mol Physiol 288:L692–8
- Gasser M, Wick P, Clift MJ, Blank F, Diener L, Yan B, et al. 2012. Pulmonary surfactant coating of multi-walled carbon nanotubes (Mwcnts) influences their oxidative and pro-inflammatory potential in vitro. Part Fibre Toxicol 9:17
- Geiser M, Casaulta M, Kupferschmid B, Schulz H, Semmler-Behnke M, Kreyling W. 2008. The role of macrophages in the clearance of inhaled ultrafine titanium dioxide particles. Am J Respir Cell Mol Biol 38:371–6
- Haagsman HP, Sargeant T, Hauschka PV, Benson BJ, Hawgood S. 1990. Binding of calcium to sp-A, a surfactant-associated protein. Biochemistry 29:8894–900
- Hansen S, Lo B, Evans K, Neophytou P, Holmskov U, Wright JR. 2007. Surfactant protein D augments bacterial association but attenuates major histocompatibility complex class II presentation of bacterial antigens. Am J Respir Cell Mol Biol 36:94–102
- Hartshorn KL, Crouch EC, White MR, Eggleton P, Tauber AI, Chang D, Sastry K. 1994. Evidence for a protective role of pulmonary surfactant protein D (Sp-D) against influenza A viruses. J Clin Invest 94:311–19
- Hawgood S, Brown C, Edmondson J, Stumbaugh A, Allen L, Goerke J, et al. 2004. Pulmonary collectins modulate strain-specific influenza A virus infection and host responses. J Virol 78:8565–72
- Head JF, Mealy TR, Mccormack FX, Seaton BA. 2003. Crystal structure of trimeric carbohydrate recognition and neck domains of surfactant protein A. J Biol Chem 278:43254–60
- Kendall M. 2007. Fine airborne urban particles (Pm2.5) sequester lung surfactant and amino acids from human lung lavage. Am J Physiol Lung Cell Mol Physiol 293:L1053–8
- Kendall M, Brown L, Trought, K. 2004. Molecular adsorption at particle surfaces: a Pm toxicity mediation mechanism. Inhal Toxicol 16:99–105
- Kendall M, Ding P, Mackay RM, Deb R, McKenzie Z, Kendall K, Madsen J, Clark H. 2013. Surfactant protein D (Sp-D) alters cellular uptake of particles and nanoparticles. Nanotoxicology 7:963–73
- Kendall M, Holgate S. 2012. Health impact and toxicological effects of nanomaterials in the lung. Respirology 17:743–58
- Kendall M, Tetley TD, Wigzell E, Hutton B, Nieuwenhuijsen M, Luckham P. 2002. Lung lining liquid modifies Pm(2.5) in favor of particle aggregation: a protective mechanism. Am J Physiol Lung Cell Mol Physiol 282:L109–14
- Levine AM, Bruno MD, Huelsman KM, Ross GF, Whitsett JA, Korfhagen TR. 1997. Surfactant protein A-deficient mice are susceptible to group B Streptococcal infection. J Immunol 158:4336–40
- Levine AM, Gwozdz J, Stark J, Bruno M, Whitsett J, Korfhagen T. 1999a. Surfactant protein-A enhances respiratory syncytial virus clearance in vivo. J Clin Invest 103:1015–21
- Levine AM, Hartshorn K, Elliott J, Whitsett J, Korfhagen T. 2002. Absence of Sp-A modulates innate and adaptive defense responses to pulmonary influenza infection. Am J Physiol Lung Cell Mol Physiol 282:L563–72
- Levine AM, Kurak KE, Bruno MD, Stark JM, Whitsett JA, Korfhagen TR. 1998. Surfactant protein-A-deficient mice are susceptible to Pseudomonas aeruginosa infection. Am J Respir Cell Mol Biol 19:700–8
- Levine AM, Kurak KE, Wright JR, Watford WT, Bruno MD, Ross GF, et al. 1999b. Surfactant protein-A binds group B Streptococcus enhancing phagocytosis and clearance from lungs of surfactant protein-A-deficient mice. Am J Respir Cell Mol Biol 20:279–86
- Levine AM, Whitsett JA. 2001. Pulmonary collectins and innate host defense of the lung. Microbes Infect 3:161–6
- Li G, Siddiqui J, Hendry M, Akiyama J, Edmondson J, Brown C, et al. 2002. Surfactant protein-A-deficient mice display an exaggerated early inflammatory response to a beta-resistant strain of influenza A virus. Am J Respir Cell Mol Biol 26:277–82
- López-Sánchez A, Sáenz A, Casals C. 2011. Surfactant protein A (Sp-A)-tacrolimus complexes have a greater anti-inflammatory effect than either Sp-A or tacrolimus alone on human macrophage-like U937 cells. Eur J Pharm Biopharm 77:384–91
- McKenzie Z, Kendall M, Mackay R-M, Tetley T, Morgan C, Mark G, et al. 2015. Nanoparticles modulate surfactant protein A and D mediated protection against influenza A infection in vitro. Philos Trans R Soc Lond B Biol Sci 370:20140049
- Muhlfeld C, Rothen-Rutishauser B, Blank F, Vanhecke D, Ochs M, Gehr P. 2008. Interactions of nanoparticles with pulmonary structures and cellular responses. Am J Physiol Lung Cell Mol Physiol 294:L817–29
- Nanotechnologies TPOE. 2014. Consumer products inventory [Online]. Nanotechnology. Available at: http://www.Nanotechproject.Org/Cpi/. Accessed on 9 September 2014
- Oberdörster G, Maynard A, Donaldson K, Castranova V, Fitzpatrick J, Ausman K, et al. 2005a. Principles for characterizing the potential human health effects from exposure to nanomaterials: elements of a screening strategy. Part Fibre Toxicol 2:8
- Oberdörster G, Oberdörster E, Oberdörster J. 2005b. Nanotoxicology: an emerging discipline evolving from studies of ultrafine particles. Environ Health Perspect 113:823–39
- Oberdörster G, Sharp Z, Atudorei V, Elder A, Gelein R, Lunts A, et al. 2002. Extrapulmonary translocation of ultrafine carbon particles following whole-body inhalation exposure of rats. J Toxicol Environ Health A 65:1531–43
- Palaniyar N, Clark H, Nadesalingam J, Hawgood S, Reid KB. 2003. Surfactant protein D binds genomic DNA and apoptotic cells, and enhances their clearance, in vivo. Ann N Y Acad Sci 1010:471–5
- Pastva AM, Wright JR, Williams KL. 2007. Immunomodulatory roles of surfactant proteins A and D: implications in lung disease. Proc Am Thorac Soc 4:252–7
- Patel II, Steuwe C, Reichelt S, Mahajan S. 2013. Coherent anti-Stokes Raman scattering for label-free biomedical imaging. J Opt 15:094006
- Pérez-Gil J. 2008. Structure of pulmonary surfactant membranes and films: the role of proteins and lipid-protein interactions. Biochim Biophys Acta 1778:1676–95
- Raschke WC, Baird S, Ralph P, Nakoinz I. 1978. Functional macrophage cell lines transformed by abelson leukemia virus. Cell 15:261–7
- Ruenraroengsak P, Novak P, Berhanu D, Thorley AJ, Valsami-Jones E, Gorelik J, et al. 2012. Respiratory epithelial cytotoxicity and membrane damage (holes) caused by amine-modified nanoparticles. Nanotoxicology 6:94–108
- Ruge CA, Kirch J, Canadas O, Schneider M, Perez-Gil J, Schaefer UF, et al. 2011. Uptake of nanoparticles by alveolar macrophages is triggered by surfactant protein A. Nanomedicine 7:690–3
- Ruge CA, Schaefer UF, Herrmann J, Kirch J, Canadas O, Echaide M, et al. 2012. The interplay of lung surfactant proteins and lipids assimilates the macrophage clearance of nanoparticles. PLoS One 7:E40775
- Salvador-Morales C, Townsend P, Flahaut E, Ve’Nien-Bryan C, Vlandas A, Green MLH, Sim RB. 2007. Binding of pulmonary surfactant proteins to carbon nanotubes; potential for damage to lung immune defense mechanisms. Carbon 45:607–17
- Schleh C, Kreyling WG, Lehr CM. 2013. Pulmonary surfactant is indispensable in order to simulate the in vivo situation. Part Fibre Toxicol 10:6
- Schulze C, Schaefer UF, Ruge CA, Wohlleben W, Lehr CM. 2011. Interaction of metal oxide nanoparticles with lung surfactant protein A. Eur J Pharm Biopharm 77:376–83
- Shrive AK, Tharia HA, Strong P, Kishore U, Burns I, Rizkallah PJ, et al. 2003. High-resolution structural insights into ligand binding and immune cell recognition by human lung surfactant protein D. J Mol Biol 331:509–23
- Suwabe A, Mason RJ, Voelker DR. 1996. Calcium dependent association of surfactant protein A with pulmonary surfactant: application to simple surfactant protein A purification. Arch Biochem Biophys 327:285–91
- Voss T, Eistetter H, Schafer KP, Engel J. 1988. Macromolecular organization of natural and recombinant lung surfactant protein Sp 28-36. structural homology with the complement factor C1q. J Mol Biol 201:219–27
- Walkey CD, Olsen JB, Guo H, Emili A, Chan WC. 2012. Nanoparticle size and surface chemistry determine serum protein adsorption and macrophage uptake. J Am Chem Soc 134:2139–47
- Wright JR, Wager RE, Hawgood S, Dobbs L, Clements JA. 1987. Surfactant apoprotein Mr = 26 000–36 000 enhances uptake of liposomes by type II cells. J Biol Chem 262:2888–94
- Zelikoff JT, Chen LC, Cohen MD, Fang K, Gordon T, Li Y, et al. 2003. Effects of inhaled ambient particulate matter on pulmonary antimicrobial immune defense. Inhal Toxicol 15:131–50