
Abstract
An estimated 1% or less of nanoparticles (NPs) deposited in the lungs translocate to systemic circulation and enter other organs; however, this estimation may not be accurate given the low sensitivity of existing in vivo NP detection methods. Moreover, the biological effects of such low levels of translocation are unclear. We employed a nano-scale hyperspectral microscope to spatially observe and spectrally profile NPs in tissues and blood following pulmonary deposition in mice. In addition, we characterized effects occurring in blood, liver and heart at the mRNA and protein level following translocation from the lungs. Adult female C57BL/6 mice were exposed via intratracheal instillation to 18 or 162 µg of industrially relevant titanium dioxide nanoparticles (nano-TiO2) alongside vehicle controls. Using the nano-scale hyperspectral microscope, translocation to heart and liver was confirmed at both doses, and to blood at the highest dose, in mice analyzed 24 h post-exposure. Global gene expression profiling and ELISA analysis revealed activation of complement cascade and inflammatory processes in heart and specific activation of complement factor 3 in blood, suggesting activation of an early innate immune response essential for particle opsonisation and clearance. The liver showed a subtle response with changes in the expression of genes associated with acute phase response. This study characterizes the subtle systemic effects that occur in liver and heart tissues following pulmonary exposure and low levels of translocation of nano-TiO2 from lungs.
Introduction
The increased production and use of NPs (defined as particles <100 nm in at least one dimension) in various consumer products (paints, sunscreens and cosmetics), nano-medicines and diagnostics has increased the risk of human exposure to these particles (IARC, Citation2010). Target organ toxicity, especially pulmonary toxicity following exposure via inhalation, has been the focus of several studies in the last decade (Ferin et al., Citation1992; Grassian et al., Citation2007; Renwick et al., Citation2004; Warheit et al., Citation2007); however, very few in vivo studies have investigated the effects of translocation of particles to non-target tissues. In biodistribution studies using isotope-tagged or fluorescence labelled particles, a small fraction (less than 1%) of NPs [gold nanoparticles (2–40 nm), titanium dioxide nanoparticles (22 nm), ultrafine iridium particles (15 and 80 nm) radiolabeled with 192iridium (192Ir), carbon nanoparticles (25 nm) spiked with radio-labeled primary iridium (192Ir) and isotopic ultrafine carbon particles (13C; 20–29 nm)] deposited in lungs were shown to translocate to systemic circulation and reach extra-pulmonary organs including heart and liver (Geiser & Kreyling, Citation2010; Geiser et al., Citation2005; Kreyling et al., Citation2002; Muhlfeld et al., Citation2007; Nemmar et al., Citation2002a,Citationb; Oberdorster et al., Citation2002; Sadauskas et al., Citation2007, Citation2009b). These studies did not elucidate the systemic effects of such particle translocation and the potential influence of doping the particles with isotope or fluorescent tags on translocation was not clear. Moreover, the existing analytical methods, for example inductively coupled plasma mass spectrometry (ICP-MS), are not always sensitive enough to detect the low amounts NPs that translocate. In addition, optical microscopic methods require isotope or florescence tagging of particles, which results in increasing the particle size and may influence their translocation.
We previously investigated the effects of nano-titanium dioxide particles (nano-TiO2) exposure and deposition in mouse lung tissue, and showed strong pulmonary inflammation, acute phase response and systemic circulation of cytokines and acute phase proteins (Husain et al., Citation2013). The first objective of this study was to employ hyperspectral microscopy to detect translocation of non-doped NPs to heart and liver tissues following direct deposition in lungs in these mice [i.e. heart and liver tissue collected from Husain et al. (Citation2013)]. This technique enables optical imaging and qualitative spectral analysis of NPs in tissues or cells without requiring post-processing of samples or special tagging of NPs with fluorescence.
Given that the translocation to extra-pulmonary organs is expected to be very low, the potential biological effects of such translocation are generally assumed to be subtle. Systemic effects may result from several biological mechanisms of action. For example, it is hypothesized that extra-pulmonary effects may be local responses to systemic circulation of cytokines and acute phase proteins that are synthesized in the lungs. The systemic effects may also be the result of direct interaction of translocated NPs with the surrounding biological milieu (Jackson et al., Citation2013). However, no previous study has simultaneously investigated both translocation of NPs and systemic effects in heart and liver tissues. Thus, the second objective of this study was to employ genomics tools to profile the entire transcriptomic response in heart and liver tissues of these mice to identify and characterize the mechanisms of systemic effects. Global gene expression profiling has the added advantage of potentially identifying toxicities or potential health risks that might not be found using the traditional end-point-specific techniques.
C57BL/6 mice were exposed via intratracheal instillation to 18 or 162 μg of nano-TiO2. Lungs, hearts and livers were sampled 24 h and 28 d after the exposure. Particle retention in lungs and pulmonary responses were published previously (Husain et al., Citation2013; Saber et al., Citation2012). In this study, we used nano-scale hyperspectral microscopy to detect translocation of nano-TiO2 to heart and liver tissues, and profiled global mRNA response to reveal possible adverse effects in these tissues.
Materials and methods
Characterization of materials
The details of sample preparation and particle characterization were described previously (Halappanavar et al., Citation2011; Hougaard et al., Citation2010). In brief, the nano-TiO2 used in this study is also known as UV-Titan L181 (Kemira, Pori, Finland). Transmission electron microscopy (TEM, Tecnai G20, FEI Company, Hillsboro, OR) was used to determine particle size, morphology, and agglomeration and/or aggregation state in suspension. Powder X-ray diffraction (XRD) was used to determine crystalline phase and size. Multipoint Brunauer, Emmett and Teller (BET) nitrogen adsorption method (after 1 h degassing at 300 °C) was employed to determine specific surface area on a Quantachrome Autosorp-1 (Quantachrome GmbH & Co. KG, Odelzhausen, Germany). Elemental composition was analyzed using X-ray fluorescence (Philips PW-2400 spectrometer); this service was provided by the Department of Earth Sciences, University of Aarhus, Denmark.
Animal handling, exposures and tissue collection
Details of animal handling, exposures and tissue collection have been described previously (Husain et al., Citation2013; Jackson et al., Citation2011; Saber et al., Citation2012). Briefly, particles were suspended by probe sonication in 0.9% NaCl MilliQ water containing 10% v/v acellular BAL collected from C57BL/6 mice and 8-week-old female C57BL/6 mice (Taconic Ry, Denmark) were exposed to two different doses (18 and 162 µg) of nano-TiO2 via intratracheal instillation (N = 6 per group). Control mice were exposed to vehicle solutions containing 90% of 0.9% NaCl MilliQ water and 10% acellular BAL fluid. Female mice were chosen as they can be co-housed and are easier to handle. We have used both male and female mice previously and we have not observed any obvious differences in pulmonary response. The doses used in this study are equivalent to 1.5 and 15 working days at the Danish occupational exposure level for nano-TiO2 (6.0 mg Ti/m3–10 mg TiO2/m3), respectively (At vejledning, Citation2007). Mice were sacrificed under anaesthesia using Hypnorm® (fentanyl citrate 0.315 mg/ml and fluanisone 10 mg/ml from Janssen Pharma) and Dormicum® (Midazolam 5 mg/ml from Roche) 24 h and 28 d post-exposure as described previously (Husain et al., Citation2013; Jackson et al., Citation2011; Saber et al., Citation2012). Liver and heart tissues from experimental and control mice were placed in cryogenic vials and snap frozen immediately in liquid nitrogen. All tissues were stored at −80 °C until the analysis. All animal experiments were approved by the Danish “Animal Experiments Inspectorate” and performed according to their guidelines for ethical conduct in the care and use of animals in research (application # 2010/561-1779).
Particle size distributions in the exposure medium were analysed using dynamic light scattering (DLS, Malvern zetasizer Nano ZS equipped with a 633 nm He-Ne laser, Malvern Inc., UK) as detailed in (Roursgaard et al., Citation2010). The results were calculated using Malvern DTS software version 6.11 and 7.11. The intensity-derived average hydrodynamic diameters, Zave (zeta potential), and polydispersivity indices (PDI) of each of the dispersions used for toxicological testing were derived.
Preparation of blood smears and serum
In a separate animal exposure experiment (approved by Animal Experiments Inspectorate), 5–7 weeks old female C57BL/6 mice were exposed by intratracheal instillation to 162 μg of nano-TiO2 (N = 3) or control exposure medium (N = 3) as described above. Blood was drawn from control and treated mice by cardiac puncture under anaesthesia using a 1 ml syringe 4 h and 24 h after the instillation. A drop (5 μl) of blood was placed on a frosted microscope slide and was spread on the surface using another slide. Smears were air dried, and then dipped into 100% methanol for 1 min. Slides were left to dry overnight and stored at room temperature until use. A minimum of one slide per mouse was prepared and assessed. The rest of the blood was collected in a microtainer tube with serum separator (Becton Dickinson and Company, NJ). Blood was allowed to clot for 30 min at room temperature and centrifuged at 3000 × g for 15 min at 4 °C to collect the serum.
Detection of nano-TiO2 particles in the tissues
The translocation of nano-TiO2 to liver, heart tissue and blood were assessed using CytoViva’s Nano-scale Hyperspectral Microscope (CytoViva, Inc., Auburn, AL). Frozen liver and heart tissues from control and nano-TiO2 exposed C57BL/6 mice were randomly cryo-sectioned into 5 μm thick slices, fixed with formalin and stained with hematoxylin–eosin (H-E) stain. In order to avoid bias in the analysis, coded H-E stained slides (two sections per sample) were sent to CytoViva, Inc. for hyperspectral imaging and qualitative mapping of nano-TiO2 particles. Blood smears prepared as described above were analysed by CytoViva, Inc. Prior to the analyses, a reference spectral library of nano-TiO2 used in the study, as well as nano-TiO2 found in both tissue types, and blood samples, was created based on the different refractive index of nano-TiO2 in experimental samples as previously described (Husain et al., Citation2013). From each treatment group, one non-coded experimental sample was used for this purpose. A second hyperspectral library was created from several regions of tissue sections or blood smears prepared from control mice (not exposed to nano-TiO2), which included spectral profiles of bright non-specific objects in the background (cells, stains and debris). Hyperspectral profiles of coded experimental samples were compared to those in the two reference libraries. Samples were decoded after the completion of the analysis to examine particle retention.
RNA extraction, microarray hybridization and data analysis
Total RNA was isolated from randomly sectioned (weighing 10–15 mg) liver and heart tissues from control and nano-TiO2 exposed C57BL/6 mice using TRIzol reagent (Invitrogen, Carlsbad, CA), and purified using RNeasy Plus Mini kits (Qiagen, Mississauga, ON, Canada) according to the manufacturer's instructions. Total RNA concentration was measured using a NanoDrop 2000 spectrophotometer (Thermo Fisher Scientific Inc., Wilmington, DE), and RNA quality was assessed using an Agilent 2100 Bioanalyzer (Agilent Technologies, Inc., Santa Clara, CA) according to the manufacturer's instructions. Samples showing RNA integrity numbers (RIN) of 7 and above were used in microarray and RT-qPCR experiments. DNA microarray (Agilent mouse 4 × 44 K oligonucleotide microarrays; Agilent Technologies Inc., Santa Clara, CA) analysis was conducted as described previously (Husain et al., Citation2013). All microarray data from this study are available at the National Center for Biotechnology Information (NCBI) and Gene Expression Omnibus (GEO) databases. GEO accession numbers for these files are: GSE56324 (for heart dataset) and GSE56325 (for liver dataset). A sample size of five animals per group was used for the microarray experiments. Based on our previous studies, we have found that a minimum of n = 5/treatment group is optimal and provides sufficient statistical power to detect subtle gene expression changes. A sample size of five is also operationally feasible. The microarray results were validated as described in the sections below by RT-PCR, ELISA and Bioplex analysis using n = 3–5/treatment group, which is standard.
A randomized reference block design was used to analyze gene expression microarray data. Data were normalized using LOWESS regression modeling method and statistical significance of the differentially expressed genes was determined using MAANOVA in R statistical software (http://www.r-project.org). The Fs statistic was used to test the treatment effects and p values were estimated by the permutation method using residual shuffling. Fold change calculations were based on the least-square means. Genes showing expression changes of at least 1.5-fold in either direction compared to their matched controls and having p values ( ≤ 0.05) were considered significantly differentially expressed and were used in the downstream analysis.
Gene ontology (GO) analysis using the Database for Annotation, Visualization and Integrated Discovery (DAVID) v6.7 (Huang et al., Citation2009) was performed to identify functional themes to which the differentially expressed genes belonged. Specific biological pathways associated with the differentially expressed genes were identified using Ingenuity Pathway Analysis (IPA, Ingenuity Systems, Redwood City, CA) software. Biological network analysis was conducted using MetaCore software (Thomson Reuters Scientific Inc., Philadelphia, PA).
Validation of genes by RT-qPCR
A custom quantitative real-time RT-PCR (RT-qPCR) array (CAPM11804; Qiagen, Frederick, MD) was designed to validate 26 genes representing complement cascade, pro-inflammatory chemokines, cytokines and their receptor groups from the microarray data sets (± 1.5 fold; p < 0.05). The experiment was carried out according to the manufacturer’s instructions as described previously (Husain et al., Citation2013). Normalization of the threshold cycle (Ct) values was performed using Hprt, Actb and Gapdh as internal control genes. Relative expression of the differentially expressed genes was determined using PCR array data analysis template available online from the manufacturer’s website (Qiagen, Frederick, MD).
Western blot analysis of complement factors and inflammatory modulators in heart tissue and serum
Total protein was extracted from the frozen mouse heart tissue sections of experimental and control mice using Bio-Plex Cell Lysis Kits (BioRad Laboratories, Mississauga, ON, Canada) containing a protease inhibitor cocktail (1:200; Sigma Aldrich, Oakville, ON, Canada). Bradford protein assay kits (BioRad Laboratories, Mississauga, ON, Canada) were used for quantification of the extracted protein. Approximately, 30–50 µg of total protein was run on 4–15% SDS-PAGE (BioRad Laboratories, Mississauga, ON, Canada) and was transferred onto Immuno-Blot PVDF membrane (BioRad Laboratories, Mississauga, ON, Canada) by wet transfer. Antibodies for anti-C2, anti-MASP1 and anti-MASP-2 from Santa Cruz Biotechnology, Inc. (Dallas, TX), anti-C4b from Sigma (St. Louis, MO), anti-C3 and anti-C5 from Abcam (Toronto, ON, Canada), were used to test for changes in expression levels of these proteins. All expression values were normalized to total GAPDH levels (anti-GAPDH antibody, R & D Systems Inc., MNUSA) in Image Lab software version 4.1 build 16 (BioRad Laboratories, Mississauga, ON, Canada).
Enzyme linked immune sorbent assay
Enzyme linked immune sorbent assay (ELISA) was used to measure the total levels of adiponectin, adipisin (complement factor D) and leptin from EMD Millipore Corporation (Billerica, MA), fibrinogen (Abcam Inc., Toronto, ON, Canada) and resistin (R&D Systems Inc., Minneapolis, MN), in heart of the experimental and control mice. ELISA was performed according to the individual manufacturer’s instructions.
Expression analysis of inflammatory proteins using multiplex protein array
Total protein was isolated from both control and treated samples as described above. A multiplex suspension protein assay was performed using the 23-plex panel of Bio-Plex Pro Mouse Cytokine Assays (Bio-Rad, Mississauga, ON, Canada) according to the manufacturer’s instructions. The details of the experiment are described in Husain et al. (Citation2013).
Results
Particle characterization
Detailed characterization of the nano-TiO2 was reported by Hougaard et al. (Citation2010) and Halappanavar et al. (Citation2011). Briefly, the nano-TiO2 used for this study was surface modified with zirconium, silicon, aluminum and polyalcohol, and mainly consisted of the rutile form (70.8% by weight). It had a primary size of 20.6 nm and surface area of 107.7 m2/g. Details are summarized in .
Table 1. Detailed physical and chemical characteristics of nano-TiO2 (UV-Titan L181) particles (modified from Halappanavar et al., Citation2011; Hougaard et al., Citation2010; Husain et al., Citation2013).
summarizes the DLS results of the average intensity-derived hydrodynamic sizes of the nano-TiO2 dispersed in exposure medium. The results show high degree of agglomeration at all concentrations tested. Formation of aggregates and agglomerates of nano-TiO2 was confirmed by TEM.
Table 2. Dynamic light scattering analysis of particle size distributions in the exposure medium.
Detection of nano-TiO2 in heart and liver tissues
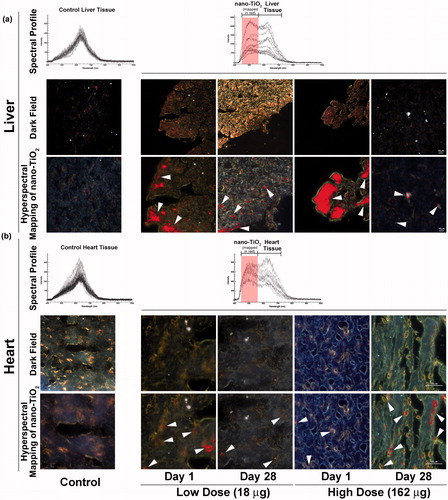
Nano-scale hyperspectral microscopy enables accurate detection of pristine NPs in biological samples without a need for fluorescence tagging. Using this system, we examined liver and heart tissues from mice exposed intratracheally to 18 and 162 µg of nano-TiO2 sampled on day 1 and 28 post-exposure, respectively, for evidence of translocation as well as mice exposed to vehicle. shows optical and hyperspectral images of liver () and heart () tissues from mice exposed to nano-TiO2. The top panel is the spectral library of light scattering in the control untreated tissues ( left), and the spectral library of nano-TiO2 used in the study in exposed liver (, right) and heart (, right) tissues. The middle panel shows darkfield hyperspectral images. The bottom panel shows hyperspectral mapping images (overlay of darkfield hyperspectral images with nano-TiO2 reference spectra). The red colour in the bottom panel (white arrows) indicates areas of spectra that matched to the specific hyperspectral reference library created for nano-TiO2 in these tissues. The hyperspectral imaging of tissues revealed the presence of notable amounts of nano-TiO2 in the livers of mice exposed to the 18 and 162 µg doses sampled 24 h post-exposure; detectable amounts of nano-TiO2 were sustained in the liver for up to 28 d after the exposure (). Likewise, translocation of nano-TiO2 to heart was confirmed at both doses and post-exposure time points; however, in comparison to liver, only trace amounts of nano-TiO2 were detected in the heart tissue (). The distribution of particles within the tissues was non-uniform. Relatively larger fraction of nano-TiO2 was detected following exposure to 162 μg compared to 18 μg dose. Although notable differences were observed at the two post-exposure time points, the exact quantification of the amount of translocated nano-TiO2 was not possible. Thus, it is not clear if the amount of translocated NPs decreased or increased with time. As expected, no nano-TiO2 was detected in control mice. Thus, nano-TiO2 was translocated from lungs to heart and liver following intratracheal instillation.
Figure 1. Detection of nano-TiO2 particles in heart and liver tissues using Nano-scale Hyperspectral Microscopy. Liver and heart tissues from mice exposed to 18 and 162 µg of nano-TiO2 via intratracheal instillation and sampled 1 d (24 h) and 28 d post-exposure. Microscopic slides containing approximately 5 µm tissue sections were subjected to visible and near-infrared hyperspectral imaging to detect the particles in (a) liver and (b) heart tissues. Top panels in both (a) and (b) show spectral libraries from control (left image) and nano-TiO2 exposed (right image) tissues, respectively. Middle panels for the same show dark field hyperspectral images from control and nano-TiO2 exposed tissues. Bottom panels show hyperspectral mapping of nano-TiO2 in the (a) liver and (b) heart tissues; nano-TiO2 appear as red dots or aggregates indicated with white arrow heads.
Biological impacts of translocation
In order to elucidate the biological consequences of nano-TiO2 translocation, we used DNA microarrays to profile cardiovascular and hepatic global genomic responses in mice exposed to 162 µg of nano-TiO2 sampled 24 h, and 28 d post-exposure. Since the low dose was expected to induce such subtle effects, only the high dose samples were analysed. A total of 458 genes in heart (264 genes at 24 h and 275 genes at 28 d) and 63 genes in liver (49 genes at 24 h and 14 genes at 28 d) were statistically significantly differentially expressed (p ≤ 0.05 and fold change of ≥1.5 in either direction). The details of the microarray results are provided in Supplementary material (Supplementary Figure S1 and Tables S1–3). Ingenuity Pathway Analysis software (Ingenuity Systems, Redwood City, CA) was used to categorise and assign differentially expressed genes to specific pathways. Four main canonical pathways were significantly altered (Fisher’s exact p value ≤ 0.05) in heart including complement cascade, acute phase signalling, hepatic fibrosis and TR/RXR activation (). Liver tissue showed changes in the expression of several genes associated with acute-phase response (Saa1, Saa2 and Saa3); however, no specific pathways were significantly enriched in the liver. Since the liver showed a very subtle response, the rest of the analysis was conducted on heart tissues.
Figure 2. Pathway analysis and RT-qPCR validation of complement cascade genes. (a) Ingenuity pathway analysis shows significant enrichment of complement cascade pathway in the heart tissue 24 h post-exposure. (b) Validation of genes in the complement cascade pathway by RT-qPCR. The statistical significance is noted by **p < 0.01 or *p < 0.05.
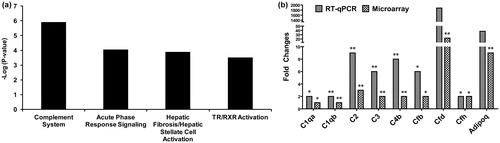
In the heart tissue, the complement cascade was the most perturbed pathway, with a total of seven differentially expressed genes, including complement factor D or adipsin (Cfd), complement factor 3 (C3), Cfb, C4b, C1qa, Cfh and C2 (). Up-regulation of these seven genes was evaluated using RT-qPCR. In addition, 19 more genes belonging to the complement pathway and inflammation were selected for validation by RT-qPCR. Inflammatory genes were included in the validation since it is known that the complement-driven immune response includes activation of inflammation. However, these genes did not show statistically significant differential expression by RT-qPCR (Supplementary Table S4). The results confirmed significant (p ≤ 0.05) up-regulation of C1qa, C2, C3, C4b, Cfb and Cfh in heart tissue at 24 h post-exposure (). Although we observed a very high expression of Cfd (1880-fold; p = 0.12) and Adipoq (38-fold; p = 0.07) by RT-qPCR, statistical significance of these genes did not meet the p value threshold of ≤0.05; failure to attain statistical significance was due to inter-animal variation and the small number of animals used in this experiment. In addition, C1ra, C1qb, Serpineg1 and Cxcl1 were identified as differentially expressed 24 h post-exposure only by RT-qPCR (Supplementary Table S4). To evaluate the impact at the protein level, the corresponding protein levels of the above genes were assessed using ELISA or Western blot analysis. In addition, we assessed protein levels of several other complement genes that exhibited greater than 2-fold changes in gene expression compared to their respective controls (). Protein analysis by Western blot confirmed the altered levels of C2A, C3, C3B, C4B, C5, C5B, mannan-binding lectin serine peptidase 1 (MASP-1) and MASP-2, in heart tissues of nano-TiO2 exposed mice 24 h post-exposure (). Significant (p ≤ 0.05) up-regulation of CFD (Adipsin) was confirmed by ELISA (). Since early complement activation plays an important role in promoting inflammation, expression levels of several inflammatory modulators (cytokines and chemokines) were validated using multiplex protein arrays. A total of 23 proteins associated with inflammation were assessed in heart tissues at the 24 h post-exposure time point. A list of all proteins evaluated by multiplex protein array (Bioplex) and ELISA is provided in Supplementary Table S5. The results confirmed significantly (p ≤ 0.05) up-regulated expression of CXCL1, CCL2, CCL3, CCL4, IL-1b, IL-5, IL-10, IL-12 (p40), IL-13 and TNF-α at the 24 h post-exposure time point (). Most of these are regulated by the NFκB pathway. All of the changes in genes and proteins observed 24 h post-exposure were returned to basal level by 28 d post-exposure (data not shown), suggesting that activation of complement cascade and consequent inflammation mediated by NFkB may reflect an acute response that rapidly declines even in the absence of complete particle clearance. A similar decline in inflammation was also observed in lungs in the presence of particles (Husain et al., Citation2013).
Figure 3. Analysis of proteins by Western blot, ELISA and multiplex protein array. (a) Proteins involved in complement cascade in the heart tissue at 24 h post-exposure were analyzed by Western blot. (b) Pro-inflammatory chemokines and cytokines (CXCL1, CCL2, CCL3, CCL4, IL-1 b, IL-5, IL-10, IL-12 [p40], IL-13 and TNF-α) were analyzed using 23-plex bioplex assay kit; expression of adipsin (CFD) was analyzed using ELISA. The statistical significance is noted by **p < 0.01 or *p < 0.05.
![Figure 3. Analysis of proteins by Western blot, ELISA and multiplex protein array. (a) Proteins involved in complement cascade in the heart tissue at 24 h post-exposure were analyzed by Western blot. (b) Pro-inflammatory chemokines and cytokines (CXCL1, CCL2, CCL3, CCL4, IL-1 b, IL-5, IL-10, IL-12 [p40], IL-13 and TNF-α) were analyzed using 23-plex bioplex assay kit; expression of adipsin (CFD) was analyzed using ELISA. The statistical significance is noted by **p < 0.01 or *p < 0.05.](/cms/asset/9f1e2392-4f35-452d-9b2d-80ec3d5432bf/inan_a_996192_f0003_b.jpg)
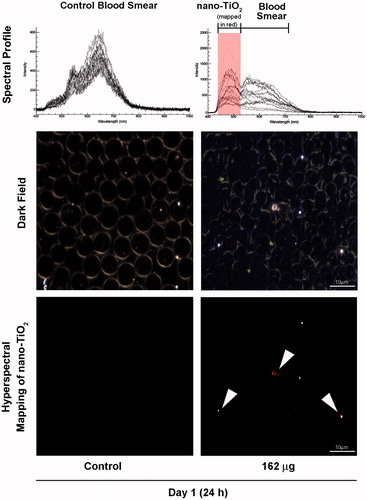
Particle translocation from lungs to other tissues is suggested to occur via blood circulation (Sadauskas et al., Citation2009b). To test this hypothesis, we exposed mice via intratracheal instillation to 162 μg of nano-TiO2 and collected blood 24 h post-exposure. We assessed the presence of particles in blood smears using the Nano-scale Hyperspectral Microscope. shows trace amounts of particles in blood at the 24 h post-exposure. The very low levels of particles detected can be attributed to the fact that particles entering into blood circulation accumulate in the liver relatively quickly and thus, may only stay in circulation for a very brief period of time (Sadauskas et al., Citation2007). Complement factors are secreted into blood from the liver and/or adipose tissue. These factors can be activated in blood by binding to pathogens or particles. In order to assess if the presence of particles in blood activated the complement cascade, we measured levels of activated C3 in serum samples collected 24 h post-exposure. Western blot analysis using C3-specific antibodies showed significant reduction (p ≤ 0.05) of the native/pre C3 protein into its cleavage product C3B, which is a hallmark of complement activation (), suggesting that the nano-TiO2 activated serum complement cascade.
Figure 4. Detection of nano-TiO2 in blood of mice exposed to high dose (162 µg) nano-TiO2. Fresh drops of blood from nano-TiO2 exposed or control mice were smeared on microscopic slides using cover slips. Slides were subjected to visible and near-infrared hyperspectral imaging to detect the presence of particles at 24 h post-exposure. The top panel shows the spectral libraries from control (left) and nano-TiO2 exposed (right) samples. The middle panel shows dark field images from control and exposed samples. The bottom panel (right) sample shows hyperspectral mapping of nano-TiO2 in the blood of exposed mice; nano-TiO2 appear as red dots or aggregates.
Discussion
Several studies have shown that NPs entering the body via pulmonary exposure reach extra pulmonary tissues including blood, liver, kidney, brain, diaphragm and heart (Kreyling et al., Citation2002; Mercer et al., Citation2013; Oberdorster et al., Citation2002; Semmler et al., Citation2004; Semmler-Behnke et al., Citation2007; Takenaka et al., Citation2006). Most of these studies used NPs tagged with fluorescence labels or isotope, and it has been shown that leaking or dissociation of the label from NPs can occur and skew the interpretations of such data (Levy et al., Citation2012). In addition, the limit of detection of NPs using the existing analytical or microscopic methods is ∼1% of the total administered dose (Nemmar et al., Citation2002a). For example, we previously evaluated the translocation of nano-TiO2 to the liver using ICP-MS and found no evidence of translocation (Hougaard et al., Citation2010). This may have been due to a high detection limit caused by interference from other molecules with similar molecular weight. However, in this study, we instilled mice with the same nano-TiO2 particles, and used Nanoscale Hyperspectral Microscopy to detect a considerable amount of particle translocation to both liver and heart tissues. The results suggest that the technology may be more sensitive in detecting traces of particles for which there is a high background level in biological tissues, or which cannot be easily detected using ICP-MS, such as carbon nanotubes and nano-TiO2.
Pulmonary exposure to NPs has been shown to induce adverse systemic effects in non-target tissues, such as heart, liver and brain. Inhalation or intratracheal instillation of nano-TiO2 (21 nm) or carbon black (Printex 90) results in oxidative stress, and genotoxicity in various tissues including coronary arterioles, liver and skeletal muscle (Bourdon et al., Citation2012; Cao et al., Citation2014; Jackson et al., Citation2012b; LeBlanc et al., Citation2009, Citation2010; Mikkelsen et al., Citation2011; Moller et al., Citation2010; Nurkiewicz et al., Citation2006; Vesterdal et al., Citation2010). In utero exposure to nano-TiO2 or carbon black has been shown to affect global gene expression profiles in the livers of newborn offspring (Jackson et al., Citation2012a, Citation2013). It is unclear whether the observed systemic effects are caused by direct interaction of these distal tissues with translocated NPs or are the results of local pulmonary inflammation and acute phase response leading to infiltration of circulating inflammatory cells and activation of signalling cascades. Direct particle translocation is proposed to play a role in inducing these systemic effects; however, none of the above studies have confirmed the presence of particles in the tissues where an effect was observed. In the absence of confirmed particle translocation, adverse systemic effects are assumed to be the result of the downstream consequences of local pulmonary inflammation. In the present experiment, nano-TiO2 particles were detected both in liver and heart. Despite the fact that a large amount of nano-TiO2 was observed in the liver compared to heart tissue, the resulting effects on hepatic gene expression changes were relatively subtle. The hepatic system is the detoxification center of the body. Thus, the liver may be well equipped to deal with NPs translocated from the lungs. The considerable amount of nano-TiO2 found in liver up to 28 d after the last exposure suggests a slow clearance similar to what has been documented for gold NPs (Sadauskas et al., Citation2009a). Another study showed that the largest distribution of NPs in experimental rats following intravenous injection of nano-TiO2 was to the liver; with levels remaining unchanged 1, 14 and 28 d post-injection (Fabian et al., Citation2008).
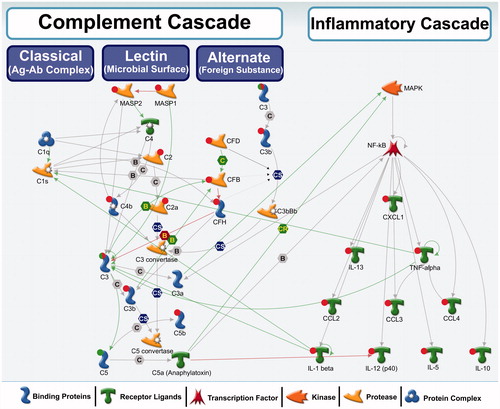
In contrast to the liver, the heart exhibited expression changes in several genes and proteins associated with the complement cascade following nano-TiO2 in our study. The complement system consists of a large number of plasma proteins (∼35) that activate one another to opsonise foreign objects (pathogens and nanoparticles presumably recognized as pathogens) or damaged host cells, and induce inflammatory responses that help to fight infection (Janeway & Medzhitov, Citation2002). The complement system can be activated on the pathogen/NP surface by three distinct pathways: classical, lectin or the alternative pathway (). These pathways are activated by different initiators, but eventually converge to generate the same effector molecules. Early events of the complement activation by any of these pathways lead to the generation of C3 convertase, which in turn leads to C3B, the pivotal effector molecule and C3A, an inflammation mediating peptide (Noris & Remuzzi, Citation2013). C3B also binds to C3 convertase and forms C5 convertases, C5A and C5B, all of which play an important role in inflammation and late events of the complement system (Noris & Remuzzi, Citation2013). Activated complement system protects against pathogenic substances by directly binding and opsonising the pathogen for phagocytic engulfment, or by recruiting and activating phagocytes to the site of complement activation. illustrates molecules associated with three distinct complement pathways in general and highlights that specific genes/proteins that exhibited altered expression levels following exposure to nano-TiO2 in this study are associated with the lectin pathway. These results suggest that the lectin pathway may be the preferred pathway for opsonisation and clearance of NPs from the cardiovascular system.
Figure 5. A biological network showing interactions among complement cascade and inflammatory cascade genes/proteins. Red circle: up-regulation, green circle: down-regulation, both red and green: down-regulation of precursor and induction of the activated form. These genes were differentially regulated in this study. No circle: no change in expression or expression levels not measured in this study. Green arrows represent positive regulation/activation, brown arrows represent negative regulation/inhibition and grey arrows represent unspecified regulation. B – binding; C – cleavage; IE – influence on expression; CS – complex subunit; CR – complex group relations.
Increased protein levels of C3 have been found previously in lung tissue after repeated pulmonary exposure to single walled carbon nanotubes by aspiration (Teeguarden et al., Citation2011). The authors of this study also noted increased expression of several other acute phase proteins including FN1, S100A8 and S100A9. Complement activation and consequent inflammation are a part of the acute phase response, which aids in the clearance of invading pathogens from tissues and circulation. However, uncontrolled complement activation and resulting inflammation have been shown to cause adverse cardiovascular effects such as, the development and progression of atherosclerosis, plaque rupture and thrombosis (Carter, Citation2012). For example, C3 activation products (C3a and C3b) are involved in the atherothrombotic process and their association with lipid components in the vessel wall can expedite the atherosclerotic process (Carter, Citation2012). The results of our study reflect an acute scenario; however, the long-term effects of persistent activation of the complement cascade following chronic exposures to NPs are yet to be demonstrated.
The results further imply that translocation of particles may have played a direct role in the observed systemic effects in both liver and heart. However, additional experiments that can effectively by-pass the pulmonary system, or experiments involving transgenic mice that are deficient in their ability to induce acute phase and/or immune response, are required to conclusively rule out the potential involvement of lung neuronal signalling that is known to induce systemic immune response. Indeed, we have reported a strong acute phase reaction in the lungs of these mice (Husain et al., Citation2013) that may have triggered the lung neuronal axis and consequently the systemic response.
In addition to exposure to NPs in consumer products and via inhalation, NPs can be directly injected intravenously during nano-medicine applications (Zolnik et al., Citation2010). Following entry into the blood by direct injection or indirect translocation, NPs can bind to plasma proteins (opsonisation by complement proteins, immunoglobulins, apolipoproteins and mannose binding proteins) and immune cells (monocytes, platelets and leukocytes) that are responsible for their uptake and elimination from the circulation (Zolnik et al., Citation2010). Thus, with increasing use of NPs for medicinal and diagnostic purposes, there is an increasing risk of persistently activating the complement system, which may further impose a negative chronic health outcome. Given the results of this study showing the ability of trace amounts of NPs to induce the complement system in blood and heart tissue, a detailed understanding of the interactions between the NPs and the complement system will be important.
Conclusion
In conclusion, we demonstrate that a small fraction of nano-TiO2 particles translocate from lungs to blood and extra-pulmonary organs, which is in line with reports published earlier (Muhlfeld et al., Citation2007; Nemmar et al., Citation2002a; Rothen-Rutishauser et al., Citation2007; Sadauskas et al., Citation2009b; Semmler-Behnke et al., Citation2008). We further show that acute translocation of particles to blood and other organs coincides with induction of an innate immune type response, which includes activation of acute stress response in liver, C3 activation in blood and the activation of complement cascade and inflammation response in the heart tissue, all of which are involved in particle recognition and clearance.
Supplementary material available online.
Supplementary Figure S1 and Supplementary Tables S1-S5.
Supplementary Materials
Download Zip (318.3 KB)Acknowledgements
We thank Michael Guldbrandsen, Lisbeth Meyer Petersen and Eva Terrida for their excellent technical assistance. We also thank Dr Michael Johnston and Dr Jonathan Glen Boucher for their helpful comments on the manuscript.
Declaration of interest
The authors declare that there are no conflicts of interest. This work was supported by the Health Canada's Genomics Research and Development Initiative and Chemicals Management Plan, as well as Danish Centre for Nanosafety, grant # 20110092173-3 and NanoKem, grant # 20060068816, both from the Danish Working Environment Research Foundation.
References
- At Vejledning C. 2007. Grænseværdier for stoffer og materialer. At-vejledning C.0.1. KÃbenhavn. Arbejdstilsynet, 1–84
- Bourdon JA, Halappanavar S, Saber AT, Jacobsen NR, Williams A, Wallin H, et al. 2012. Hepatic and pulmonary toxicogenomic profiles in mice intratracheally instilled with carbon black nanoparticles reveal pulmonary inflammation, acute phase response, and alterations in lipid homeostasis. Toxicol Sci 127:474–84
- Cao Y, Jacobsen NR, Danielsen PH, Lenz AG, Stoeger T, Loft S, et al. 2014. Vascular effects of multiwalled carbon nanotubes in dyslipidemic ApoE−/− mice and cultured endothelial cells. Toxicol Sci 138:104–16
- Carter AM. 2012. Complement activation: an emerging player in the pathogenesis of cardiovascular disease. Scientifica 2012:1–14
- Fabian E, Landsiedel R, Ma-Hock L, Wiench K, Wohlleben W, Van Ravenzwaay B. 2008. Tissue distribution and toxicity of intravenously administered titanium dioxide nanoparticles in rats. Arch Toxicol 82:151–7
- Ferin J, Oberdorster G, Penney DP. 1992. Pulmonary retention of ultrafine and fine particles in rats. Am J Respir Cell Mol Biol 6:535–42
- Geiser M, Kreyling WG. 2010. Deposition and biokinetics of inhaled nanoparticles. Part Fibre Toxicol 7:2
- Geiser M, Rothen-Rutishauser B, Kapp N, Schurch S, Kreyling W, Schulz H, et al. 2005. Ultrafine particles cross cellular membranes by nonphagocytic mechanisms in lungs and in cultured cells. Environ Health Perspect 113:1555–60
- Grassian VH, O'Shaughnessy PT, Adamcakova-Dodd A, Pettibone JM, Thorne PS. 2007. Inhalation exposure study of titanium dioxide nanoparticles with a primary particle size of 2 to 5 nm. Environ Health Perspect 115:397–402
- Halappanavar S, Jackson P, Williams A, Jensen KA, Hougaard KS, Vogel U, et al. 2011. Pulmonary response to surface-coated nanotitanium dioxide particles includes induction of acute phase response genes, inflammatory cascades, and changes in microRNAs: a toxicogenomic study. Environ Mol Mutagen 52:425–39
- Hougaard KS, Jackson P, Jensen KA, Sloth JJ, Loschner K, Larsen EH, et al. 2010. Effects of prenatal exposure to surface-coated nanosized titanium dioxide (UV-Titan). A study in mice. Part Fibre Toxicol 7:16
- Huang da W, Sherman BT, Lempicki RA. 2009. Systematic and integrative analysis of large gene lists using DAVID bioinformatics resources. Nat Protoc 4:44–57
- Husain M, Saber AT, Guo C, Jacobsen NR, Jensen KA, Yauk CL, et al. 2013. Pulmonary instillation of low doses of titanium dioxide nanoparticles in mice leads to particle retention and gene expression changes in the absence of inflammation. Toxicol Appl Pharmacol 269:250–62
- IARC. 2010. Carbon black, titanium dioxide, and talc. IARC Monogr Eval Carcinog Risks Hum 93:1–413
- Jackson P, Halappanavar S, Hougaard KS, Williams A, Madsen AM, Lamson JS, et al. 2013. Maternal inhalation of surface-coated nanosized titanium dioxide (UV-Titan) in C57BL/6 mice: effects in prenatally exposed offspring on hepatic DNA damage and gene expression. Nanotoxicology 7:85–96
- Jackson P, Hougaard KS, Boisen AM, Jacobsen NR, Jensen KA, Moller P, et al. 2012a. Pulmonary exposure to carbon black by inhalation or instillation in pregnant mice: effects on liver DNA strand breaks in dams and offspring. Nanotoxicology 6:486–500
- Jackson P, Hougaard KS, Vogel U, Wu D, Casavant L, Williams A, et al. 2012b. Exposure of pregnant mice to carbon black by intratracheal instillation: toxicogenomic effects in dams and offspring. Mutat Res 745:73–83
- Jackson P, Lund SP, Kristiansen G, Andersen O, Vogel U, Wallin H, Hougaard KS. 2011. An experimental protocol for maternal pulmonary exposure in developmental toxicology. Basic Clin Pharmacol Toxicol 108:202–7
- Janeway CA Jr, Medzhitov R. 2002. Innate immune recognition. Ann Rev Immunol 20:197–216
- Kreyling WG, Semmler M, Erbe F, Mayer P, Takenaka S, Schulz H, et al. 2002. Translocation of ultrafine insoluble iridium particles from lung epithelium to extrapulmonary organs is size dependent but very low. J Toxicol Environ Health A 65:1513–30
- Leblanc AJ, Cumpston JL, Chen BT, Frazer D, Castranova V, Nurkiewicz TR. 2009. Nanoparticle inhalation impairs endothelium-dependent vasodilation in subepicardial arterioles. J Toxicol Environ Health A 72:1576–84
- Leblanc AJ, Moseley AM, Chen BT, Frazer D, Castranova V, Nurkiewicz TR. 2010. Nanoparticle inhalation impairs coronary microvascular reactivity via a local reactive oxygen species-dependent mechanism. Cardiovasc Toxicol 10:27–36
- Levy L, Chaudhuri IS, Krueger N, McCunney RJ. 2012. Does carbon black disaggregate in lung fluid? A critical assessment. Chem Res Toxicol 25:2001–6
- Mercer RR, Scabilloni JF, Hubbs AF, Wang L, Battelli LA, McKinney W, et al. 2013. Extrapulmonary transport of MWCNT following inhalation exposure. Part Fibre Toxicol 10:38
- Mikkelsen L, Sheykhzade M, Jensen KA, Saber AT, Jacobsen NR, Vogel U, et al. 2011. Modest effect on plaque progression and vasodilatory function in atherosclerosis-prone mice exposed to nanosized TiO(2). Part Fibre Toxicol 8:32
- Moller P, Jacobsen NR, Folkmann JK, Danielsen PH, Mikkelsen L, Hemmingsen JG, et al. 2010. Role of oxidative damage in toxicity of particulates. Free Radic Res 44:1–46
- Muhlfeld C, Geiser M, Kapp N, Gehr P, Rothen-Rutishauser B. 2007. Re-evaluation of pulmonary titanium dioxide nanoparticle distribution using the “relative deposition index": evidence for clearance through microvasculature. Part Fibre Toxicol 4:7
- Nemmar A, Hoet PH, Vanquickenborne B, Dinsdale D, Thomeer M, Hoylaerts MF, et al. 2002a. Passage of inhaled particles into the blood circulation in humans. Circulation 105:411–14
- Nemmar A, Hoylaerts MF, Hoet PH, Dinsdale D, Smith T, Xu H, et al. 2002b. Ultrafine particles affect experimental thrombosis in an in vivo hamster model. Am J Respir Crit Care Med 166:998–1004
- Noris M, Remuzzi G. 2013. Overview of complement activation and regulation. Semin Nephrol 33:479–92
- Nurkiewicz TR, Porter DW, Barger M, Millecchia L, Rao KM, Marvar PJ, et al. 2006. Systemic microvascular dysfunction and inflammation after pulmonary particulate matter exposure. Environ Health Perspect 114:412–19
- Oberdorster G, Sharp Z, Atudorei V, Elder A, Gelein R, Lunts A, et al. 2002. Extrapulmonary translocation of ultrafine carbon particles following whole-body inhalation exposure of rats. J Toxicol Environ Health A 65:1531–43
- Renwick LC, Brown D, Clouter A, Donaldson K. 2004. Increased inflammation and altered macrophage chemotactic responses caused by two ultrafine particle types. Occup Environ Med 61:442–7
- Rothen-Rutishauser B, Muhlfeld C, Blank F, Musso C, Gehr P. 2007. Translocation of particles and inflammatory responses after exposure to fine particles and nanoparticles in an epithelial airway model. Part Fibre Toxicol 4:9
- Roursgaard M, Poulsen SS, Poulsen LK, Hammer M, Jensen KA, Utsunomiya S, et al. 2010. Time-response relationship of nano and micro particle induced lung inflammation. Quartz as reference compound. Hum Exp Toxicol 29:915–33
- Saber AT, Jacobsen NR, Mortensen A, Szarek J, Jackson P, Madsen AM, et al. 2012. Nanotitanium dioxide toxicity in mouse lung is reduced in sanding dust from paint. Part Fibre Toxicol 9:4
- Sadauskas E, Danscher G, Stoltenberg M, Vogel U, Larsen A, Wallin H. 2009a. Protracted elimination of gold nanoparticles from mouse liver. Nanomedicine 5:162–9
- Sadauskas E, Jacobsen NR, Danscher G, Stoltenberg M, Vogel U, Larsen A, et al. 2009b. Biodistribution of gold nanoparticles in mouse lung following intratracheal instillation. Chem Central J 3:16
- Sadauskas E, Wallin H, Stoltenberg M, Vogel U, Doering P, Larsen A, Danscher G. 2007. Kupffer cells are central in the removal of nanoparticles from the organism. Part Fibre Toxicol 4:10
- Semmler M, Seitz J, Erbe F, Mayer P, Heyder J, Oberdorster G, Kreyling WG. 2004. Long-term clearance kinetics of inhaled ultrafine insoluble iridium particles from the rat lung, including transient translocation into secondary organs. Inhal Toxicol 16:453–9
- Semmler-Behnke M, Kreyling WG, Lipka J, Fertsch S, Wenk A, Takenaka S, et al. 2008. Biodistribution of 1.4- and 18-nm gold particles in rats. Small (Weinheim an der Bergstrasse, Germany), 4:2108–11
- Semmler-Behnke M, Takenaka S, Fertsch S, Wenk A, Seitz J, Mayer P, et al. 2007. Efficient elimination of inhaled nanoparticles from the alveolar region: evidence for interstitial uptake and subsequent reentrainment onto airways epithelium. Environ Health Perspect 115:728–33
- Takenaka S, Karg E, Kreyling WG, Lentner B, Moller W, Behnke-Semmler M, et al. 2006. Distribution pattern of inhaled ultrafine gold particles in the rat lung. Inhal Toxicol 18:733–40
- Teeguarden JG, Webb-Robertson BJ, Waters KM, Murray AR, Kisin ER, Varnum SM, et al. 2011. Comparative proteomics and pulmonary toxicity of instilled single-walled carbon nanotubes, crocidolite asbestos, and ultrafine carbon black in mice. Toxicol Sci 120:123–35
- Vesterdal LK, Folkmann JK, Jacobsen NR, Sheykhzade M, Wallin H, Loft S, Moller P. 2010. Pulmonary exposure to carbon black nanoparticles and vascular effects. Part Fibre Toxicol 7:33
- Warheit DB, Webb TR, Reed KL, Frerichs S, Sayes CM. 2007. Pulmonary toxicity study in rats with three forms of ultrafine-TiO2 particles: differential responses related to surface properties. Toxicology 230:90–104
- Zolnik BS, Gonzalez-Fernandez A, Sadrieh N, Dobrovolskaia MA. 2010. Nanoparticles and the immune system. Endocrinology 151:458–65