Abstract
This study has evaluated the effects of three industrially relevant multi-walled carbon nanotubes (MWNTs) on human Jurkat T cells and compared them to those of crocidolite asbestos. No overt acute toxicity was observed for all MWNTs tested although signs of oxidative stress were evident. MWNTs did not activate resting Jurkat cells and only slightly stimulated the release of the cytokine interleukin-2 (IL-2) in activated cells. Similar to MWNTs, crocidolite had little toxic effects on Jurkat cells but neither induced the formation of reactive oxygen species nor changes in IL-2 signaling. These findings suggest that, in contrast to many other cell types, T cells are relatively resistant to stress induced by high-aspect ratio particles.
Acknowledgements
This study was supported by grants from the 6th Framework Program of the European Commission (CANAPE; NMP4-CT-2004-500096) and the 7th Framework Program of the European Commission (EC-FP7-NANOMMUNE-214281). We thank Dr P. Hug for his support with the Raman spectroscopic analysis and Prof. Dr B. Fadeel for critical reading of the manuscript.
Declaration of interest: The authors report no conflict of interest. The authors alone are responsible for the content and writing of the paper.
Transmission electron microscopy (TEM) and high-resolution TEM studies of MWNTs were performed on a Philips CM 200 TEM with field emission gun operating at 200 kV. The inner and outer diameter and length distribution of MWNTs were measured on the digital electron micrographs. Scanning electron microscopic analysis (SEM) of MWNTs was performed using a Hitachi scanning electron microscope.
Figure S1. SEM analysis of MWNTs. Micrographs of dry powder of MWNT A (a), MWNT B (b) and MWNT C (c) reveal an intricate network of highly entangled nanotubes. Suspensions of MWNT A (a’), MWNT B (b’), and MWNT C (c’) in 160 ppm Pluronic F127 display single tubes and small agglomerates of up to 2 µm. Scale bar represents 2 µm.
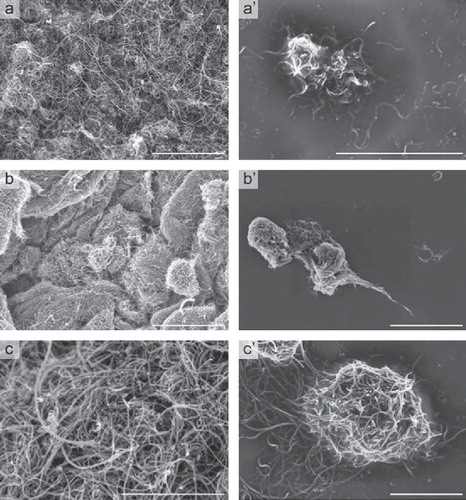
Figure S2. TEM analysis of MWNTs. TEM micrographs of MWNT A (a), MWNT B (b) and MWNT C (c) show the characteristic tubular structure of nanotubes. The concentric layers of graphite typical for MWNTs is apparent in high resolution TEM images of MWNT A (a’), MWNT B (b’) and MWNT C (c’).
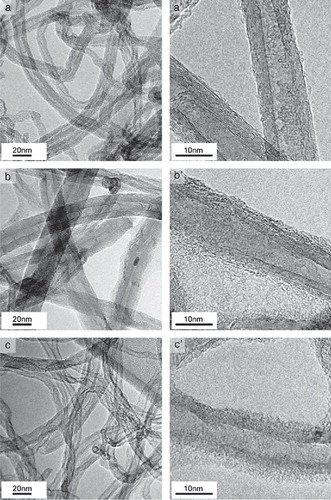
Figure S3. Inner and outer diameter of MWNTs. All three MWNTs show a similar distribution of the inner and outer diameter.
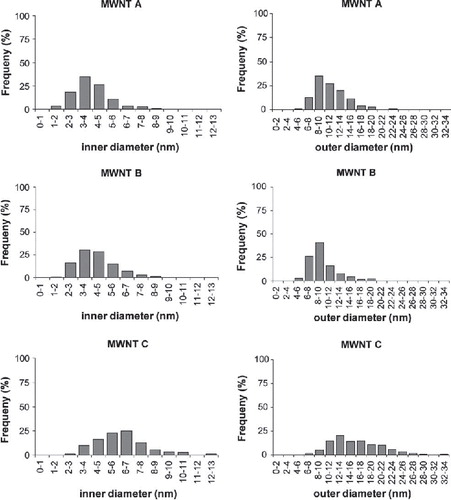
Figure S4. Figure S4. Length distribution of MWNTs. The length of MWNT A and B ranges from 1–5 µm, whereas MWNT C length varies from 1–16 µm.
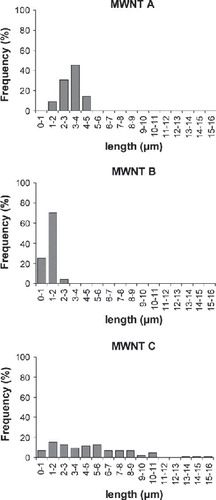
Figure S5. Zeta potential of MWNTs suspended in water, Pluronic F127 or cell culture medium. In medium, the zeta potential of all tubes shifts to a slightly negative value of −6 to −12 mV.
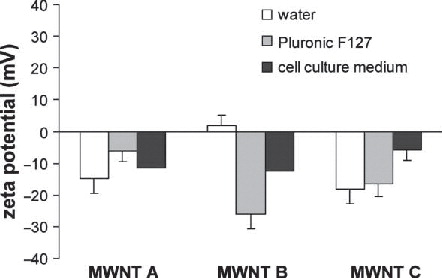
Figure S6. Raman spectra of MWNTs. For all MWNTs, the intensity of the D-band associated with structural defects is higher than the intensity of the G-band corresponding to the in-plane vibration existent in graphene.
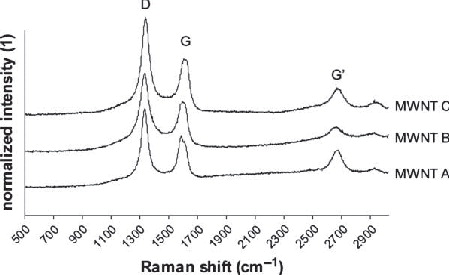
Figure S7. Biocompatibility of Pluronic F127. The non-ionic surfactant Pluronic F127 was added to the cultures at a final concentration of 160 ppm to avoid the formation of agglomerated MWNTs. To exclude that Pluronic F127 interferes with the measurements, we analyzed its effects on the different toxicity tests using concentrations up to 10,000 ppm. Only very high concentrations of Pluronic F127 slightly but significantly reduce Jurkat cell growth (A), increase the percentage of late apoptotic/necrotic cells (B) and inhibit Jurkat cell proliferation (C). Pluronic F127 does not increase the formation of ROS (D) or affect the MMP of Jurkat cells (E). Concerning IL-2 expression, Pluronic F127 only induces a minor increase of IL-2 protein levels after 24 h of exposure in PMA/PHA-activated cells (F). Results represent the mean ± SE from three independent experiments. *p < 0.05 compared to untreated controls.
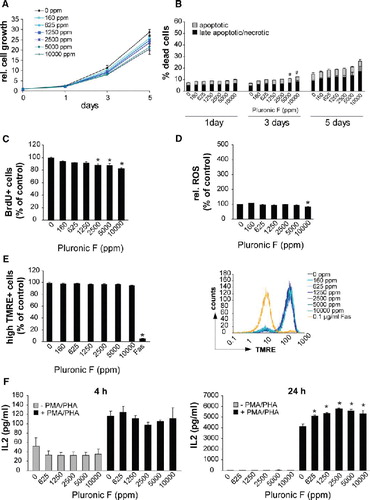
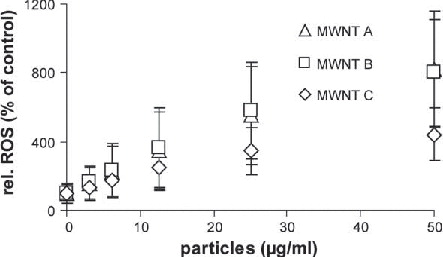
Figure S8. ROS formation of MWNTs in a cell-free system. In the absence of cells all MWNTs induce the formation of ROS after 4 h of incubation.