
Abstract
Background and purpose — The increased use of patient-reported outcomes (PROs) in orthopedics requires data on estimated minimal clinically important improvements (MCIIs) and patient-acceptable symptom states (PASSs). We wanted to find cut-points corresponding to minimal clinically important PRO change score and the acceptable postoperative PRO score, by estimating MCII and PASS 1 year after total hip arthroplasty (THA) for the Hip Dysfunction and Osteoarthritis Outcome Score (HOOS) and the EQ-5D.
Patients and methods — THA patients from 16 different departments received 2 PROs and additional questions preoperatively and 1 year postoperatively. The PROs included were the HOOS subscales pain (HOOS Pain), physical function short form (HOOS-PS), and hip-related quality of life (HOOS QoL), and the EQ-5D. MCII and PASS were estimated using multiple anchor-based approaches.
Results — Of 1,837 patients available, 1,335 answered the preoperative PROs, and 1,288 of them answered the 1-year follow-up. The MCIIs and PASSs were estimated to be: 24 and 91 (HOOS Pain), 23 and 88 (HOOS-PS), 17 and 83 (HOOS QoL), 0.31 and 0.92 (EQ-5D Index), and 23 and 85 (EQ-VAS), respectively. MCIIs corresponded to a 38–55% improvement from mean baseline PRO score and PASSs corresponded to absolute follow-up scores of 57–91% of the maximum score in THA patients 1 year after surgery.
Interpretation — This study improves the interpretability of PRO scores. The different estimation approaches presented may serve as a guide for future MCII and PASS estimations in other contexts. The cutoff points may serve as reference values in registry settings.
In recent years, there has been a shift towards a more patient-centered perspective in orthopedic research and the use of patient-reported outcomes (PROs) has increased (Horan Citation2010, Wylde and Blom Citation2011). This has led to a discussion on how best to interpret PRO results (McLeod et al. Citation2011), because a statistically significant change in PRO score does not necessarily represent a clinically important improvement, and it can be difficult to know if a certain postoperative PRO score is acceptable from the patient’s point of view. Since it can be problematic to interpret change in scores and absolute postoperative scores in a clinically meaningful way (Quintana et al. Citation2012), different cut-points can be determined. One of these cut-points is the minimal clinically important improvement (MCII), a PRO change score value defined as the minimal change representing a clinically important improvement from the patient’s perspective (Tubach et al. Citation2009). Another cut-point is the patient-acceptable symptom state (PASS), a value of the postoperative PRO score found acceptable by the patients, defined as the overall health state at which patients consider themselves to be feeling well (Maksymowych et al. Citation2010). Both MCII and PASS estimations will be of future importance in research and clinical practice because they focus on the patient perspective of total hip arthroplasty (THA). There is a lack of patient-based cut-points in the musculoskeletal literature (Keurentjes et al. Citation2012), and the cut-points may vary depending on context even for a single PRO, making MCII and PASS estimations for THA patients warranted.
Our aim was to find cut-points for the minimal clinically important improvement based on changes in PRO scores and the acceptable postoperative PRO score, by estimating MCII and PASS 1 year after THA for 2 commonly used PROs, the Hip Dysfunction and Osteoarthritis Outcome Score (HOOS) and the EQ-5D. In addition, PASS was estimated for subgroups of age, sex, and diagnosis.
Patients and methods
Data collection
All patients older than 18 years receiving a THA in 16 selected orthopedic departments in Denmark, from March 1, 2010 to March 1, 2011 were invited to participate in the study. Patients with acute fractures were excluded, as they are not comparable to patients undergoing THA for other causes. Preoperative assessment included a disease-specific PRO (HOOS subscale pain (HOOS Pain), HOOS physical function short form (HOOS-PS), and HOOS subscale hip-related quality of life (HOOS QoL)), a generic PRO (EQ-5D), patient information, questionnaire instruction, additional questions regarding patient characteristics, and a written consent form. Only first-completed PROs were included if there was bilateral surgery. 1 year postoperatively, the patients received the same PROs and 3 anchor questions. The postoperative questionnaires were mailed in paper form to the patients by regular post, including a return addressed envelope with a stamp. 2 reminder letters were sent if necessary (CitationEdwards et al. 2009). All returned questionnaire forms were scanned electronically using a validated automated forms-processing technique (Paulsen et al. Citation2012a).
Anchor questions
Anchor questions were used to establish an external patient-reported reference in order to evaluate clinical interpretation of PRO change scores and postoperative PRO scores. The anchor questions had already been used in “Questionnaire for patients who have had hip surgery” from the Royal College of Surgeons of England (Clinical Effectiveness Unit 2009). Since both hip-specific and generic PROs are used to evaluate the outcome following THA, we chose to estimate MCII and PASS for the HOOS and the EQ-5D in comparison to the 2 hip-specific anchor questions. However, since hip-specific PROs cannot be used to assess general health, MCII and PASS in relation to the general-health anchor question were only estimated for the EQ-5D.
Anchor questions used for definition of MCII. A patient-reported hip-specific anchor question describing change in hip problems from preoperatively to 1 year postoperatively was used: “Overall, how are the problems now in the hip on which you had surgery, compared to before your operation?” The 5-point Likert scale response categories were: “Much better”, “A little better”, “About the same”, “A little worse”, and “Much worse”. Change in general health from preoperatively to postoperatively was evaluated by using the question: “In general, would you say your health is...” (Kamper-Jørgensen Citation2005). The 5 point Likert scale response categories were: “Excellent”, “Very good”, “Good”, “Fair”, and “Poor”. Patients were asked to assess their general health status both preoperatively and postoperatively. For MCII estimation, change from preoperatively to postoperatively was calculated and patients answering 1 category better postoperatively than preoperatively were considered to be reporting a minimal clinically important improvement in general health (Tubach et al. Citation2005, Hays et al. Citation2005). For the MCII estimation, we used both a retrospective transition anchor and an absolute change anchor (Tubach et al. Citation2005), to circumvent the recall bias known to be a problem for retrospective anchors (King Citation2011).
Anchor questions used for definition of PASS. A hip-specific anchor question describing the patients’ perception of outcome after surgery was used: “How would you describe the result of your operation?” There were 5 response options: “Excellent”, “Very good”, “Good”, “Fair”, and “Poor”. Patients answering “Excellent”, “Very good” or “Good” were considered to be reporting a hip-specific acceptable symptom state 1 year after THA. The general-health PASS estimation was based on the patient-reported postoperative general health status, using the same anchor question as for the general-health MCII estimation: “In general, would you say your health is...” (Kamper-Jørgensen Citation2005). If a patient answered “Excellent”, “Very good” or “Good” for the postoperative general health anchor question, he or she was considered to have an acceptable general health state 1 year after THA.
The PROs
Both the HOOS and the EQ-5D are feasible to use in large-scale studies of THA (Paulsen et al. Citation2012b).
HOOS and HOOS-PS. Hip dysfunction and Osteoarthritis Outcome Score (HOOS) (Nilsdotter et al. Citation2003) is a hip-specific questionnaire constructed by adding questions considered important by patients (concerning pain, sport and recreation, function, hip-related quality of life, and other symptoms) to the WOMAC (Bellamy et al. Citation1988) to improve its validity for those with less severe disease or higher demands of physical function. The HOOS includes 5 subscales: Pain, Other Symptoms, Function in Daily Living, Function in Sport and Recreation, and Hip-related Quality of Life. HOOS-PS is a 5-question short version derived using Rasch analysis (Rasch Citation1960) from the 2 HOOS subscales addressing physical function (ADL and Sport/Rec) by using data from samples representing a spectrum of osteoarthritis (OA) severity (Davis et al. Citation2008b). The HOOS-PS has been validated for use in THA (Davis et al. Citation2008a). For the purpose of our study, 3 different HOOS subscales were used: HOOS Pain, HOOS-PS, and HOOS QoL. A score of 100 within each subscale indicates no problems and 0 indicates extreme problems. A user guide and a scoring manual are available at http://www.koos.nu/index.html.
EQ-5D. EQ-5D (The EuroQol Group 1990, Brooks Citation1996) is a well-established generic health outcome measure specially designed to complement other quality-of-life measures, or disease-specific outcome measures, and it has also been used for economic evaluation of healthcare for several years (Dawson et al. Citation2001, Linde Citation2009, Rolfson Citation2010). Patients describe their own health state in 5 dimensions: mobility, self-care, usual activities, pain/discomfort, and anxiety/depression on 1 out of 3 levels of severity: no problems, some/moderate problems, or extreme problems. Patients are also asked to evaluate their current state of health on a thermometer scale from 0 (‘worst imaginable’) to 100 (‘best imaginable’). EQ-5D generates 2 overall values for quality of life, one from the patient’s perspective (the EQ-VAS: “Current state of health”) and the other from a societal perspective, the EQ-5D Index (a health profile that can be transformed into a global health index with a weighted total value for health-related quality of life), which represent the patients’ description of their own health and how this health state relates to the health state of the general population. A Danish tariff ranging from –0.624 (worst) to 1.000 (best) (Wittrup-Jensen et al. Citation2009), based on time trade-off (Dolan and Roberts Citation2002), was used when computing the EQ-5D Index to adjust for culture-specific response patterns. A license was obtained from the EuroQol Group (http://www.euroqol.org/).
Statistics
No percentages (only numbers) are presented where n < 100. Any p-value less than 0.05 was considered significant. We used chi-square test and Wilcoxon-Mann-Whitney test to compare characteristics of patients who accepted or declined study participation. The correlation between the change anchor questions and the change scores for the PRO subscales for MCII and the correlation between the postoperative anchor questions and the postoperative scores for the PRO subscales for PASS were tested with Spearman’s rank correlation coefficients. The proportions (%) of patients reporting the different response categories for the anchor questions and the corresponding PRO change scores and postoperative PRO scores were calculated. PASS for subgroups of different age groups, sex, and diagnoses were estimated. The mean PRO change scores for the different subgroups were calculated for all patients (not only patients answering “a little better” for the hip-improvement anchor or all patients answering 1 category better postoperatively than preoperatively for the general-health anchor). t-based confidence intervals (CIs) were used, as samples were of adequate size (n > 30) for the central limit theorem to apply and since visual inspection revealed reasonably symmetric distributions in the few smaller groups (n ≥ 15, see Supplementary data, Tables 6 and 7). MCII values for subgroups were not estimated due to small subgroups. Depending on the number of subgroups, Welch’s t-test or a so-called W test (similar to standard ANOVA F test) (Wilcox et al. Citation1986, Mitchell Citation2000), both allowing for unequal variances across groups, was used for comparison of means between subgroups. Absolute scores of the different HOOS subscales, EQ-5D Index, and EQ-VAS were calculated preoperatively and postoperatively for each individual patient, as well as change scores from preoperatively to postoperatively. In addition, mean preoperative and postoperative PRO scores and mean change scores for the entire study population were calculated. Missing data were handled in accordance with the manual for each EQ-5D and HOOS (Roos Citation2003, Cheung Kajang et al. Citation2009).
MCII and PASS cut-points. 6 different methods were used to estimate MCII and PASS cut-points. First, cut-points were estimated by the mean change or mean score approach (de Vet et al. Citation2011). This was regarded as the primary approach. Secondly, cut-points were estimated by the seventy-fifth percentile approach (Tubach et al. Citation2005, Maksymowych et al. Citation2007, Kvien et al. Citation2007, Heiberg et al. Citation2008, Kvamme et al. Citation2010, Dougados et al. Citation2012). Thirdly, cut-points were estimated by the seventy-fifth percentile approach using tertiles (lowest-, middle-, and highest subscale scores) of the preoperative PRO scores (Tubach et al. Citation2006), to avoid misclassifying those with baseline scores only allowing for minor improvements (Davis et al. Citation2012). Fourthly, cut-points were estimated from receiver operating characteristic (ROC) curves using the 80% specificity rule (Aletaha et al. Citation2009, Kvamme et al. Citation2010). Fifth, cut-points were estimated from ROC curves using the cut-point corresponding to the smallest residual sum of sensitivity and specificity (Froud Citation2002, Maksymowych et al. Citation2007, Heiberg et al. Citation2008, Dougados et al. Citation2012). Sixth, cut-points were estimated by ROC curves using the cut-point corresponding to a 45-degree tangent line intersection (equivalent to the point at which the sensitivity and specificity are closest together) (Froud Citation2002).
An identical procedure was applied using the general-health anchor questions and EQ-5D. Percentile-based 95% confidence intervals (CIs) for cut-points were estimated by non-parametric bootstrap (Fiellin and Feinstein Citation1998, Campbell and Torgerson Citation1999) using 2,000 replications ( and ), because of some small groups (n < 30) in the tertile estimations. The area under the curve, AUC, (with CI) was calculated for the 3 methods using ROC curves. A correlation of at least 0.3 between the PRO scores and the anchor questions was considered adequate for applying the ROC methods (King Citation2011). Patients answering “A little better” were considered to be reporting a minimal clinically important improvement, as this is the standard methodology (King Citation2011), but where the AUC estimation of the ROC curves (Fawcett Citation2006) was below the proposed minimum of 0.523 (Kvamme et al. Citation2010), patients answering “A little better” or “Much better” were pooled into 1 group. STATA software Version 11.0 was used for all statistical analyses.
Ethics
The study was approved by the Danish National Board of Health and the Danish Data Protection Agency (journal number 2008-41-2593 and 2012-41-1368), whereas acceptance by the Science Ethics Committee of the Region of Southern Denmark was not required. All the patients gave their informed written consent to participate in the study.
Results
Description of the study population
Responders and non-responders. 1,335 of 1,837 patients (73%) agreed to participate in the study (). Patients who declined study participation were older than those who were included (median age 70 years vs. 68 years (p < 0.001)), and they were less likely to have the diagnosis idiopathic osteoarthritis (84% vs. 90%, p = 0.001) (). 1,288 of 1,335 patients (96%) answered the postoperative questionnaire ().
Figure 1. Patient flow chart.
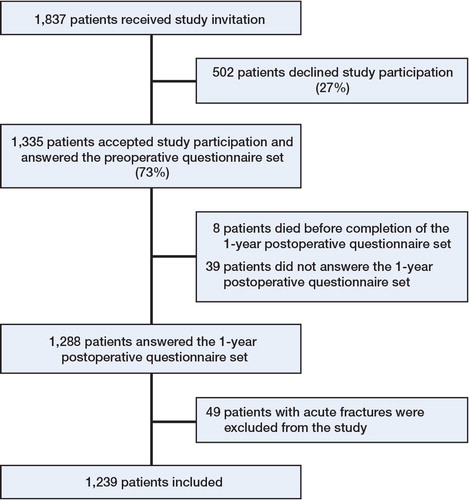
Table 1. Characteristics of the 1,837 patients who received an invitation to participate in the study in the period from March 1, 2010 to March 1, 2011
Missing items. Missing items occurred in 13 to 140 items (1–11%) of the different items in the questionnaires. Preoperative total scores could be calculated as follows: 98% for HOOS Pain, 98% for HOOS-PS, 99% for HOOS QoL, 95% for EQ-5D Index, and 98% for EQ-VAS according to rules for missing items. Postoperatively, total scores could be calculated as follows: 96% for HOOS Pain, 97% for HOOS-PS, 97% for HOOS QoL, 95% for EQ-5D Index, and 96% for EQ-VAS.
PRO scores. Distributions of preoperative and postoperative PRO scores are given in Figure 2 (see Supplementary data). Mean (CI) for the PRO scores pre- and postoperatively and change scores are given in Table 5 (see Supplementary data).
Proportions reporting different response options for the anchor questions. When responding to the MCII anchor question “Overall, how are the problems now in the hip on which you had surgery, compared to before your operation?”, most patients (88%) considered themselves much improved and 77 patients (6%) considered themselves a little improved 1 year after THA (Table 6, see Supplementary data). Regarding the anchor question “In general, would you say your health is…”, 34% reported 1 step better general health postoperatively as compared to preoperatively and 11% reported 2 or more steps better general health (Table 7, see Supplementary data).
Regarding PASS, postoperatively 92% of the patients described the results of their operation as at least good: “Excellent” (53%), “Very good” (27%), or “Good” (12%). A total of 82% of the patients described their general health as at least good: “Excellent” (12%), “Very good” (35%), or “Good” (35%) at 1 year postoperatively in contrast to 68% before surgery (“Excellent” (44 patients, 3%), “Very good” (24%) or “Good” (41%)). 338 patients (27%) reported scores for all 3 HOOS subscales at or above the “Much better” cut-point, and 881 patients (71%) reported scores for all 3 HOOS subscales at or above the “A little better” cut-point. PRO change scores, mean preoperative scores, and mean postoperative scores for different anchor answer categories are given in Figures 3 and 4 (see Supplementary data).
Correlation of PROs and anchor questions
The correlations between the hip-specific anchor used for MCII estimation and the PRO change scores were higher than 0.30 (p < 0.001) for all PRO subscales, except for the EQ-5D Index (–0.27; p < 0.001) and EQ-VAS (–0.25; p < 0.001). The correlations between the general-health anchor used for MCII estimation and the PRO change scores were higher than 0.30 for EQ-VAS (0.35; p < 0.001), but that for EQ-5D Index was 0.27 (p < 0.001). The correlations between both the hip-specific anchor and the general-health anchor used for PASS estimation and the postoperative PRO scores were higher than 0.50 for all PRO subscales (p < 0.001), except for the correlation between the hip-specific anchor and EQ-VAS (–0.48; p < 0.001) (Table 8, see Supplementary data).
MCII cut-points for PRO change scores
MCII cut-points for HOOS based on the mean score change method and the hip-specific anchor question “Overall, how are the problems in your hip now compared to preoperatively?” were 24 (CI: 21–29) for HOOS Pain, 23 (CI: 19–30) for HOOS-PS, and 17 (CI: 13–21) for HOOS QoL (). Thus, an improvement of 24 points in the HOOS Pain subscale corresponds to the minimal improvement in pain considered clinically important by THA patients. Estimates based on the 5 other calculation methods (the seventy-fifth percentile approach (all patients and by tertiles), the 80% specificity rule, the 45-degree tangent line intersection cut-point, and the cut-point corresponding to the smallest residual sum of sensitivity and specificity) are presented in . The estimated MCII cut-points for EQ-5D Index and EQ-VAS based on a general-health anchor were 0.31 (CI: 0.29–0.33) and 23 (CI: 21–25), respectively (). The MCII was dependent on baseline score, as lower tertiles corresponded to higher MCII for all PROs ().
Table 2. Minimal clinically important improvement (MCII) for HOOS and EQ-5D. Values are cut-point (95% CI) or AUC f
PASS cut-points for postoperative PRO scores
PASS cut-points for the HOOS subscales when answering “Excellent”, “Very good”, or “Good” to the question “How would you describe the results of your operation?” were 91 (CI: 91–92) for HOOS Pain, 88 (CI: 87–88) for HOOS-PS, and 83 (CI: 82–84) for HOOS QoL ().
Table 3. Patient–acceptable symptom state (PASS) for HOOS and EQ–5D. Values are cut-point (95% CI) or AUC f
Thus, a postoperative score of 91 in the HOOS Pain subscale corresponds to a symptom state considered acceptable 1 year after THA. The cut-points representing PASS when reporting the general health postoperatively were 0.92 (CI: 0.91–0.92) for EQ-5D Index and 85 (CI: 84–86) for EQ-VAS (). The PASS was independent of baseline score for all PROs, since identical PASSs were achieved for the different tertiles of baseline scores.
Subgroup estimations. The gender-dependent differences in favor of males in mean postoperative scores ranged from 4–5 points on a 0–100 scale for the HOOS subscales and the EQ-VAS (p < 0.001), with no significant differences in PRO change scores between males and females (p ≥ 0.3). Patients with idiopathic OA had significantly better postoperative PRO scores than patients with other diagnoses (4–11 points on a 0–100 scale for the HOOS subscales and the EQ-VAS; p ≤ 0.03), with no significant differences in PRO change scores (p ≥ 0.06). Patients over 70 years had the worst mean PRO change scores for HOOS Pain, HOOS-PS, and EQ-VAS (3–11 points less than other age groups; p ≤ 0.003). For HOOS-PS and EQ-VAS, the oldest also had the worst postoperative mean scores (4–5 points less; p ≤ 0.002). Males had higher PASS estimates than females (p ≤ 0.04), OA patients had higher PASS estimates for HOOS QoL and EQ-5D Index than other patients (p ≤ 0.008), and patients over 70 years had lower PASS estimates than younger patients for HOOS Pain, HOOS-PS, and EQ-VAS (p ≤ 0.03) ().
Table 4. Patient–acceptable symptom state (PASS) for different subgroups; mean (95% CI)
Discussion
We aimed to establish THA patients’ viewpoints on clinically important improvements and acceptable symptom state cut-points based on changes in PRO scores and postoperative PRO scores. A better understanding of these cut-points would contribute to our interpretation of change in PRO scores and postoperative PRO scores following orthopedic procedures. Our results, showing that MCII varied with baseline score and that PASS varied with gender, diagnosis (for HOOS QoL and EQ-5D Index), and age (for HOOS Pain, HOOS-PS, and EQ-VAS), support current understanding that there is a range of values influenced by factors such as patient group, intervention, time to follow–up, and methodological issues including cut-point chosen for the anchor question—and also choice of anchor-based methods or distribution-based methods (King Citation2011).
MCII
In earlier reports, MCII for EQ-5D has been found to vary considerably (0–0.69) in patients with rheumatoid arthritis, psoriatic arthritis, and ankylosing spondylitis after 3 months of treatment with disease-modifying anti-rheumatic drugs, indicating that MCII is dependent on patient group (Kvamme et al. Citation2010). In addition, the mean MCII for the EQ-5D Index was on average 0.074 (range –0.011 to 0.140) in 8 longitudinal studies with 11 patient groups (hip OA or THA patients not included) (Walters and Brazier Citation2005). This confirms that there are no universal cut-points for a single PRO, as the estimates will vary by population and context (King Citation2011), which is supported by the present study. An MCII of 15 of 100 for absolute improvement has been recommended for 4 different generic PROs in chronic rheumatic diseases (Tubach et al. Citation2012). The smaller MCII recommended by Tubach et al. (compared to our study) can be explained by the different patient populations (chronic rheumatic diseases vs. THA patients), the different interventions (non-steroidal anti-inflammatory drugs vs. THA), and the much longer follow-up time of 1 year in our study as compared to 4 weeks. Our finding of an MCII of 0.31 for the EQ-5D Index corresponds well with previous findings of 0.32 (anchor-based methods, identical anchors, and estimation approach) and 0.42 (distribution-based methods) for THA patients 6 months after surgery (Browne et al. Citation2007). We found that the MCII was dependent on baseline score, and it is likely that the poorer patient scores (for instance, for QoL or general health) prior to the THA, the more they may gain from the operation (Figure 4, see Supplementary data) (Tubach et al. Citation2006, Quintana et al. Citation2012).
Many similar terms and definitions related to the minimal important difference have been used (King Citation2011). We have used MCII, which is similar to the minimal clinically important difference, except that MCII only addresses the direction of improvement and not worsening (Tubach et al. Citation2009). We calculated MCII estimates by several approaches and the mean change approach was considered the primary approach, as this is robust and may seem more intuitive and more easy to interpret than the complex ROC approaches (de Vet et al. Citation2007). We used a hip-specific anchor for MCII for the hip-specific PROs as recommended (Revicki et al. Citation2008, Shi et al. Citation2010), because there should be a theoretical basis for the relationship between the anchor and the relevant domain (King Citation2011). For the same reason, the general-health anchor was regarded to be the most important for the EQ-5D MCII estimation. The EQ-VAS had an adequate correlation to the general-health anchor. The EQ-5D Index time trade-off valuation methodology has recently been criticized for lacking validity (Augestad and Rand-Hendriksen Citation2012), which may explain our finding of the EQ-5D Index’s suboptimal correlation to both the general-health anchor and the hip-specific anchor. By using different anchor questions, different concepts are examined; a smaller change in PRO score is important for the patient when reporting hip improvement, compared to a substantially larger change in PRO score that is required to make an impact on the minimal important improvement in the patient’s general health. When estimating MCII after THA, hip-specific or general-health anchors should be chosen based on whether the PRO is a hip-specific or a general-health outcome measure, but also depending on whether the focus is determining hip improvement after THA or determining the impact of THA on general health.
Due to the overall good results from THA, an important question is whether “A little better” is a clinically relevant outcome 1 year after THA; considering the costs and risks of the procedure, patients could be expected to be “Much better”. A high proportion of the patients indeed got “Much better”, but a lesser improvement was acknowledged to be clinically important also, because an MCII cut-point estimation based solely on “Much better” would take 73% of the patients below the MCII cut-point in at least 1 HOOS subscale, which is clearly too many and would reduce the clinical value of this cut-point. MCIIs were estimated for patients who reported being “A little better”, but also for patients answering “A little better” or “Much better” combined, where the AUC estimations of the ROC curves were below the proposed minimum (Kvamme et al. Citation2010), and the results were similar (). In Figures 3 and 4 (see Supplementary data), HOOS Pain and EQ-5D Index are shown as examples to illustrate mean scores for the different answer categories in comparison to a hip-specific anchor and a general-health anchor, respectively.
PASS
To our knowledge, there have been no previous PASS estimations for HOOS and EQ-5D using THA patients. PASS for rheumatoid arthritis patients has been estimated to be around 0.70 in EQ-5D Index in patients after 3 months of treatment with disease-modifying anti-rheumatic drugs (Kvamme et al. Citation2010). PASS has been reported to be 40 of 100 for absolute improvement, in different generic PROs in patients with chronic rheumatic diseases (Tubach et al. Citation2012). The smaller PASSs found in these studies may be explained by the different interventions and the different patient populations. Patients’ expectations for an acceptable symptom state may be higher in THA patients due to the intervention itself, and chronic rheumatic patients may have a lower threshold for an acceptable symptom state due to the nature of their disease.
PASS was found to be independent of baseline scores, which is supported by a previous study (Escobar et al. Citation2012). It has been noted that the methodology for identification of PASS may influence the identified cut-points, and that the ROC approach generally provides estimates that are somewhat lower than the cut-points identified with the seventy-fifth percentile approach (Kvien et al. Citation2007), similar to what was seen in our data. For THA patients, the operation result and the postoperative general health seem to be equally dependent on the intervention. The THA has to eliminate most of the patient’s symptoms for patients to achieve an acceptable symptom state, since PASS is quite close to the best possible score for the PROs studied. Others have found a greater change from preoperative to postoperative evaluation in both EQ-5D Index and EQ-VAS than in our study (Browne et al. Citation2007, Chard et al. Citation2011, Rolfson et al. Citation2011). This can be explained by our patients having better preoperative (and postoperative) scores, and therefore less potential for improvement (Table 5, see Supplementary data).
Limitations and strengths. Several methodological limitations should be taken into consideration when interpreting the results of the present study. Patients who declined to participate in the study were on average 2 years older and more seldom operated due to idiopathic OA than the patients who were included. There was a higher percentage of idiopathic OA patients in our study population than in the Danish THA population, which may have reduced the external validity of the study, but the mean age and proportion of women in our study are very similar to figures for the total Danish THA population. The feasibility of the PROs included has previously been assessed in a THA population (Paulsen et al. Citation2012b), but the additional questions included were not psychometrically validated as a part of this study. 2 of the anchor questions were translated from English without a formal cross-cultural validation. As previously reported by others (Jansson and Granath Citation2010), EQ-5D Index had a bi-modal distribution in our data, introducing more uncertainties in our results than described by the confidence intervals and p-values. EQ-5D Index had anchor correlations of less than 0.30 for both the hip-specific change anchor and the general-health change anchor. This is a limitation of the EQ-5D Index MCII estimation. The suboptimal correlation between EQ-5D Index and the general-health anchor may well be an artifact from the time trade-off valuation process, as this process not only includes the patients’ descriptions of their own health, but also how this health state is perceived by the general population. For all other MCII estimations, the anchor-PRO correlations were moderate, but below 0.50. MCII estimations were based on a retrospective transition anchor for HOOS and an absolute change anchor (postoperative score – baseline score) (Hays et al. Citation2005, Tubach et al. Citation2005) for EQ-5D, and the use of different anchor types for different PROs could be viewed as a limitation.
Despite the minor differences in patient characteristics, we consider the results to have high external validity due to the inclusion of approximately 15% of the entire Danish THA production of 2010 from 16 centers dispersed all over Denmark, centers with both low and high production, public as well as private, and both university hospitals and community hospitals. MCII and PASS estimations were based on hip-specific anchors for hip-specific HOOS subscales and on general-health anchors for the general-health focused EQ-5D Index and EQ-VAS. Several estimation approaches were used, and all estimations are reported ( and ). In all PASS estimations, the anchor-PRO correlations were over 0.50, except for the EQ-VAS (–0.48).
Conclusion
Using a population-based cohort design, we determined cut-points for the change representing the MCII and for the postoperative score representing the PASS 1 year after THA for HOOS Pain, HOOS-PS, HOOS QoL, EQ-5D Index, and EQ-VAS. This study facilitates interpretability of PRO scores and may improve understanding of PRO findings in future THA outcome studies. MCIIs corresponded to a 38–55% improvement from mean baseline PRO score and PASSs corresponded to absolute follow-up scores of 57–91% of the maximum score in THA patients 1 year after surgery, which may serve as reference values in registry settings.
Supplementary Material
Download PDF (470 KB)AP, EMR, ABP, and SO participated in the design of the study, analysis of data, and in writing of the manuscript. AP prepared the raw data.
We thank statistician Ingvild Dalen, MSc, PhD, Stavanger University Hospital, for statistical support.
EMR is a member of the HOOS development group; the other authors have no potential competing interests. This study was funded by Region Syddanmark, Gigtforeningen, Syddansk Universitet, Familien Hede Nielsens Legat, Bauers Legat, Clara Hansens Mindelegat and Ryholts Legat. The sources of funding did not play a role in the investigation.
- Aletaha D, Funovits J, Ward MM, Smolen JS, Kvien TK. Perception of improvement in patients with rheumatoid arthritis varies with disease activity levels at baseline. Arthritis Care Res 2009; (61): 313-20.
- Augestad LA, Rand-Hendriksen K. Influence of construct-irrelevant factors and effects of methodological choices on EQ-5D health state valuation. 2012. Oslo, Norway, Faculty of Medicine, University of Oslo.
- Bellamy N, Buchanan WW, Goldsmith CH, Campbell J, Stitt LW. Validation study of WOMAC: a health status instrument for measuring clinically important patient relevant outcomes to antirheumatic drug therapy in patients with osteoarthritis of the hip or knee. J Rheumatol 1988; (15): 1833-40.
- Brooks R. EuroQol: the current state of play. Health Policy 1996; (37): 53-72.
- Browne J, Jamieson L, Lewsey J, van der Meulen J, Black N, Cairns J, Lamping D, Smith S, Copley L, Horrocks J. Patient Reported Outcome Measures (PROMs) in Elective Surgery. Report to the Department of Health 2007; 24-4-0013.
- Campbell MK, Torgerson DJ. Bootstrapping: estimating confidence intervals for cost-effectiveness ratios. QJM 1999; 92: 177-82.
- Chard J, Kuczawski M, van der Meulen J. Patient outcomes in surgery. A report comparing independent sector treatment centres and NHS providers. POiS Audit Steering Committee, Clinical Effectiveness Unit, The Royal College of Surgeons of England 2011; 24-4-0013.
- Cheung Kajang, Oemar Mandy, Oppe Mark, Rabin Rosalin. EQ-5D User Guide. Basic information on how to use EQ-5D. Version 2.0. March 2009. 2009. The EuroQoL Group.
- Clinical Effectiveness Unit. Questionnaire for patients who have had hip surgery. 2009. POIS Audit, The Royal College of Surgeons of England.
- Davis AM. The development of a short measure of physical function for hip OA HOOS-Physical Function Shortform (HOOS-PS): an OARSI/OMERACT initiative. 2008.
- Davis AM, Perruccio AV, Cañizares M, Hawker GA, Roos EM, Lohmander LS. Comparative Evaluation of Validity and Responsiveness of the HOOS-PS/KOOS-PS and WOMAC Following Total Joint Replacement. 2008a. OARSI, Rome, Italy, September 2008.
- Davis AM, Perruccio AV, Canizares M, Tennant A, Hawker GA, Conaghan PG, Roos EM, Jordan JM, Maillefert JF, Dougados M, Lohmander LS. The development of a short measure of physical function for hip OA HOOS-Physical Function Shortform (HOOS-PS): an OARSI/OMERACT initiative. Osteoarthritis Cartilage 2008b; 16: 551-9.
- Davis AM, Perruccio AV, Lohmander LS. Minimally clinically important improvement: all non-responders are not really non-responders an illustration from total knee replacement. Osteoarthritis Cartilage 2012; 20: 364-7.
- Dawson J, Fitzpatrick R, Frost S, Gundle R, Lardy-Smith P, Murray D. Evidence for the validity of a patient-based instrument for assessment of outcome after revision hip replacement. J Bone Joint Surg (Br) 2001; 83: 1125-9.
- de Vet HC, Ostelo RW, Terwee CB, van der RN, Knol DL, Beckerman H, Boers M, Bouter LM. Minimally important change determined by a visual method integrating an anchor-based and a distribution-based approach. Qual Life Res 2007; 16: 131-42.
- de Vet HC, Terwee CB, Mokkink L, Knol DL. Interpretability. In: Measurements in medicine- Practical guides to biostatistics and epidemiology. Cambridge: Cambridge University Press, 2011; 227-68.
- Dolan P, Roberts J. Modelling valuations for Eq-5d health states: an alternative model using differences in valuations. Med Care 2002; 40: 442-6.
- Dougados M, Brault Y, Logeart I, van der Heijde D, Gossec L, Kvien T. Defining cut-off values for disease activity states and improvement scores for patient-reported outcomes: the example of the Rheumatoid Arthritis Impact of Disease (RAID). Arthritis Res Ther 2012; 14: R129.
- Edwards PJ, Roberts I, Clarke MJ, Diguiseppi C, Wentz R, Kwan I, Cooper R, Felix LM, Pratap S. Methods to increase response to postal and electronic questionnaires. Cochrane Database Syst Rev 2009;MR000008.
- Escobar A, Gonzalez M, Quintana JM, Vrotsou K, Bilbao A, Herrera-Espineira C, Garcia-Perez L, Aizpuru F, Sarasqueta C. Patient acceptable symptom state and OMERACT-OARSI set of responder criteria in joint replacement. Identification of cut-off values. Osteoarthritis Cartilage 2012; 20: 87-92.
- Fawcett T. An introduction to ROC analysis. Pattern Recognition Letters 2006; 27: 861-74.
- Fiellin DA, Feinstein AR. Bootstraps and jackknives: new, computer-intensive statistical tools that require no mathematical theories. J Investig Med 1998; 46: 22-6.
- Froud RJ. ROCMIC: Stata module to estimate minimally important change (MIC) thresholds for continuous clinical outcome measures using ROC curves. 2002. Computer program. http://EconPapers.repec.org/RePEc:boc:bocode:s457052.
- Hays RD, Farivar SS, Liu H. Approaches and Recommendations for Estimating Minimally Important Differences for Health-Related Quality of Life Measures. COPD 2005; 2: 63-7.
- Heiberg T, Kvien TK, Mowinckel P, Aletaha D, Smolen JS, Hagen KB. Identification of disease activity and health status cut-off points for the symptom state acceptable to patients with rheumatoid arthritis. Ann Rheum Dis 2008; 67: 967-71.
- Horan FT. Joint registries. Editorial. J Bone Joint Surg (Br) 2010; 92: 749-50.
- Jansson KA, Granath F. Health-related quality of life (EQ-5D) before and after orthopedic surgery. Acta Orthop 2010; 82: 82-9.
- Kamper-Jørgensen F. Danskernes sundhed 2005 Skema 2. 2005. Statens Institut for Folkesundhed, Socialforskningsinstituttet.
- Keurentjes JC, Van Tol FR, Fiocco M, Schoones JW, Nelissen RG. Minimal clinically important differences in health-related quality of life after total hip or knee replacement. Bone Joint Res 2012; 1: 71-7.
- King MT. A point of minimal important difference (MID): a critique of terminology and methods. Expert Rev Pharmacoeconomics Outcomes Res 2011; 11: 171-84.
- Kvamme MK, Kristiansen IS, Lie E, Kvien TK. Identification of Cutpoints for Acceptable Health Status and Important Improvement in Patient-Reported Outcomes, in Rheumatoid Arthritis, Psoriatic Arthritis, and Ankylosing Spondylitis. J Rheumatology 2010; 37: 26-31.
- Kvien TK, Heiberg T, Hagen KB. Minimal clinically important improvement/difference (MCII/MCID) and patient acceptable symptom state (PASS): what do these concepts mean? Ann Rheum Dis (Suppl 3) 2007; 66: iii40-iii41.
- Linde L. Health-related quality of life in patients with rheumatoid arthritis A comparative validation of selected measurement instruments. 2009. Copenhagen, Denmark, Department of Rheumatology, Hvidovre Hospital, Faculty of Health Sciences, University of Copenhagen.
- Maksymowych WP, Richardson R, Mallon C, van der Heijde D, Boonen A. Evaluation and validation of the patient acceptable symptom state (PASS) in patients with ankylosing spondylitis. Arthritis Care Res 2007; 57: 133-9.
- Maksymowych WP, Gooch K, Dougados M, Wong RL, Chen N, Kupper H, van der HD. Thresholds of patient-reported outcomes that define the patient acceptable symptom state in ankylosing spondylitis vary over time and by treatment and patient characteristics. Arthritis Care Res (Hoboken) 2010; 62: 826-34.
- McLeod LD, Coon CD, Martin SA, Fehnel SE, Hays RD. Interpreting patient-reported outcome results: US FDA guidance and emerging methods. Expert Rev Pharmacoeconomics Outcomes Res 2011; 11: 163-9.
- Mitchell MN. wtest. 2000. Statistical Computing and Consulting, UCLA, Academic Technology Services.
- Nilsdotter AK, Lohmander LS, Klassbo M, Roos EM. Hip disability and osteoarthritis outcome score (HOOS)–validity and responsiveness in total hip replacement. BMC Musculoskelet Disord 2003; 4: 10.
- Paulsen A, Overgaard S, Lauritsen JM. Quality of data entry using single entry, double entry and automated forms processing. An example based on a study of patient-reported outcomes. PLoS ONE 2012a; 7: e35087.
- Paulsen A, Pedersen AB, Overgaard S, Roos EM. Feasibility of 4 patient-reported outcome measures in a registry setting. Acta Orthop 2012b; 8): 321-7.
- Quintana JM, Aguirre U, Barrio I, Orive M, Garcia S, Escobar A. Outcomes after total hip replacement based on patients’ baseline status: What results can be expected? Arthritis Care Res 2012; 64: 563-72.
- Rasch G. Probabilistic model for some intelligence and attainment tests. University of Chicago Press,Chicago 1960.
- Revicki D, Hays RD, Cella D, Sloan J. Recommended methods for determining responsiveness and minimally important differences for patient-reported outcomes. J Clin Epidemiol 2008; 61: 102-9.
- Rolfson O. Patient-reported outcome measures and health-economic aspects of total hip arthroplasty. A study of the Swedish Hip Arthroplasty Register. 2010. Institute of Clinical Sciences at Sahlgrenska Academy, University of Gothenburg. 10-12-2010.
- Rolfson O, Karrholm J, Dahlberg LE, Garellick G. Patient-reported outcomes in the Swedish Hip Arthroplasty Register: Results of a nationwide prospective observational study. J Bone Joint Surg (Br) 2011; 93: 867-75.
- Roos EM. A User’s Guide to: Hip disability and Osteoarthritis Outcome Score HOOS. Updated May 2008. 2003.
- Shi HY, Chang JK, Wong CY, Wang JW, Tu YK, Chiu HC, Lee KT. Responsiveness and minimal important differences after revision total hip arthroplasty. BMC Musculoskeletal Disorders 2010; 11: 261.
- The EuroQol Group. EuroQol–a new facility for the measurement of health-related quality of life. Health Policy 1990; 16: 199-208.
- Tubach F, Ravaud P, Baron G, Falissard B, Logeart I, Bellamy N, Bombardier C, Felson D, Hochberg M, van der Heijde D, Dougados M. Evaluation of clinically relevant changes in patient reported outcomes in knee and hip osteoarthritis: the minimal clinically important improvement. Ann Rheum Dis 2005; 64: 29-33.
- Tubach F, Dougados M, Falissard B, Baron G, Logeart I, Ravaud P. Feeling good rather than feeling better matters more to patients. Arthritis Care Res 2006; 55: 526-30.
- Tubach F, Giraudeau B, Ravaud P. The variability in minimal clinically important difference and patient acceptable symptomatic state values did not have an impact on treatment effect estimates. J Clin Epidemiol 2009; 62: 725-8.
- Tubach F, Ravaud P, Martin-Mola E, Awada H, Bellamy N, Bombardier C, Felson DT, Hajjaj-Hassouni N, Hochberg M, Logeart I, Matucci-Cerinic M, van de Laar M, van der Heijde D, Dougados M. Minimum clinically important improvement and patient acceptable symptom state in pain and function in rheumatoid arthritis, ankylosing spondylitis, chronic back pain, hand osteoarthritis, and hip and knee osteoarthritis: Results from a prospective multinational study. Arthritis Care Res 2012; 64: 1699-707.
- Walters SJ, Brazier JE. Comparison of the minimally important difference for two health state utility measures: EQ-5D and SF-6D. Qual Life Res 2005; 14: 1523-32.
- Wilcox RR, in VL, Thompson KL. New monte carlo results on the robustness of the anova f, w and f statistics. Communications in Statistics - Simulation and Computation 1986; 15: 933-43.
- Wittrup-Jensen KU, Lauridsen J, Gudex C, Pedersen KM. Generation of a Danish TTO value set for EQ-5D health states. Scand J Public Health 2009; 37: 459-66.
- Wylde V, Blom AW. The failure of survivorship. Editorial. J Bone Joint Surg (Br) 2011; 93: 569-70.