
Abstract
Background and purpose — The self-reported foot and ankle score (SEFAS) is a questionnaire designed to evaluate disorders of the foot and ankle, but it is only validated for arthritis in the ankle. We validated SEFAS in patients with forefoot, midfoot, hindfoot, and ankle disorders.
Patients and methods — 118 patients with forefoot disorders and 106 patients with hindfoot or ankle disorders completed the SEFAS, the foot and ankle outcome score (FAOS), SF-36, and EQ-5D before surgery. We evaluated construct validity for SEFAS versus FAOS, SF-36, and EQ-5D; floor and ceiling effects; test-retest reliability (ICC); internal consistency; and agreement. Responsiveness was evaluated by effect size (ES) and standardized response mean (SRM) 6 months after surgery. The analyses were done separately in patients with forefoot disorders and hindfoot/ankle disorders.
Results — Comparing SEFAS to the other scores, convergent validity (when correlating foot-specific questions) and divergent validity (when correlating foot-specific and general questions) were confirmed. SEFAS had no floor and ceiling effects. In patients with forefoot disorders, ICC was 0.92 (CI: 0.85–0.96), Cronbach's α was 0.84, ES was 1.29, and SRM was 1.27. In patients with hindfoot or ankle disorders, ICC was 0.93 (CI: 0.88-0.96), Cronbach's α was 0.86, ES was 1.05, and SRM was 0.99.
Interpretation — SEFAS has acceptable validity, reliability, and responsiveness in patients with various forefoot, hindfoot, and ankle disorders. SEFAS is therefore an appropriate patient- reported outcome measure (PROM) for these patients, even in national registries.
In Sweden (with 9 million inhabitants), more than 20,000 elective foot and ankle surgical procedures were done annually during the period 2007–2009. There is a need for structured evaluation of disability before and after surgery. Subjective aspects of patients’ symptoms should be one part of this evaluation, preferably captured by patient-reported outcome measures (PROMs). Apart from being valid and reliable, such a measure must also be simple, patient-friendly, and usable in all types of foot and ankle disorders (Suk Citation2009). There are several PROMs, either generic or foot- and ankle-specific questionnaires, but there is no gold standard. The generic questionnaires short form 36 (SF-36) (Sullivan et al.Citation1995, Patel et al. Citation2007) and EuroQol (EQ-5D) (Euroqol Group Citation1990) are useful for evaluation of general health, but they are of less value for region-specific disability. The foot and ankle outcome score (FAOS), a foot- and ankle-specific questionnaire (Roos et al. Citation2001), is only validated for ankle instability and a limited number of foot disorders, and is therefore not optimal for use in registries covering all kinds of disabilities of the foot and ankle. The FAOS contains 42 questions; this is too long. The American Orthopaedic Foot and Ankle Society score (AOFAS) (Kitaoka et al. Citation1994), another well-known and well-used region-specific score, includes a clinical examination and is therefore not a PROM. Based on the validated Oxford-12 questionnaire for total hip replacement (Dawson et al. Citation1996), the New Zealand National Joint Registry constructed a patient-reported ankle questionnaire (Hosman et al. Citation2007). This questionnaire has been culturally adapted and translated into Swedish, and then called the self-reported foot ankle score (SEFAS). In the first validation study, SEFAS was found to be a valuable PROM in patients with osteoarthritis (OA) or inflammatory arthritis in the ankle joint (Coster et al. Citation2012). But SEFAS must also be validated in patients with forefoot, midfoot, and hindfoot disorders—and also in patients with other diagnoses of the ankle joint—before it can be used in a national registry. We evaluated the psychometric properties of SEFAS in terms of reliability, validity, and responsiveness in patients with forefoot, midfoot, hindfoot, and ankle disorders.
Patients and methods
The self-reported foot and ankle score (SEFAS)
SEFAS is a foot- and ankle-specific questionnaire based on the New Zealand total ankle questionnaire (Hosman et al. Citation2007). The latter was translated into Swedish, culturally adapted, and validated with good results in patients with OA or inflammatory disease of the ankle joint (Coster et al. Citation2012, www.swedankle.se). The questionnaire contains 12 items with 5 response options. The questionnaire covers different constructs, which are not reported separately in subscales. The most important of these constructs are pain, function, and limitation of function. Each of the 12 multiple-choice questions scores from 0 to 4 where a sum of 0 points represents the most severe disability and 48 represents normal function. In cases of incomplete questionnaires in the SEFAS, we used the following approach: (1) when results from 2 or more questions were missing, the questionnaire was disregarded; (2) when the result from 1 question was missing, the mean result of the remaining 11 questions was used; (3) when the patients gave 2 answers for 1 question, the worse outcome was recorded; and (4) when the patients had put a mark between 2 answers, the worse outcome was recorded.
The foot and ankle outcome score (FAOS)
FAOS is a region-specific score calculated from a patient-reported 42-item questionnaire developed for foot- and ankle-related disability (Roos et al. Citation2001). The FAOS covers 5 separately reported dimensions: (1) pain, (2) other symptoms, (3) activities of daily living (ADL), (4) function in sport and recreation, and (5) ankle-related quality of life (QoL). Each question is rated on a scale from 0 to 4. A score is calculated for each subscale, after which raw scores for each subscale are transformed to a scale ranging from 0 to 100 and presented graphically as the FAOS profile.
The Short Form 36 (SF-36) score
SF-36 is a validated generic score calculated from a questionnaire that contains 36 items (Sullivan et al. Citation1995, Patel et al. Citation2007). The score was developed for measurement of health-related quality of life, and the questionnaire is widely used for evaluation of patients with a variety of different diseases, including musculoskeletal disorders. The SF-36 measures 8 different dimensions of health.The minimum possible score of each dimension is 0 points and the maximum possible score is 100 points.
The EuroQol (EQ-5D) score
The EQ-5D is a generic patient-reported questionnaire developed for measurement of health outcome and quality of life (Euroqol Group Citation1990), and it is applicable to a wide range of health conditions and treatments. The EQ-5D has 2 parts—the EQ-5D questionnaire and the EQ visual analog scale (EQ VAS). The questionnaire covers 5 different dimensions: (1) mobility, (2) self-care, (3) usual activities, (4) pain and discomfort, and (5) anxiety/depression. We used the UK EQ-5D Tariff for transformation of the results to a single summary index, ranging from –0.56 to 1.0. The EQ VAS assesses an individual's rating of their current state of health on a vertical visual analog scale, ranging from 0 to 100.
Patients
To answer the 4 different questionnaires, we had a group of consecutively recruited patients. We recruited 96 women and 22 men with forefoot disorders and a median age of 57 (16–87) years, and 59 women and 47 men with midfoot, hindfoot or ankle disorders and a median age of 55 (18–81) years. They had all been scheduled for foot or ankle surgery at the orthopedic departments in Kalmar or Eksjö, Sweden, during the period January 1, 2011 to January 31, 2013 (). Only 9 of the patients were planned for surgery of the midfoot, and for that reason we included them in the hindfoot/ankle group. In 19 patients with a hindfoot/ankle disorder, we also measured the time the patients used to complete the different questionnaires. In 37 of the patients with forefoot disorders and 52 of the patients with hindfoot/ankle disorders, we provided the questionnaires twice before surgery with a week apart, in order to test reliability and agreement. In 68 of the patients with forefoot disorders and 74 of the patients with hindfoot/ankle disorders, we also provided the questionnaires 6 months after surgery in order to evaluate responsiveness.
Table 1. Patient data
Informed written consent was obtained from the participants. The study was approved by the ethics committee of Lund University, Sweden (2009/698) and was performed in accordance with the Declaration of Helsinki.
Evaluation of the scores
Validity is the degree to which a score actually measures what it is intended to measure.
Content validity evaluates the extent to which the concepts of interest are represented by the different items in the questionnaire, and it is also an assessment of the patients’ perceptions of the relevance of the questionnaire. To examine the content validity, we applied the general recommendations for creation of questionnaires (Terwee et al. Citation2007). First, the questions were discussed in a group of orthopedic surgeons, physiotherapists, and nurses. Then we let a group of patients discuss the different questions, one by one, together with a research nurse. After adopting the suggestions from the groups, minor changes in the text of the questionnaire were made; we did not have to exclude or add any questions. The questionnaire was then given to 10 patients with different hindfoot disabilities. None of the volunteers reported any difficulty in understanding or completing the questionnaire, and no further changes were made. Finally, we let 40 patients with forefoot disorders grade each question from 1 to 3 where 1 point represented an unimportant question, 2 an important question, and 3 a very important question to examine the relevance of the questions, in order to evaluate content validity. The questions with an average score ≥ 2 were considered relevant, with good content validity.
Construct validity concerns the extent to which a score relates to other scores (Terwee et al. Citation2007, de Groot et al. Citation2008). In the absence of a gold standard, the validity in this study was expressed in terms of construct validity, calculated with Spearman’s correlation coefficient and Pearson’s correlation coefficient, when SEFAS was compared to FAOS, SF-36 and EQ-5D. According to recommendations from Terwee et al. (Citation2007), construct validity was assessed by testing hypotheses concerning correlations between the scores specified in advance. We defined the construct validity as being good if > 75% of our own defined hypotheses could be confirmed.
For convergent validity, we formulated 5 hypotheses. When comparing SEFAS against the FAOS subscales pain, ADL, and QoL, and also the SF-36 subscales bodily pain (BP) and physical functioning (PF), the correlation coefficient should be ≥ 0.60 for a strong correlation (de Groot et al. Citation2008). We also hypothesized that SEFAS would show stronger correlation with these 3 FAOS subscales than with the 2 SF-36 subscales.
For discriminant validity, we formulated 3 hypotheses. When comparing SEFAS against SF-36 GH, RE, and mental health (MH), the correlation coefficient should be ≤ 0.30 for a weak correlation (de Groot et al. Citation2008). We also hypothesized that for all the other comparisons between SEFAS and SF-36, the EQ-5D, and FAOS, other subscales should show correlation coefficients between 0.30 and 0.60 (moderate correlation). For evaluation of the construct of major interest, i.e. pain and function in SEFAS, we related the pain-specific and function-specific questions separately to specific subscales in the other scores.
Floor and ceiling effects are considered to be present when more than 15% of the individuals reach the highest or lowest possible numeric value of a score. A high floor or ceiling effect could make it difficult to measure changes after interventions such as surgery (Terwee et al. Citation2007, Wamper et al. Citation2010).
Reliability shows the reproducibility of a score. We evaluated test-retest reliability by letting the patients complete the questionnaires twice: the first time about 1 week before surgery, and the second time on the day before or on the day of surgery, but always before the surgery. We used intra-class correlation coefficient (ICC) with a 2-way mixed model to evaluate test-retest reliability. The ICC is considered to be good at 0.70 and above (Streiner and Norman Citation2008). However, reliability also includes internal consistency, as an estimate of the extent to which the specific questions within a score are correlated to each other. Cronbach’s α (CA) was used to test internal consistency and the widely accepted cutoff for CA at 0.70 was used (Streiner and Norman Citation2008).
Agreement involves the measurement error of a score. The 2 sets of questionnaires described above were used for the evaluation of agreement, and data was prepared as Bland-Altman plots, 1 plot for each group. These plots show the difference between the SEFAS score in the 2 questionnaires answered by the same patient. Intra-individual variability of the functional measures was expressed as standard error of a single determination (Smethod), and is shown together with the coefficient of variation (CoV in %) for all scores. The formula used was Smethod = √ (Σdi 2 / (2n)), where di is the difference between the ith paired measurement and n is the number of differences.
Responsiveness is the ability of a score to detect changes due to an intervention such as surgery. We included all patients who had completed the questionnaires before and 6 months after surgery. To test responsiveness, we used effect size (ES) and standardized response mean (SRM). ES is calculated as the difference between the means before and after treatment divided by the standard deviation (SD) of the same measure before treatment. Cohen (Citation1978) defined an ES of 0.20 as small, 0.50 as moderate, and of 0.80 or greater as large. SRM is calculated as the difference between the means before and after treatment divided by the SD of the change. SRM values are generally lower than the corresponding ES values (Liang Citation1995).
Statistics
The statistics related to validity, reproducibility, reliability, agreement, and responsiveness are described under each paragraph above. For the construct validity calculations we used both Spearman’s and Pearson’s correlation equation.
We calculated the 95% confidence interval (CI) for the correlations according to Fisher’s z-transformation. We calculated the confidence intervals for ES and SRM according to the method described by CitationBecker (1998). These confidence intervals were calculated assuming a normal distribution. All comparisons were done separately for patients with forefoot disorders and patients with hindfoot/ankle disorders. We used SPSS software version 17.0.
Results
The 40 patients who estimated the relevance of the 12 questions rated them between 2 and 2.8, with a mean value of 2.6, indicating good content validity. The 19 patients with whom the time to complete the questionnaires was measured completed SEFAS twice as quickly as they completed FAOS and SF-36, but not as fast as they completed EQ5D ().
Regarding construct validity, SEFAS mainly measures pain and function, with the strongest correlations being found between SEFAS and the subscales in FAOS and SF-36 that measure these constructs. In patients with forefoot and hindfoot/ankle disorders, 80% of our predefined hypotheses were confirmed, and there were strong correlations between SEFAS and 4 of the 5 subscales in FAOS, with correlation coefficients higher than 0.60, and also between SEFAS and SF-36 subscales BP and PF. The correlations between SEFAS and SF-36 GH, SF-36 RE, and SF-36 MH were weak in patients with forefoot disability and moderate in patients with hindfoot/ankle disability, with correlation coefficients of ≤ 0.30 and 0.30–0.60 respectively. The correlation coefficients between the pain-specific questions in SEFAS and the FAOS subscale pain and SF-36 BP were 0.8 and 0.7, respectively, in forefoot patients and 0.8 and 0.7, respectively, in hindfoot/ankle patients. In forefoot patients, the correlation coefficients between the function-specific questions in SEFAS on the one hand and FAOS subscale ADL and SF-36 PF on the other were 0.7 and 0.7, respectively, and in hindfoot/ankle patients the corresponding values were 0.6 and 0.7. None of the patients reached the highest or lowest numeric values in the SEFAS score, indicating that there were no floor or ceiling effects ( and ).
Table 2. Validity, reliability, and measurement error of 4 different questionnaires evaluating patients with forefoot disorders. Correlation analyses compared SEFAS with the other questionnaires. Data are presented as mean with 95% confidence interval (CI), as standard deviation (SD), or as percentage (%). Agreement is presented as Smethod with CV% witihin brackets
Table 3. Validity, reliability, and measurement error of 4 different questionnaires evaluating patients with hindfoot or ankle disorders. Correlation analyses compared SEFAS and the other questionnaires. The time it took to complete the questionnaires is presented for the different questionnaires. Data are presented as mean with 95% confidence interval (CI), as standard deviation (SD), or as percentage (%). Agreement is presented as Smethod with CV% witihin brackets
In forefoot patients, ICC for SEFAS was 0.92 (CI: 0.85–0.96) and in hindfoot/ankle patients it was 0.93 (CI: 0.88–0.96), indicating a high degree of reliability. For SEFAS in forefoot patients, Cronbach’s α was 0.84 and in hindfoot/ankle patients it was 0.86—also supporting high reliability. The Bland-Altman plots showed clinically negligible systematic error (no bias). There were no major differences when comparing low and high SEFAS values, and the difference between 2 measurements stayed within ± 7 scoring units (). The measurement error analyses with the Smethod also expressed as the coefficient of variation (CV) for all scores are presented in and . For SEFAS, in forefoot patients ES was 1.29 (CI: 0.95–1.63) and in hindfoot/ankle patients it was 1.05 (CI: 0.77–1.33). The corresponding values for SRM were 1.27 (CI: 0.93–1.61) and 0.99 (CI: 0.71–1.27), indicating high responsiveness ( and ).
Agreement in scores of patients with forefoot disorders (n = 37) and of patients with hindfoot or ankle disorders (n = 52) for SEFAS presented as Bland-Altman plots (Bland and Altman 1986). The solid line represents the mean value and the dotted lines show the limits for 2 standard deviations (SDs) above and below the mean value.
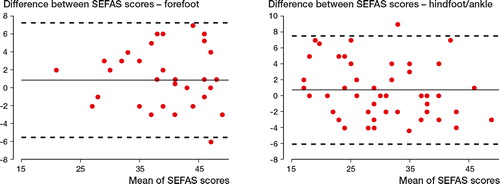
Table 4. Pre- and postoperative values in 68 patients operated due to forefoot disorders, with responsiveness expressed as effect size (ES) and standardized response mean (SRM). Data are presented as mean with 95% confidence interval. Due to missing answers in some questionnaires, the numbers of fully filled questionnaires are presented in parentheses in the left-hand column (n)
Table 5. Pre- and postoperative values in 68 patients operated on due to hindfoot or ankle disorders, with responsiveness expressed as effect size (ES) and standardized response mean (SRM). Data are presented as mean with 95% confidence interval. Due to missing answers in some questionnaires, the numbers of fully filled questionnaires are presented in the left-hand column (n)
Discussion
We found that SEFAS has good validity, reliability, and responsiveness when evaluating patients with forefoot disorders and hindfoot/ankle disorders. The questionnaire—which has already been validated in patients with ankle OA and inflammatory disease in the ankle joint (Coster et al. Citation2012)—can now also be recommended as a valuable PROM when evaluating patients with different disorders of the foot and ankle. As SEFAS can be completed in a shorter time than FAOS and SF-36, it is more attractive to patients.
Several psychometric criteria must be fulfilled before a questionnaire can be rated as having good validity (Bremander et al. Citation2003, Terwee et al. Citation2007). We found that validity for SEFAS was comparable or better than that for the other questionnaires evaluated. When comparing SEFAS and the region-specific FAOS, we found strong correlations in all of the FAOS subscales, except the subscale Sport and Recreation. The correlation between SEFAS and the FAOS subscale for Sport and Recreation was also low for the ankle in our previous study (Coster et al. Citation2012), suggesting that FAOS captures sports-specific deficits better whereas SEFAS may reflect everyday activity better. We also found convergent validity when comparing SEFAS with pain- and function-related questions in SF-36. For the forefoot, there was (as hypothesized) divergent validity when we compared SEFAS to general health-related questions, but in hindfoot/ankle patients the correlations were moderate. One explanation for this would be that patients with neurological disorders, in whom general and mental health is more affected, were in this group. Finally, we found stronger correlations between SEFAS and EQ-5D than we had hypothesized, and the reason for this could be that pain is decisive in this score. In our previous study, we also found high correlations when comparing SEFAS to EQ-5D (Coster et al. Citation2012).
To be able to capture changes in subjective symptoms, the answer to each question in a PROM must be translatable into a numeric score with the potential to increase if the patient gets better (as after surgery) or to decrease if he or she gets worse. To capture any changes in severity of symptoms, floor and ceiling effects should be minimized. Initially, FAOS was validated for ankle ligament reconstructions (Roos et al. Citation2001). Recently, it was also validated for hallux valgus patients by Chen et al. (Citation2012), who found ceiling effects for the subscales ADL and Sports and Recreation. We also found floor and ceiling effects for FAOS in the subscale Sport and Recreation, and in the subscales RP, SF, and RE of SF-36. The lack of floor or ceiling effects in SEFAS speaks in favor of this questionnaire.
SEFAS had good test-retest reliability, with an ICC of > 0.70 both in patients with forefoot disorders and in those with hindfoot/ankle disorders. The internal consistency was also good, with Cronbach’s α values of 0.83 in patients with forefoot disorders and 0.86 in patients with hindfoot/ankle disorders. In the ideal questionnaire, each question should capture 1 specific deficit because 2 or more questions capturing the same deficit would only mean unnecessary work for the patient without providing any new information. The Cronbach’s α values for SEFAS indicated that each question actually captures different deficits, i.e. Cronbach’s α was not too high.
Responsiveness in the region-specific FAOS and SEFAS was better than in the generic SF-36 and EQ-5D. FAOS has recently been reported to have low responsiveness for the subscales ADL and Sports and Recreation in patients with hallux valgus (Chen et al. Citation2012), and for the subscales ADL, Symptoms, and Sports and Recreation in patients with acquired flatfoot deformity (Mani et al. Citation2013). For SEFAS, the responsiveness was high for all types of patients and we even found higher ES and SRM in patients with forefoot disability than in patients with hindfoot/ankle disability. The reason for this is probably that patients who have undergone surgery for forefoot disorders have reached full recovery after 6 months, while patients with hindfoot/ankle surgery—which is known to have longer recovery periods—have not. It would therefore have been preferable with an even longer follow-up period for the responsiveness analysis. Even so, an ES of > 1.0 in both the forefoot patients and hindfoot/ankle patients indicates that SEFAS is very capable of capturing changes in symptoms after foot and ankle surgery.
There are several foot- and ankle-specific questionnaires. The FAOS, a questionnaire translated into several languages (Goksel et al. Citation2009), has been validated for patients with ankle ligament reconstructions (Roos et al. Citation2001), with hallux valgus (Chen et al. Citation2012), and with acquired flatfoot deformity (Mani et al. Citation2013). The high ceiling effects and low responsiveness in some of the subscales in FAOS make it less usable. The visual analog scale of the foot and ankle (VAS FA) is a validated German questionnaire that has also been translated into English and that shows good correlation with SF-36 (Richter et al. Citation2006). However, since to our knowledge the reliability, content validity, and responsiveness have never been reported, the questionnaire cannot be considered to be a fully validated PROM.
The foot function index (FFI) (Budiman-Mak et al. Citation1991) is another PROM; it was initially validated in patients with rheumatoid arthritis. The FFI has been revised, giving several validated versions—a concern discussed by Naal et al. (Citation2010) in a review of outcome instruments for total ankle arthroplasties. Agel et al. (Citation2005) also found high ceiling effects for the FFI, which is a disadvantage. The Manchester-Oxford foot questionnaire (MOXQ) is a 16-item well-validated questionnaire with 3 scales. When we presented the SEFAS data for the ankle joint, MOXQ was only validated for hallux valgus (Dawson et al. Citation2006), but the questionnaire has now also been validated with good results for other foot and ankle disorders (Dawson et al. Citation2012). However, the MOXQ has not been translated and validated in Swedish, and can therefore not be used in a Swedish national registry.
By far the most used score is the AOFAS (Kitaoka et al. Citation1994, Lau et al. Citation2005, Pena et al. Citation2007), but this score has been questioned (SooHoo et al. Citation2003, Baumhauer et al. Citation2006). Also, the AOFAS involves 4 different questionnaires depending on which region of the foot and ankle has to be evaluated, and the score requires a time- and resource-consuming clinical examination. Because of this, the AOFAS cannot be used as a PROM.
The strength of our study was the structural evaluation of a variety of factors such as the reliability, validity, and responsiveness of SEFAS compared to those of other established foot- and ankle-specific and generic questionnaires. Furthermore, the inclusion of a variety of diagnoses and surgical procedures also increased the value of the study. It would, however, have been of advantage to include patients with acute foot and ankle disorders, with separate evaluations of hindfoot and ankle disorders, of specific diagnoses, of the forefoot disorders in different subgroups, and of specific surgical procedures. However, collection of large enough groups for subgroup analyses is difficult and is probably not possible before the questionnaire is used in a registry. Another limitation of our study was that the responsiveness analyses were done only once, and already after 6 months. It would have been advantageous to follow responsiveness for a longer time.
We conclude that SEFAS is a patient-reported questionnaire with good psychometric properties for evaluation of patients with different disorders and surgical procedures of the forefoot, the hindfoot, and the ankle joint. It is a PROM that can be used in national foot and ankle registries.
MC, MK, AB, and ÅC: study design, data collection, literature search, analysis of data, and manuscript preparation. BR: analysis of data and manuscript preparation. HM: data collection and manuscript preparation.
We thank Lars Brudin and Jan-Åke Nilsson for all their help with statistics. We also thank Anna Pettersson and Emil Kilander for all their help in collecting patient data. The study was supported by grants from Region Skåne, ALF, SUS Hospital Foundations, the Kock Foundation, and the Herman Järnhardt Foundation.
No competing interests declared.
- Agel J, Beskin JL, Brage M, Guyton GP, Kadel NJ, Saltzman CL, et al. Reliability of the Foot Function Index: A report of the AOFAS Outcomes Committee. Foot Ankle Int 2005; 26 (11): 962-7.
- Baumhauer JF, Nawoczenski DA, DiGiovanni BF, Wilding GE. Reliability and validity of the American Orthopaedic Foot and Ankle Society Clinical Rating Scale: a pilot study for the hallux and lesser toes. Foot Ankle Int 2006; 27 (12): 1014-9.
- Becker BJ. Synthesizing standardized mean change measures. Br J Math Stat Psychol 1988; 41: 257-78.
- Bremander AB, Petersson IF, Roos EM. Validation of the Rheumatoid and Arthritis Outcome Score (RAOS) for the lower extremity. Health Qual Life Outcomes 2003; 1: 55.
- Budiman-Mak E, Conrad KJ, Roach KE. The Foot Function Index: a measure of foot pain and disability. J Clin Epidemiol 1991; 44 (6): 561-70.
- Chen L, Lyman S, Do H, Karlsson J, Adam SP, Young E, et al. Validation of foot and ankle outcome score for hallux valgus. Foot Ankle Int 2012; 33 (12): 1145-55.
- Cohen J. Statistical power analysis for the behavioral sciences. Academic Press, New York 1978.
- Coster M, Karlsson MK, Nilsson JA, Carlsson A. Validity, reliability, and responsiveness of a self-reported foot and ankle score (SEFAS). Acta Orthop 2012; 83 (2): 197-203.
- Dawson J, Fitzpatrick R, Carr A, Murray D. Questionnaire on the perceptions of patients about total hip replacement. J Bone Joint Surg (Br) 1996; 78 (2): 185-90.
- Dawson J, Coffey J, Doll H, Lavis G, Cooke P, Herron M, et al. A patient-based questionnaire to assess outcomes of foot surgery: validation in the context of surgery for hallux valgus. Qual Life Res 2006; 15 (7): 1211-22.
- Dawson J, Boller I, Doll H, Lavis G, Sharp R, Cooke P, et al. Responsiveness of the Manchester-Oxford Foot Questionnaire (MOXFQ) compared with AOFAS, SF-36 and EQ-5D assessments following foot or ankle surgery. J Bone Joint Surg (Br) 2012; 94 (2): 215-21.
- de Groot IB, Favejee MM, Reijman M, Verhaar JA, Terwee CB. The Dutch version of the Knee Injury and Osteoarthritis Outcome Score: a validation study. Health Qual Life Outcomes 2008; 6: 16.
- Euroqol Group. EuroQol-a new facility for the measurement of health-related quality of life. The EuroQol Group. Health Policy 1990; 16 (3): 199-208.
- Goksel Karatepe A, Gunaydin R, Kaya T, Karlibas U, Ozbek G. Validation of the Turkish version of the foot and ankle outcome score. Rheumatol Int 2009; 30 (2): 169-73.
- Hosman AH, Mason RB, Hobbs T, Rothwell AG. A New Zealand national joint registry review of 202 total ankle replacements followed for up to 6 years. Acta Orthop 2007; 78 (5): 584-91.
- Kitaoka HB, Alexander IJ, Adelaar RS, Nunley JA, Myerson MS, Sanders M. Clinical rating systems for the ankle-hindfoot, midfoot, hallux, and lesser toes. Foot Ankle Int 1994; 15 (7): 349-53.
- Lau JT, Mahomed NM, Schon LC. Results of an Internet survey determining the most frequently used ankle scores by AOFAS members. Foot Ankle Int 2005; 26 (6): 479-82.
- Liang MH. Evaluating measurement responsiveness. J Rheumatol 1995; 22 (6): 1191-2.
- Mani SB, Brown HC, Nair P, Chen L, Do HT, Lyman S, et al. Validation of the foot and ankle outcome score in adult acquired flatfoot deformity. Foot Ankle Int 2013; 34 (8): 1140-6.
- Naal FD, Impellizzeri FM, Rippstein PF. Which are the most frequently used outcome instruments in studies on total ankle arthroplasty? Clin Orthop 2010; (468) (3): 815-26.
- Patel AA, Donegan D, Albert T. The 36-item short form. J Am Acad Orthop Surg 2007; 15 (2): 126-34.
- Pena F, Agel J, Coetzee JC. Comparison of the MFA to the AOFAS outcome tool in a population undergoing total ankle replacement. Foot Ankle Int 2007; 28 (7): 788-93.
- Richter M, Zech S, Geerling J, Frink M, Knobloch K, Krettek C. A new foot and ankle outcome score: Questionnaire based, subjective, Visual-Analogue-Scale, validated and computerized. Foot Ankle Surg 2006; 12 (4): 191-9.
- Roos EM, Brandsson S, Karlsson J. Validation of the foot and ankle outcome score for ankle ligament reconstruction. Foot Ankle Int 2001; 22 (10): 788-94.
- SooHoo NF, Shuler M, Fleming LL. Evaluation of the validity of the AOFAS Clinical Rating Systems by correlation to the SF-36. Foot Ankle Int 2003; 24 (1): 50-5.
- Streiner D, Norman G. Health measurement scales: a practical guide to their developement and use. New York: Oxford University Press; 2008.
- Suk M. Musculoskeletal Outcomes measures and Instruments. AO Foundation; 2009.
- Sullivan M, Karlsson J, Ware JE. The Swedish SF-36 Health Survey–I. Evaluation of data quality, scaling assumptions, reliability and construct validity across general populations in Sweden. Soc Sci Med 1995; 41 (10): 1349-58.
- Terwee CB, Bot SD, de Boer MR, van der Windt DA, Knol DL, Dekker J, et al. Quality criteria were proposed for measurement properties of health status questionnaires. J Clin Epidemiol 2007; 60 (1): 34-42.
- Wamper KE, Sierevelt IN, Poolman RW, Bhandari M, Haverkamp D. The Harris hip score: Do ceiling effects limit its usefulness in orthopedics? Acta Orthop 2010; 81 (6): 703-7.