
Abstract
Background and purpose — The continuously increasing demand for joint replacement surgery in the past decades imposes higher constraints on the budgets of hospitals and healthcare providers. We undertook an analysis of historical trends in total hip replacement performed in Sweden between 1968 and 2012 in order to provide projections of future demand.
Data and methods — We obtained data on total hip replacements registered every year and on the evolution of the Swedish population between 1968 and 2012. We assumed the existence of a maximum incidence. So we adopted a regression framework that assumes the existence of an upper limit of total hip replacement incidence.
Results — We found that the incidence of total hip replacement will continue to increase until a projected upper incidence level of about 400 total hip replacements per 105 Swedish residents aged 40 years and older will be reached around the year 2107. In 2020, the estimated incidence of total hip replacement will be 341 (95% prediction interval (PI): 302–375) and in 2030 it will be 358 (PI: 317–396). Using official forecasted population growth data, about 18,000 operations would be expected to be performed in 2020 and 20,000 would be expected to be performed in 2030.
Interpretation — Growing incidence, population growth, and increasing life expectancy will probably result in increased demand for hip replacement surgery. Our findings could serve as a basis for decision making.
Osteoarthritis is a leading cause of disability in the elderly. Patients with osteoarthritis contribute to higher annual healthcare-related costs than those without (Kotlarz et al. Citation2009, Berger et al. Citation2011). Increase in life expectancy and ageing populations are expected to make osteoarthritis the fourth leading cause of disability by the year 2020 (Woolf and Pfleger Citation2003). Thus, the demand for joint replacement surgery due to osteoarthritis will grow, imposing higher constraints on the budgets of hospitals and healthcare providers. Decision-makers and insurers require reliable and accurate projections of future demand, for proper budgeting and fair allocation of resources. Increased demand for joint replacements also creates an increased need for surgeons trained and experienced in joint replacement surgery, which in turn requires educational planning at universities and hospitals.
Recent studies have forecast a continuously increasing demand for both hip and knee replacement (Kurtz et al. Citation2007a). Primary osteoarthritis, the leading determinant of total hip replacement (THR), has a more or less age-specific occurrence and a relatively low incidence in the general population. Thus, the existence of a maximum incidence is a natural assumption. This must be built into any analysis for the statistical model to be adequate (Turner et al. Citation1961). Analysis of incidence rather than the total number of THRs allows not only projections of future demand, but also an estimate of the highest expected incidence of total hip replacement. In this study, we undertook an analysis of historical trends in THR performed in Sweden between 1968 and 2012. Our first aim was to forecast the incidence of THR operations in Sweden in the coming decades. The second aim was to estimate the expected maximum incidence of THR operations in Sweden.
Data and methods
Ethics
Ethics committee approval was not needed for the study. The data we used for this study were publicly available aggregated data on annual numbers of THRs performed in Sweden and official statistics on population growth and projections of population growth. Registration of patients in the Swedish Hip Arthroplasty Register is regulated by Swedish law (SFS 2008:355). Patients are informed about the registration by the hospital, no informed consent is needed, and patients may request withdrawal at any time.
Data
We obtained data for the period 1968–2012. We collected the annual number of THRs in Sweden from the Swedish Hip Arthroplasty Register (www.shpr.se). Annual numbers of THRs from 1968 to 1978 were based on data gathered from hospital records at the start of the registry. From 1979 to 1991, aggregated data on THRs were reported to the registry at the hospital level. Since 1992, all the relevant hospitals in Sweden have been reporting patient-specific data on all THRs to the registry with 98–99% completeness (Garellick et al. Citation2012). Publicly available data concerning the evolution of the Swedish population were downloaded from the Statistics Sweden website (www.scb.se). We downloaded historical data from 1968 to 2012 and projections from 2013 to 2110—the total population, and the number of residents aged 40 years or older. From 1970 to 2010, the Swedish population increased by almost 1.5 million, there was a 7-year gain in life expectancy, and an increased proportion of elderly people (). Forecasts by Statistics Sweden (from 2012) suggested that these trends would persist and that the proportion of elderly citizens would increase further in the coming decades.
Table 1. Overview of the evolution of the Swedish population from 1970 to 2010 and the official forecast for 2020 and 2030
Statistics
In order to adjust for differences in age distribution over the years, the annual incidence of THR was calculated for 105 Swedish residents aged 40 years or older. This age group accounts for 99% of all THRs in Sweden. The estimated incidence served as outcome for the regression modeling while calendar year served as input. The regression models were built in order to forecast the incidence of THR operations per 105 Swedish residents aged 40 years or older in the decades after 2012 and to estimate the maximum incidence per 105 Swedish residents aged 40 years, if the model allowed.
Two types of regression analysis were considered. First, we used Poisson regression analysis (Kurtz et al. Citation2007a, Patterson et al. Citation2009, Bini et al. Citation2011). Poisson regression estimates the expected number of THRs per year and assumes a continuous growth. Thus, at least theoretically, the incidence can reach 105 of 105 persons and if the results are used for projections, it could indicate unreasonably high numbers.
Secondly, we adapted a regression framework that assumes the existence of an upper threshold, i.e. an asymptote that depicts the forecasted maximum incidence. The asymptote was estimated empirically from 3 competing models: asymptotic, logistic, and Gompertz regression (Turner et al. Citation1969, Park and Lim Citation1985). Parameters of the Poisson regression were estimated via maximum likelihood. We used non-linear least squares with the Levenberg-Marquardt algorithm to estimate the asymptote and parameters of the asymptotic, logistic, and Gompertz regressions (Moré Citation1978). 95% confidence intervals (CIs) were calculated based on the profile likelihood. 95% prediction intervals (PIs) were calculated based on error propagation using approximation by first-order Taylor expansion.
Competing models were compared with the Akaike information criterion (AIC) and Akaike weights (wAIC) (Bozdogan Citation1987, Wagenmakers and Farrell Citation2004). AIC penalizes model complexity and indicates which model best fits the data. As it lacks a direct and easy-to-interpret scale, AIC values are often transformed to wAIC. A model’s wAIC is interpreted as the posterior probability of being the best model given the data and the set of tested competing models. Akaike weights were also used to calculate a weighted average of the estimated asymptote, thus obtaining estimates that incorporate model uncertainty (Lukacs et al. Citation2010, Symonds and Moussalli Citation2011). Influential observations, whose removal would cause large change in the estimated asymptote, were detected with a jack-knife resampling. An observation was judged as influential if it induced a change in the estimated asymptote by twice its standard error divided by the square root of the sample size.
Statistical analyses were implemented in R 3.0.1 (Elzhov et al. Citation2013, R Core Team Citation2013).
Results
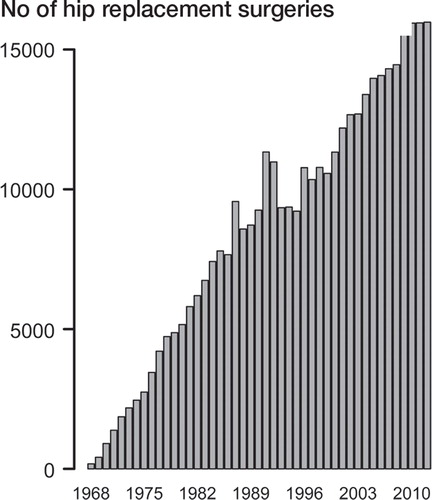
Between 1968 and 2012, 387,674 THRs were performed in Sweden according to the Swedish Hip Arthroplasty Register. Incidence in Swedish citizens aged 40 years and older and the number of THRs showed an increasing trend (). While in 1968, only 179 THR operations were performed (with an incidence of 5 per 105 Swedish citizens aged 40 years and older), by 1970 this had increased to 906 (with an incidence of 25). From 1970 to 1980, the increase was more than 5-fold—to 5,162 per year (incidence 139). Between 1980 and 1990, the annual number of operations almost doubled to 9,254 (incidence 225). Between 1990 and 2000, the increase was lower and 11,329 operations were recorded in 2000 (incidence 259). In 2010, 15,945 THRs were performed, giving an incidence of 332 per 105 Swedish citizens aged 40 years and older.
Figure 1. Annual number of total hip replacements registered in Sweden, 1968–2012.
Poisson regression offered a poor fit to the data, with a scaled Pearson chi-square statistic of 14.5 (1 represents a perfect fit) and significant difference between the expected and observed data points (p<0.0001). Poisson regression forecast that the incidence of THRs will increase exponentially over the coming years, with a predicted incidence of 784 total hip replacements per 105 Swedish residents in 2030 and 1,133 in 2040 ().
Figure 2. The recorded and projected incidence of total hip arthroplasty per 105 Swedish residents aged 40 years or older, 2013–2040. A. Projections based on Poisson regression. B. Projections based on asymptotic modeling, with the gray horizontal line representing the estimated asymptote and the associated 95% confidence intervals of the best model; asymptotic regression.
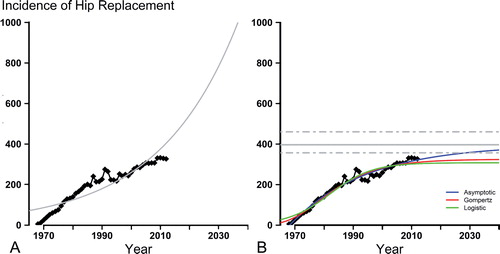
The asymptote estimates from the competing asymptotic models varied considerably. The asymptotic regression was the most liberal (396, CI: 256–460), the logistic regression was the most conservative (307, CI: 289–332), and the Gompertz regression was in-between (324, CI: 304–353). Model selection revealed the superiority of the asymptotic regression, with a posterior probability of being the best model—given the data and competing models—of 0.999.
Asymptotic regression suggested a maximum incidence of THR of 396 per 105 Swedish residents aged 40 years and older (). This upper limit is forecast to be reached around the year 2107. Increasing incidence and population together with the increasing proportion of Swedish citizens aged 40 years and older will lead to an increase in THR performed in the coming 2 decades ().
Table 2. Prognosis for the evolution of the Swedish population between 2013 and 2030: the expected number and proportion of Swedish residents aged 40 years and older together with the predicted incidence per 105 Swedish residents aged 40 years and older and the expected number of total hip replacements (THRs) in Sweden as predicted by asymptotic regression
Model diagnostics identified 4 influential points that would affect the estimated asymptote. The years 1987, 1991, 2009, and 2010 showed a sudden increase in THRs compared to previous years. Removal of 1987 led to an estimated asymptote of 406; while removal of 1991 led to an estimated asymptote of 404. Removal of 2009 and 2010 both led to an estimated asymptote of 388. If all 4 outliers were removed at the same time, the estimated asymptote was 398. This could lead to a biased estimation of the asymptote; however, the values without the outliers were close to the asymptote value of the full model and well within the confidence interval. In addition, correction with jack-knife resampling reduced its value only by 1 patient, to 395. As there was unequivocal support for one model by AIC, model averaging changed the estimated asymptote only at the decimal level.
Discussion
Based on historical data, we attempted to forecast the future need for total hip replacement in Sweden. We found that the incidence of THR in Swedish residents aged 40 years and older will continue to increase until a projected upper incidence of around 400 total hip replacements per 105 Swedish residents aged 40 years and older will be reached at the beginning of the next century. This, in combination with the increase in and ageing of the Swedish population, will lead to a higher demand for this intervention and an increased burden on healthcare resources and hospital budgets. In the year 2020, the estimated incidence of THR will be 341 and in 2030 it will be 358. Using official forecasted population growth data, about 18,000 operations can be expected to be performed in 2020 and 20,000 can be expected to be performed in 2030.
Our findings are in line with similar studies showing a continuous increase in joint replacements in past decades, and forecasting a continued increase in demand in the future. Kurtz et al (Citation2005) observed a 46% increase in THRs in the USA between 1990 and 2002. This increase is projected to be 174% in 2030, imposing a substantial economic burden on healthcare systems (Kurtz et al. Citation2007a, Citationb). The historical increase in THR is not necessarily the result of a higher incidence of osteoarthritis, but merely an increase in operation rate (Skytta et al. Citation2011). Successful and widespread surgical treatment of osteoarthritis has a history of less than half a century, and non-surgical treatment is presumably still the most common choice globally. The epidemiology of conditions of the hip that may be treated with hip replacement varies in different populations (Makela et al. Citation2010). Hereditary and lifestyle factors as well as social, cultural, and economic factors will dictate how the demand for joint replacement surgery will change over time in different countries and populations. Accurate projections of future demand must consider that not every member of society needs or is eligible for THR. Modeling approaches of contemporary projection studies have not considered this upper limit. Poisson regression, the workhorse of projection studies, allows the projections to increase to infinity, at least theoretically. This could lead to a serious overestimation of future incidence of total joint replacement.
The methodological approach we adopted in the present work assumes that the incidence has an upper limit. Bini et al. (Citation2011) reported a slowing demand for total joint replacement, with growth rates decreasing from 18% in 2002 to 3% in 2009. We observed a similar trend in the Swedish population. While the growth rate of THR was rather steep from the 1960s to the 1990s, after 2000 the growth slowed down. Barring the unexpected, such as medical breakthroughs, we expect that the incidence of THR will continue to increase, even though the growth rate will be slowing continuously. In Sweden, primary osteoarthritis stands for around four-fifths of the diagnoses leading to THR. Thus, in the coming decades the incidence of THR will probably be determined to a large degree by the incidence of osteoarthritis.
Historical data can help to forecast the trends in growth rates and to assess an upper level for the incidence of total joint replacement. The regression framework we considered allows estimation of an asymptote, an upper limit, and the associated confidence intervals. Estimation of the asymptote not only has a clinical/economic value but it is also important in obtaining a correct estimate of the growth rate. The drawback of the present framework is the increased computational complexity. Sample size requirements are likely to be higher than for the Poisson regression, and adjustment for other covariates is not straightforward. Calendar year used as predictor serves as a proxy for socio-economic characteristics of society in any particular year but cannot account for patient-related characteristics. Changes in the distribution of ages cannot be accounted for in these models, and this is a serious limitation. Nevertheless, we believe that the asymptotic framework that we adopted offers a biologically acceptable model and that its applicability in forecasting joint replacement is more plausible than Poisson regression.
Naturally, every extrapolation from historical data—even to the immediate and near future—bears uncertainties (Davies et al. Citation2013). Independently of the statistical framework applied, the projections are based on trends inferred from historical data. These trends might change, and such trend changes are already palpable. Today, both younger, healthier patients and older, more frail patients undergo hip replacement, patients who would probably not have qualified for such an operation 2–3 decades ago. An additional source of error is the change that the Swedish population goes through. At the end of 2012, Sweden had 9.6 million inhabitants, 14% of which were foreign-born immigrants. This proportion was lower in previous decades (e.g. 9% in 1990), and it is likely to increase in the coming ones (the official forecast for 2020 is 22%, and for 2030 it is 23%). Once operated, immigrants benefit from the operation as much as Swedish nationals (Krupic et al Citation2013). However, the extent to which immigrants take advantage of THR operations is not known. If the rate of THR varies among ethnic groups with the increasing heterogenization of the Swedish population, the validity of forecasting will decrease. Changes in lifestyle and longer life expectancy may increase the incidence of osteoarthritis, thus increasing demand for total replacement. Economic down-turns might constrain hospital budgets and reduce operation rates. Moreover, there may be new techniques or new medications to treat osteoarthritis, making total replacement obsolete.
In conclusion, we expect that the incidence of total hip replacement in Swedish residents aged 40 years or older will slowly increase in the coming decades. The major drive behind the increased total number of operations will probably be the population increase and the growing proportion of residents aged 40 or more.
Supplementary Material
Download PDF (235.7 KB)SN participated in the design of the study, prepared databases, carried out the statistical analyses, and was responsible for drafting the manuscript. MG revised the manuscript. CR participated in the design of the study and revised the manuscript. OR supervised the study, participated in its design, and participated in drafting the manuscript. All the authors read and approved the final manuscript.
The Swedish Hip Arthroplasty Register is funded by the Swedish Association of Local Authorities and Regions and by Region Västra Götaland. These sources of funding had no role in study design, data collection and analysis, decision to publish, or preparation of the manuscript. No commercial funding was received for this study.
- Berger A, Bozic K, Stacey B, Edelsberg J, Sadosky A, Oster G. Patterns of pharmacotherapy and health care utilization and costs prior to total hip or total knee replacement in patients with osteoarthritis. Arthritis Rheum 2011; 63 (8): 2268-75.
- Bini SA, Sidney S, Sorel M. Slowing demand for total joint arthroplasty in a population of 3.2 million. J Arthroplasty 2011; 26 (6): 124-8.
- Bozdogan H. Model selection and Akaike Information Criterion (AIC)-The general-theory and its analytical extensions. Psychometrika 1987 3): 345-70.
- Davies C, Briggs A, Lorgelly P, Garellick G, Malchau H. The “hazards” of extrapolating survival curves. Med Decis Making 2013; 33 (3): 369-80.
- Elzhov TV, Mullen KM, Spiess AN, Bolker B. minpack.lm: R interface to the Levenberg-Marquardt nonlinear least-squares algorithm found in MINPACK, plus support for bounds. R package version 11-7. 2013; http://CRAN.R-project.org/package=minpack.lm.
- Garellick G, Kärrholm J, Rogmark C, Rolfson O, Herberts P. Swedish hip arthroplasty register. Annual report 2011. 2012; ISBN 978-91-980507-1-4.
- Kotlarz H, Gunnarsson CL, Fang H, Rizzo JA. Insurer and out-of-pocket costs of osteoarthritis in the US evidence from national survey data. Arthritis Rheum 2009; 60 (12): 3546-53.
- Krupic F, Eisler T, Eliasson T, Garellick G, Gordon M, Kärrholm J. No influence of immigrant background on the outcome of total hip arthroplasty. Acta Orthop 2013, 84 (1): 18-24.
- Kurtz S, Mowat F, Ong K, Chan N, Lau E, Halpern M. Prevalence of primary and revision total hip and knee arthroplasty in the United States from 1990 through 2002. J Bone Joint Surg (Am) 2005; 87 (7): 1487-97.
- Kurtz S, Ong K, Lau E, Mowat F, Halpern M. Projections of primary and revision hip and knee arthroplasty in the United States from 2005. J Bone Joint Surg (Am) 2007a; 89: 780-5.
- Kurtz SM, Ong KL, Schmier J, Mowat F, Saleh K, Dybvik E, et al. Future clinical and economic impact of revision total hip and knee arthroplasty. J Bone Joint Surg (Am) 2007b; 89: 144-51.
- Lukacs PM, Burnham KP, Anderson DR. Model selection bias and Freedman’s paradox. Ann Inst Stat Math. 2010; 62 (1): 117-25.
- Makela KT, Peltola M, Hakkinen U, Remes V. Geographical variation in incidence of primary total hip arthroplasty: a population-based analysis of 34,642 replacements. Arch Orthop Trauma Surg 2010; 130 (5): 633-9.
- Moré J. The Levenberg-Marquardt algorithm: Implementation and theory. In: Numerical Analysis. Lecture Notes in Mathematics (ed. G A Watson). 630: Springer Berlin Heidelberg; 1978: 105-16.
- Park EW, Lim SM. Empirical estimation of the asymptotes of disease progress curves and the use of the Richards generalized rate parameters for describing disease progress. Phytopathology 1985; 75 (1): 786-91.
- Patterson CC, Dahlquist GG, Gyürüs E, Green A, Soltész G. Incidence trends for childhood type 1 diabetes in Europe during 1989–2003 and predicted new cases 2005–20: a multicentre prospective registration study. The Lancet 2009; 373 (9680): 2027-33.
- R Core Team. R: A Language and environment for statistical computing. R Foundation for Statistical Computing 2013; Vienna, Austria (http://www.R-project.org/).
- Skytta ET, Jarkko L, Antti E, Huhtala H, Ville R. Increasing incidence of hip arthroplasty for primary osteoarthritis in 30-to 59-year-old patients. Acta Orthop 2011; 82 (1): 1-5.
- Symonds MRE, Moussalli A. A brief guide to model selection, multimodel inference and model averaging in behavioural ecology using Akaike’s information criterion. Behav Ecol Sociobiol 2011; 65 (1): 13-21.
- Turner ME, Monroe RJ, Lucas HL, Jr. Generalized asymptotic regression and non-linear path analysis. Biometrics 1961; 17 (1): 120-43.
- Turner ME, Jr., Blumenstein BA, Sebaugh JL. 265 Note: A generalization of the logistic law of growth. Biometrics 1969; 25 (3): 577-80.
- Wagenmakers EJ, Farrell S. AIC model selection using Akaike weights. Psychon Bull Rev 2004; 11 (1): 192-6.
- Woolf AD, Pfleger B. Burden of major musculoskeletal conditions. Bull World Health Organ 2003; 81 (9): 646-56.