
Abstract
Background — While age is a common confounder, its impact on health-related quality of life (HRQoL) after total hip replacement is uncertain. This could be due to improper statistical modeling of age in previous studies, such as treating age as a linear variable or by using age categories. We hypothesized that there is a non-linear association between age and HRQoL.
Methods — We selected a nationwide cohort from the Swedish Hip Arthroplasty Register of patients operated with total hip replacements due to primary osteoarthritis between 2008 and 2010. For estimating HRQoL, we used the generic health outcome questionnaire EQ-5D of the EuroQol group that consits or 2 parts: the EQ-5D index and the EQ VAS estimates.
Using linear regression, we modeled the EQ-5D index and the EQ VAS against age 1 year after surgery. Instead of using a straight line for age, we applied a method called restricted cubic splines that allows the line to bend in a controlled manner. Confounding was controlled by adjusting for preoperative HRQoL, sex, previous contralateral hip surgery, pain, and Charnley classification.
Results — Complete data on 27,245 patients were available for analysis. Both the EQ-5D index and EQ VAS showed a non-linear relationship with age. They were fairly unaffected by age until the patients were in their late sixties, after which age had a negative effect.
Interpretation — There is a non-linear relationship between age and HRQoL, with improvement decreasing in the elderly.
Although age is an important confounder in most health-related outcomes (Harrell Citation2001), there is no consensus regarding its impact on health-related quality of life (HRQoL) after total hip replacement (THR) (Ethgen et al. Citation2004). Some studies have reported decreasing improvement in HRQoL after THR with age (McGuigan et al. Citation1995, Birdsall et al. Citation1999, Santaguida et al. Citation2008, Rolfson et al. Citation2011, Keurentjes et al. Citation2013), while others have indicated little, if any, effect (Rissanen et al. Citation1996, Jones et al. Citation2001, Lawless et al. Citation2012). Furthermore, whether the effect of age is similar throughout life or whether there is an accelerated decline in the elderly has not been properly investigated.
Our lack of understanding of this matter may be due to improper methodology when modeling age in statistical analysis. The review by Ethgen et al. (Citation2004) involving factors affecting HRQoL after knee and hip replacements revealed 8 approaches to modeling age. Most approaches have categorized age, while some have treated it as a linear variable. Although a common approach, categorization of a continuous variable has major disadvantages and can, under certain circumstances, be statistically equivalent to losing one-third of a study population (Lagakos Citation1988). It also assumes that everyone within the category has the same HRQoL estimate, thus creating an unrealistic scenario. For example, if the researchers decide to use one cut point at retirement age, 65 years, then a 64-year-old appears in the model to have more in common with a 40-year-old than with a 65-year-old.
On the other hand, the linear approach assumes that the estimate follows a straight line, i.e. the change between 55 and 56 years of age is the same as between 85 and 86 years of age. This is not in harmony with everyday clinical perception, where the majority of the population is fairly healthy until the decade between 60 and 70 years of age, after which there is a decline. Changing the linear approach to a method where the line is allowed to bend, known as splines or fractioned polynomials, has for a long time been advocated as a more sound approach (Brenner and Blettner Citation1997).
We investigated the effect of age on HRQoL after total hip arthroplasty by modeling age through splines. We hypothesized that age would have a non-linear impact on HRQoL after THR.
Methods
This was a nationwide prospective cohort study based on the Swedish Hip Arthroplasty Registry (SHAR). Since its inception in 1979, the SHAR has collected data on all primary and secondary THRs performed in Sweden (Kärrholm Citation2010). A program for gathering patient-reported outcome measures (PROMs) was adopted in 2002 and reached full nationwide coverage in 2008. Each hospital is responsible for data collection and for uploading the data to an online database.
Ethics
The study was conducted in accordance with the Helsinki Declaration. The regional ethics committee in Gothenburg, Sweden, approved the study (Dnr 380-13).
Participants
We included patients who were at least 40 years of age and who had THR between January 1, 2008 and December 31, 2010 for primary osteoarthritis. We excluded those with reoperations and those who had died within 1.5 years of the index operation. If a patient had 2 records due to bilateral surgery, only the first hip with complete data was selected. Follow-up data were gathered until December 31, 2011.
During this period, 38,350 THRs in 35,592 patients with primary osteoarthritis who were at least 40 years old were performed in Sweden. 34,519 patients (97%) were included in the study. The response rate for patients who had answered the preoperative questionnaire was 92% (27,382 patients), while 3,175 patients (68%) who had not answered the preoperative form filled out the form 1 year later.
Variables
The primary outcomes were the EQ-5D index and EQ VAS 1 year after surgery. Both measures are derived from the generic health outcome questionnaire EQ-5D of the EuroQol group (EuroQol Group Citation1990). The EQ-5D questionnaire consists of 6 items: 5 questions and the EQ VAS. The questions span 5 dimensions of HRQoL: (1) mobility, (2) self-care, (3) usual activities, (4) pain/discomfort, and (5) anxiety/depression. Each dimension has 3 levels of severity, generating a total of 243 combinations representing different health states. There are different value sets that may be used to translate these health states into a utility index. We used the Swedish experience-based time-trade-off (TTO) value set that translates the answers into a score between 0.34 and 0.97, on a scale where 0 represents death and 0.97 maximum attainable HRQoL by the EQ-5D measurement. The EQ VAS, in turn, consists of a visual analog scale ranging from 0 to 100 where the patients are asked to mark their present health state; 100 corresponds to the best health state imaginable and 0 the worst health state imaginable.
The primary exposure was age at the date of surgery. We chose sex, patient-reported Charnley class, previous contralateral THR, and preoperative pain (from a patient-reported VAS) as possible confounders. The Charnley classification organizes patients into 3 classes: (A) unilateral hip disease, (B) bilateral hip disease, or (C) multiple joint disease or other disabilities impairing walking ability (Charnley Citation1972). The preoperative values of the EQ-5D index and the EQ VAS were modeled against their outcomes in order to obtain the change in HRQoL independent of the starting point.
Statistics
We used ordinary least-squares linear regression for estimation of the coefficients. Both age and the preoperative EQ-5D index were modeled by restricted cubic splines, also known as natural splines. This is a type of spline that uses cubic terms in the center of the data and restricts the ends to a straight line, preventing the center from distorting the ends. The flexibility of a spline is chosen by the number of “knots”: more knots allow a more detailed description of the relationship. Essentially, each knot connects 2 sections of the line; for instance, a linear spline with 1 knot will have a V-shape, while 2 knots allow for an N-shaped relationship. As sharp twists of a linear spline are undesirable, the cubic function is applied to smooth the curve over the different knots. The position of the knots was chosen from different quantiles, depending on the number of knots. To avoid over-fitting the spline, the number of knots was chosen by the Bayesian information criterion (BIC). The BIC is more conservative than the more commonly used Akaike information criterion, and was chosen because of the large sample size. The restricted cubic spline was chosen in order to avoid distortions at the extremes, although alternative non-linear models have been investigated (see Supplementary data).
All analyses were performed using R software (ver. 3.0.2) (Team 2013), and packages rms (ver. 4.1-0) (Harrell Citation2013) for analysis, Gmisc for table output (ver. 0.6.1.1), ggplot2 for graphics (ver. 0.9.3.1) (Wickham Citation2009), and knitr (ver 1.5) (Xie Citation2013) for reproducible research. Due to non-normally distributed outcomes with heteroscedasticity, the confidence intervals were calculated using a robust covariance matrix (HC3) through the sandwich package (ver 2.3-0) (Burström et al. Citation2006).
Results
There were no major differences between those with full data and those with missing data, although the large sample size indicated statistical significance for age, preoperative EQ-5D index, and preoperative EQ VAS ().
Table 1. Basic characteristics of the study population, showing the absolute numbers (%) for proportions and mean (SD) for continuous variables
Age
The majority of patients improved across the age range for both outcomes (). In general, almost twice as many failed to improve according to the EQ VAS score compared to the EQ-5D index (16% vs. 9.4%). This failure to improve increased in patients over 80 years of age; 20% of these elderly patients failed to improve in EQ VAS score and 13% failed to improve in EQ-5D index. However, a minority of patients were over 80 years of age (14%).
Table 2. Raw comparison of the median (interquartile range) pre/ postoperative EQ-5D index and EQ VAS for various age groups
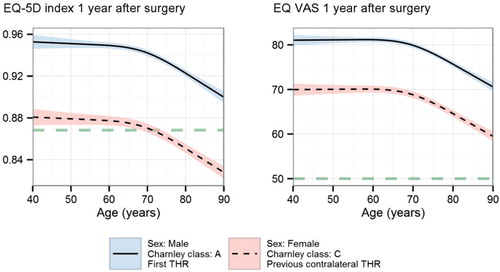
The regression model confirmed that age was associated with a decrease in the 2 HRQoL outcomes; on average, a 40-year-old patient compared to an 80-year-old patient had a 0.030 higher gain in EQ-5D index (95% CI: 0.023–0.037) and a 5.4 higher gain in EQ VAS (95% CI: 4.2–6.6). Furthermore, the age-related decrease was non-linear for both measurements, with a decrease that started in the patient’s late sixties (). The dimensions that corresponded closest to the overall spline were mobility and usual activities (data not shown). We found no support for interaction between age and gender for either outcome.
Figure 1. The relationship between the EQ-5D index and the EQ VAS one year postoperatively and the patient’s age at surgery. Preoperative EQ-5D index and EQ VAS were set to the most frequently occurring values (index = 0.87; VAS = 50) and are indicated by the horizontal dashed lines. The change before and after surgery is the height above this line, i.e. anything above is an improvement. The 2 lines differ only in height; the solid line with blue confidence interval indicates the optimal combination of covariates (male sex, first hip, and Charnley class A) while the dotted line with pink confidence interval indicates the least favorable combination (female sex, previous contralateral hip surgery, and Charnley class C). The pain VAS was set to the median value, 65 mm.
EQ-5D and EQ VAS
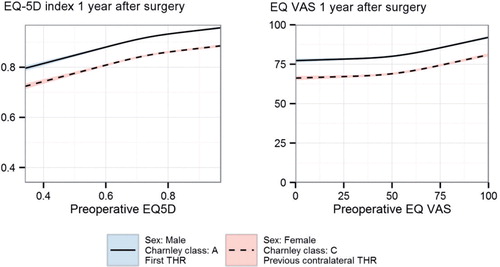
The preoperative EQ-5D index and EQ VAS explained substantially more than age; 3.9 times for the EQ-5D index and 1.9 times for the EQ VAS when comparing the impact of the variables on the model R-square value. Patients with low preoperative values had the highest gain, although they did not reach the same absolute levels (). With increasing preoperative values, the improvement lessens and patients with preoperative values close to the ceiling actually declined on average 1 year later.
Figure 2. The relationship between the EQ-5D index and the EQ VAS one year after surgery in relation to preoperative values. The 2 lines differ only in height. The solid line with blue confidence interval indicates the optimal combination of covariates (male sex, first hip, and Charnley class A) while the dotted line with pink confidence interval indicates the least favorable combination (female sex, second hip, and Charnley class C). Age and pain were set to the median values, 69 years and 65 mm.
Charnley class explained the largest proportion of the variance in the model, as measured by the R-squared: 30% for the EQ-5D index and 36% for the EQ VAS. Female gender, previous contralateral THR, and Charnley class C had the poorest outcomes, while male gender, no contralateral THR, and class A had the best outcomes. The figures illustrated this by polarizing the predicted results for these 2 groups (the blue and pink lines in and ). Age did not reach the same impact, even at the age extremes for the EQ-5D index, i.e. compared 90-year-old male patients in class A, 40-year-old female patients in class C had poorer EQ-5D index values (–0.012, 95% CI: –0.020 to –0.004). For the EQ VAS outcome, age had a stronger affect; female patients at 70 years of age in class C performed similarly to male patients at 90 years of age in class A (–0.6, 95% CI: –1.8 to 0.6).
Discussion
We found a non-linear correlation between age and HRQoL one year after surgery. Both scores remained largely unaffected by age until a downturn in the patient’s late sixties. Furthermore, we also found that the preoperative EQ-5D index and EQ VAS values were non-linearly correlated to the postoperative values 1 year later. It is worth noting that increased age was related to a lower preoperative HRQoL. Since lower preoperative HRQoL corresponded to a greater improvement, in the majority of the elderly HRQoL increased one year after surgery.
Since the mean age at surgery in this cohort was 69 years, one could argue that surgery is performed too late in order to maximize HRQoL outcome. On the other hand, the decline in improvement may be due to natural age-related deterioration of HRQoL that is not hip-related; therefore, it could be expected that the intervention would have a smaller effect on the gain in HRQoL in the elderly. HRQoL is also just one out of many possible PROM outcomes after THR, and while it is an interesting metric, it should be combined with other measures during patient consultation (Rolfson et al. Citation2011).
Our results are in line with those from other large cohort studies. Pennington et al. (Citation2013) reported on 30,203 patients in whom age was correlated with a decrease in the EQ-5D index. Judge et al. (Citation2013) showed that when categorizing age into < 50, 50 to 60, and > 60 years in 1,375 THR patients, both the younger and the older categories performed worse. They concluded that age had a non-linear effect, but failed to explore the relationship further. Their findings were also for a hip-specific outcome, the Oxford hip score. Cushnaghan et al. (Citation2007) showed in a small sample of 278 patients with THR that the SF-36 score was poorer in patients over 67 years of age when surveyed 8 years after surgery. It is not surprising that many studies have failed to detect the correlation for HRQoL outcomes (Jones et al. Citation2001, Ng et al. Citation2007, Quintana et al. Citation2009), as the age variable only explained a minor proportion of the variation. Our data suggest that adjustment for age above 70 years will mitigate confounding. While not recommended, ignoring age up to 70 years could be a viable alternative in those situations where splines are difficult to implement.
In addition to the non-linearity for age, both the preoperative EQ-5D index and the EQ-VAS exhibited non-linearity. Using the difference between the preoperative and the postoperative values, as many previous studies have done (Rolfson et al. Citation2011, Grosse Frie et al. Citation2012), will lead to residual confounding as it assumes both linearity and that the preoperative HRQoL estimate equals 1. Furthermore, the figures demonstrate the instrument’s ceiling effect. When a patient begins with a high HRQoL close to the ceiling, he/she will deteriorate on average—as any improvement cannot be measured beyond the instrument’s ceiling. This can also be viewed as a regression to the mean where extreme observations tend to move toward the population mean.
The main strength of our study was the nationwide population, and it should therefore be representative of the average patient. The small difference between respondents and non-respondents at the 1-year follow-up also support our belief that the results can be generalized.
Another important strength is that we used splines instead of categorization. Categorizing continuous variables introduces a cut-point bias (Royston et al. Citation2006, Williams Citation2011). Identification of the best divisor between groups by optimizing cut points can increase the risk of type-I errors. For instance, a study that reports a p-value of 0.05 and that has applied optimal cut points should in reality be reporting a p-value > 0.25 (Miller and Siegmund Citation1982, Altman et al. Citation1994, Hilsenbeck and Clark Citation1996, Lausen and Schumacher Citation1996). If standard cut points or quantiles are used instead of optimal cut points, this usually results in a loss of power. For instance, dichotomizing a normally distributed continuous variable can be equivalent to reducing the study population by a third (Lagakos Citation1988). While these properties are well known among statisticians, we have found no clinical articles that have implemented splines to model age for HRQoL outcomes.
Our study was limited by the small amount of data per patient. Expanding the routine follow-up program with more questions to provide more detailed background information may enhance the regression model, but it will jeopardize response rates, thus having a negative effect on the generalizability. The follow-up was also only 1 year after surgery; however, previous studies have shown surprisingly little change beyond 1 year (Judge et al. Citation2013).
It is important to remember that we looked at the chronological age, not the biological age. Use of a biological marker for age may improve the accuracy of the model, as the life span of humans is heterogeneous (Simm et al. Citation2008). This is outside the scope of a registry study but may be plausible in a smaller study. Similarly, if a more detailed co-morbidity adjustment than the Charnley classification was applied, the effect of age might be further attenuated and even more difficult to detect.
We conclude that there is a non-linear relationship between age and HRQoL in patients receiving THR that results in residual confounding if treated as a simple linear term or categorically in the regression. The implication of this is important, as age is a common confounder for which adjustment is necessary. Furthermore, we conclude that the non-linearity also applies to preoperative EQ-5D index and EQ VAS. Adjusting for these as linear variables or using the difference between the preoperative and postoperative values will result in residual confounding to an even greater extent than that for age.
Supplementary data
Appendix is available at Acta’s website (www.actaorthop.org), identification number 6947.
Supplementary Material
Download PDF (1.3 MB)MGo initiated and planned the study, performed all the analyses including programming of the graphs, and wrote the core manuscript. MGr aided with scanning of PubMed and Google Scholar for previous ways of modeling age and helped to write the manuscript. PF helped with the statistical analyses. OR and GG contributed with planning of the study, gathering of data, and writing of the manuscript. AS contributed with planning of the study and writing of the manuscript.
We thank all the Swedish orthopedic departments for kindly supplying us with high-quality data.
No competing interests declared.
- Altman DG, Lausen B, Sauerbrei W, Schumacher M. Dangers of using “optimal” cutpoints in the evaluation of prognostic factors. J Natl Cancer Inst 1994; 86 (11): 829–35.
- Birdsall PD, Hayes JH, Cleary R, Pinder IM, Moran CG, Sher JL. Health outcome after total knee replacement in the very elderly. J Bone Joint Surg (Br) 1999; 81 (4): 660–2.
- Brenner H, Blettner M. Controlling for continuous confounders in epidemiologic research. Epidemiology 1997; 8: 429–34.
- Burström K, Johannesson M, Diderichsen F. A comparison of individual and social time trade-off values for health states in the general population. Health Policy 2006; 76 (3): 359–70.
- Charnley J. The long-term results of low-friction arthroplasty of the hip performed as a primary intervention. J Bone Joint Surg (Br) 1972; 54 (1): 61–76.
- Cushnaghan J, Coggon D, Reading I, Croft P, Byng P, Cox K, et al. Long-term outcome following total hip arthroplasty: A controlled longitudinal study. Arthritis Care Res 2007; 57 (8): 1375–80.
- Ethgen O, Bruyère O, Richy F, Dardennes C, Reginster J-Y. Health-related quality of life in total hip and total knee arthroplasty. A qualitative and systematic review of the literature. J Bone Joint Surg (Am) 2004; 86 (5): 963–74.
- EuroQol Group. EuroQol—a new facility for the measurement of health-related quality of life. Health Policy 1990; 16 (3): 199–208.
- Grosse Frie K, van der Meulen J, Black N. Relationship between patients’ reports of complications and symptoms, disability and quality of life after surgery. Br J Surg 2012; 99 (8): 1156–63.
- Harrell FE. Regression modeling strategies: with applications to linear models, logistic regression, and survival analysis. New York: Springer; 2001.
- Harrell J F E. rms: Regression Modeling Strategies (Internet). 2013. Available from: http://CRAN.R-project.org/package=rms
- Hilsenbeck SG, Clark GM. Practical p-value adjustment for optimally selected cutpoints. Stat Med 1996; 15 (1): 103–12.
- Jones CA, Voaklander DC, Johnston DW, Suarez-Almazor ME. The effect of age on pain, function, and quality of life after total hip and knee arthroplasty. Arch Intern Med 2001; 161 (3): 454–60.
- Judge A, Arden NK, Batra RN, Thomas G, Beard D, Javaid MK, et al. The association of patient characteristics and surgical variables on symptoms of pain and function over 5 years following primary hip-replacement surgery: a prospective cohort study. BMJ Open (Internet). 2013 Jan 1 [cited 2013 May 22];3(3). Available from: http://bmjopen.bmj.com/content/3/3/e002453
- Kärrholm J. The Swedish Hip Arthroplasty Register (www.shpr.se). Acta Orthop 2010; 81: 3–4.
- Keurentjes JC, Fiocco M, Nelissen RG. Willingness to undergo surgery again validated clinically important differences in health-related quality of life after total hip replacement or total knee replacement surgery. J Clin Epidemiol 2013; 67: 114-20.
- Lagakos SW. Effects of mismodelling and mismeasuring explanatory variables on tests of their association with a response variable. Stat Med 1988; 7 (1-2): 257–74.
- Lausen B, Schumacher M. Evaluating the effect of optimized cutoff values in the assessment of prognostic factors. Comput Stat Data Anal 1996; 21 (3): 307–26.
- Lawless BM, Greene M, Slover J, Kwon Y-M, Malchau H. Does age or bilateral disease influence the value of hip arthroplasty? Clin Orthop 2012; (470) (4): 1073–8.
- McGuigan FX, Hozack WJ, Moriarty L, Eng K, Rothman RH. Predicting quality-of-life outcomes following total joint arthroplasty: Limitations of the SF-36 health status questionnaire. J Arthroplasty 1995; 10 (6): 742–7.
- Miller R, Siegmund D. Maximally selected chi square statistics. Biometrics 1982; 38: 1011–6.
- Ng CY, Ballantyne JA, Brenkel IJ . Quality of life and functional outcome after primary total hip replacement A five-year follow-up. J Bone Joint Surg (Br) 2007; 89 (7): 868–73.
- Pennington M, Grieve R, Sekhon JS, Gregg P, Black N, van der Meulen JH. Cemented, cementless, and hybrid prostheses for total hip replacement: cost effectiveness analysis. BMJ 2013; 346: f1026.
- Quintana JM, Escobar A, Aguirre U, Lafuente I, Arenaza JC. Predictors of health-related quality-of-life change after total hip arthroplasty. Clin Orthop 2009; (467) (11): 2886–94.
- Rissanen P, Aro S, Sintonen H, Slätis P, Paavolainen P. Quality of life and functional ability in hip and knee replacements: A prospective study. Qual Life Res 1996; 5 (1): 56–64.
- Rolfson O, Kärrholm J, Dahlberg LE, Garellick G. Patient-reported outcomes in the Swedish Hip Arthroplasty Register: Results of a nationwide prospective observational study. J Bone Joint Surg (Br) 2011; 93 (7): 867–75.
- Royston P, Altman DG, Sauerbrei W. Dichotomizing continuous predictors in multiple regression: a bad idea. Stat Med 2006; 25 (1): 127–41.
- Santaguida PL, Hawker GA, Hudak PL, Glazier R, Mahomed NN, Kreder HJ, et al. Patient characteristics affecting the prognosis of total hip and knee joint arthroplasty: a systematic review. Can J Surg 2008; 51 (6): 428–36.
- Simm A, Nass N, Bartling B, Hofmann B, Silber R-E, Navarrete Santos A. Potential biomarkers of ageing. Biol Chem 2008; 389 (3): 257–65.
- Team RC. R: A language and environment for statistical computing (Internet). Vienna, Austria; 2013. Available from: http://www.R-project.org/
- Wickham H. ggplot2: elegant graphics for data analysis (Internet). Springer New York; 2009. Available from: http://had.co.nz/ggplot2/book
- Williams JS. Assessing the suitability of fractional polynomial methods in health services research: a perspective on the categorization epidemic. J Health Serv Res Policy 2011; 16 (3): 147–52.
- Xie Y. Dynamic documents with R and Knitr. New York, NY: CRC Press; 2013.