
Abstract
Background— The Charnley comorbidity classification organizes patients into 3 classes: (A) 1 hip involved, (B) 2 hips involved, and (C) other severe comorbidities. Although this simple classification is a known predictor of health-related quality of life (HRQoL) after total hip replacement (THR), interactions between Charnley class, sex, and age have not been investigated and there is uncertainty regarding whether A and B should be grouped together.
Methods — We selected a nationwide cohort of patients from the Swedish Hip Arthroplasty Register operated with THR due to primary osteoarthritis between 2008 and 2010. For estimation of HRQoL, we used the generic health outcome questionnaire EQ-5D of the EuroQol group. This consists of 2 parts: the EQ-5D index and the EQ VAS estimates. We modeled the EQ-5D index and the EQ VAS against the self-administered Charnley classification. Confounding was controlled for using preoperative HRQoL values, pain, and previous contralateral hip surgery.
Results — We found that women in class C had a poorer EQ-5D outcome than men. This effect was mostly due to the fact that women failed to improve in the mobility dimension; only 40% improved, while about 50% of men improved. Age did not interact with Charnley class. We also found that the classification performed best without splitting or aggregating classes.
Interpretation — Our results suggests that the self-administered Charnley classification should be used in its full capacity and that it may be interesting to devote special attention to women in Charnley class C.
The Charnley classification was introduced in 1972 as a comorbidity grouping for walking disabilities (Charnley Citation1972). Today, it is a widely recognized predictor of patient-reported outcomes after hip and knee replacements (Callaghan et al. Citation1990, Garellick et al. Citation1998, Dunbar et al. Citation2004, Ostendorf et al. Citation2004, Hulleberg et al. Citation2008, Rolfson et al. Citation2009, Citation2011), even though this has not been unanimously shown (McGuigan et al. Citation1995, Lavernia et al. Citation2009, Lawless et al. Citation2012). The classification has a simple design with 3 classes: (A) 1 hip involved, (B) 2 hips involved but no other joints, and (C) some other factor contributing to failure to achieve normal locomotion, such as rheumatoid arthritis, senility, hemiplegia, or cardiovascular or respiratory disability. Despite its simplicity, there have been concerns that the classification may suffer from interobserver variability (Bjorgul et al. Citation2010). For example, the proportion of class C reported by McGuigan et al. (Citation1995) was around 4% while Lavernia et al. (Citation2009) reported 30%. To further complicate matters, some split the B class into 2 groups, those without an operated contralateral hip joint (B1) and those with an operated contralateral hip joint (B2) (Dunbar et al. Citation2004, Röder et al. Citation2006). These inconsistencies can cause difficulties when clinicians try to use the classification system to inform their patients.
Self-administered classification as used for the nationwide follow-up program run by the Swedish Hip Arthroplasty Register (SHAR) may limit the interobserver variability. We have previously shown that Charnley class C is both common—45% in patients eligible for total hip replacement (THR)—and a strong predictor of poor patient-reported outcomes (Rolfson et al. Citation2011). Since class C makes up almost half of the study population, it is of interest to subdivide this group further and determine whether subgroups based on age or sex should be used for targeting interventions. Furthermore, class A and B are commonly grouped together, thereby possibly limiting the ability of the classification to discriminate between patients. Investigation of the full capacity of the classification is therefore of some interest.
We investigated how the self-reported Charnley classification influenced health-related quality of life (HRQoL) 1 year after surgery. We hypothesized that each class in the self-reported Charnley classification has a different impact on HRQoL after THR and that each class may show an interaction effect with either age or sex.
Methods
Study design and data sources
This was a nationwide prospective cohort study based on the Swedish Hip Arthroplasty Register (SHAR). Since its inception in 1979, the SHAR has collected data on all primary THRs and any kind of further hip surgery associated with the primary intervention performed in Sweden (Kärrholm Citation2010). A program for gathering patient-reported outcome measures (PROMs) was adopted in 2002 and reached full nationwide coverage in 2008 (Rolfson et al. Citation2011). A PROM questionnaire is presented to all elective THR patients preoperatively and 1, 6, and 10 years after surgery. Each hospital is responsible for data collection and registration in an online database.
Ethics
The study was conducted in accordance with the Helsinki Declaration. It was approved by the regional ethics committee in Gothenburg, Sweden (Dnr 380-13).
Participants
All patients who had THR surgery between January 1, 2008 and December 31, 2010 due to primary osteoarthritis and who were more than 40 years of age were eligible. Because implementation of the program was gradual, we only included those who had returned the preoperative PROM questionnaire. If bilateral surgery was registered during the study period, first hip fulfilling previous criteria was selected. If the second surgery occurred prior to filling out the 1-year PROM questionnaire, the patient was excluded. We also excluded patients with recorded reoperation or death within 1.5 years from the index operation.
During this period, 38,596 total hip replacements were performed on 35,823 patients. Of these, 28,585 (74%) met the selection criteria. The 1-year follow-up response rate during this period was 92%.
Outcomes
The primary outcomes were the EQ-5D index and EQ VAS 1 year after surgery. The EQ-5D form consists of 6 items: 5 questions and the EQ VAS. The questions span 5 dimensions of health: (1) mobility, (2) self-care, (3) usual activities, (4) pain/discomfort, and (5) anxiety/depression. Each dimension has 3 levels of severity, generating a total of 243 combinations representing different health states. There are different value sets that may be used to translate these health states into a utility index. We used the Swedish experience-based time-trade-off (TTO) value set that translates the answers into a score between 0.34 and 0.97, on a scale where 0 represents death and 0.97 maximum attainable HRQoL by the EQ-5D measurement (Burström et al. Citation2013). The EQ VAS, in turn, consists of a visual analog scale (VAS) ranging from 0 to 100 where the patients are asked to mark their HRQoL, and 100 corresponds to full health.
Variables
The primary exposure variable was Charnley class. In the PROM program, it is assessed preoperatively and at 1 year by using 2 questions: (1) Do you have any symptoms from the other hip?; and (2) Do you have problems in walking for other reasons (e.g. pain from other joints, back pain, angina, or any other medical condition impairing your walking capacity)? We also included in the model preoperative HRQoL, previous contralateral THR, and preoperative pain. The pain was measured using a VAS where 0 corresponds to no pain and 100 to maximum pain.
Statistics
We used linear regression to model the outcomes with the preoperative outcome measure, previous contralateral THR, and preoperative pain VAS as possible confounders. Age, pain, and preoperative outcome measures were modeled using restricted cubic splines where the Bayesian Information Criterion (BIC) decided optimal degrees of freedom for the spline. Interactions were investigated by multiplicative terms between Charnley class, age, and sex in the regression model. The significance of these was evaluated by ANOVA (Harrell Citation2001). Non-significant interactions were removed from the final model.
We applied quantile regression to the final model using 3 quantiles: 0.5 (the median), 0.25 (lower quartile), and 0.1 (lower decile). Quantile regression is similar to linear regression, with the difference that it uses quantiles instead of the mean and is thereby free from distributional assumptions (Koenker and Bassett Citation1978). Quantile regression was used to investigate how Charnley class influenced those who performed poorly.
To understand what dimensions were affected by the Charnley class, we calculated the number of grades for each EQ-5D dimension that the patient changed before and after surgery; for example, if a patient had reported moderate problems before surgery and improved by having no problems after surgery, he/she had improved 1 grade, while a patient had deteriorated 1 grade if he/she had started with no problems and then had moderate problems at follow-up. This change was analyzed using univariate linear regression.
All analyses were performed using R version 3.0.2 (Team Citation2013) and packages rms version 4.1-1 (Harrell Citation2013) for analysis, Gmisc version 0.6.2.1 for transition plots and table output, ggplot2 version 0.9.3.1 (Wickham Citation2009) for graphics, and knitr version 1.5 (Xie Citation2013) for reproducible research. Due to non-normally distributed outcomes with heteroscedasticity, the 95% confidence intervals (CIs) were calculated using a robust covariance matrix (HC3) through the sandwich package version 2.3-0 (Long and Ervin Citation2000, Zeileis Citation2004, Burström et al. Citation2006), except for quantile regression where bootstrapped confidence intervals were used (1,000 bootstraps).
Results
Complete data from 26,249 patients were available for analysis. In general, women were slightly older, experienced more pain, and categorized themselves more frequently in Charnley class C (). There were no major differences between those with full data and those with missing data.
Table 1. Basic characteristics of the study population, showing absolute numbers (%) for proportions and mean (SD) for continuous variables. The number of patients with missing observations is presented as percentages of the total for that particular group
Main results
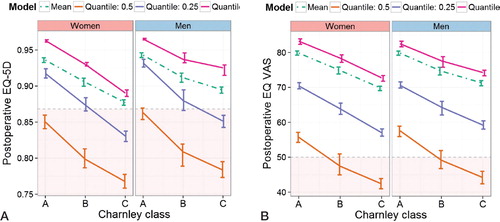
Women in Charnley class C had a poorer outcome than men. This interaction was strongest for the EQ-5D index: the p-value for EQ-5D index was < 0.001 and that for EQ VAS was 0.008. These sex differences were confirmed in the quantile regression models (). Age did not interact with Charnley class (the p-value for EQ-5D index was 0.57 and that for EQ VAS was 0.30).
Figure 1. A. An illustration of the difference in impact of Charnley class depending on sex. The results were adjusted to the median age and pain VAS: 69 years and 65 mm. The most frequent EQ-5D index value preoperatively was 0.87. The red area indicates values below the preoperative index value. The dashed line indicates the predictions from a linear regression model while the solid lines depict quantile regression predictions at the different quantiles. B. The same as in panel A but with EQ VAS as outcome. This was adjusted to the most frequent EQ VAS value preoperatively: 50 mm.
EuroQoL dimensions
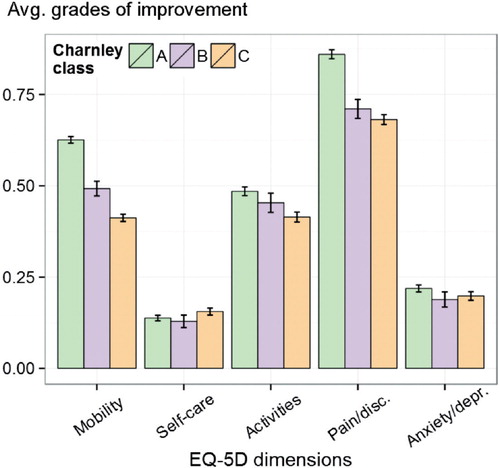
The sex interaction was mediated by the mobility dimension where men in class C improved more frequently than women. 50% of the men improved at least 1 grade, as opposed to 40% of the women. The dimensions typically affected by the Charnley class were pain/discomfort and mobility. Pain/discomfort did not differ between class B and C, while both mobility and usual activities decreased with higher Charnley class ().
Figure 2. Average change before and after surgery, by EQ-5D dimension (mobility, self-care, activities, pain/discomfort, and anxiety/depression), each stratified by Charnley class. Each dimension may take on 3 different ordered values; thus, the change ranges from –2 to 2 and this average is shown on the y-axis. The confidence interval bars indicate 95% certainty of each average. The maximum influence of the Charnley classes was on the mobility and pain/discomfort dimensions.
Grouping or subdivision of the classification
Each Charnley class had a unique impact on the HRQoL 1 year after surgery. The model with Charnley class A and B grouped had poorer BIC estimates, indicating an inferior model. When we separated classes A and B, the contribution of the Charnley classification to the model improved by 12% for the EQ-5D index and by 11% for the EQ VAS.
When we analyzed the subdivision of class B, 3,156 patients were re-assigned to subclass B2 as they had (according to the SHAR) a previously operated contralateral hip. Of these patients, 2,749 were from class A and 407 were from class B. While this resulted in a sizeable change between classes, the regression models did not improve from application of this knowledge; both the EQ-5D index and EQ VAS had poorer BIC with the split B class.
Self-reporting
Women reported Charnley class C more frequently than men, both before (45% vs. 36%) and 1 year after surgery (47% vs. 37%). We also found a considerable change in reported class before and after surgery (): 39% changed class. Crossovers that should be rare according to the original Charnley classification were fairly common; 18% changed either to class A from class B or C, or to class B from class C. The difference between men and women regarding crossovers was small, although women deteriorated to a higher degree to class C one year later ().
Figure 3. The crossover between Charnley classes from before to after surgery. The patients before surgery are represented on the left while those after surgery are represented on the right. Pink corresponds to the proportion of women in each group while blue corresponds to the proportion of men. The size of the arrow is proportional to the percentage of patients leaving that specific class and the color of the gradient corresponds to the sex proportion for each transition according to the color bar.
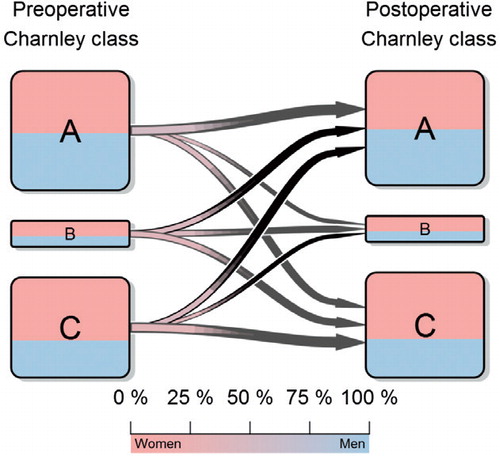
Table 2. The changes between the preoperative and the postoperative Charnley class according to sex
In the 1,284 patients who had been excluded due to contralateral surgery prior to reporting the one year follow-up form, class A was the least common class (6%). Class B was approximately 4 times larger than in the study population (46%), while the proportion of class C was similar to that in the study population (47%).
The 407 patients in class B who had previously undergone a contralateral THR performed worse than those who had not (EQ-5D: –0.025, CI: –0.037 to –0.013; and EQ VAS: –3.4, CI: –5.6 to –1.2). This negative effect was primarily due to less improvement in mobility, activities, and pain/discomfort dimensions, i.e. the EuroQol dimensions mostly affected by a THR.
Discussion
This is the largest study to be performed in which the Charnley classification has been thoroughly analyzed. We found that Charnley class B is an independent risk factor and should not be grouped with class A. The patient-reported Charnley class B also appears to be better for assessment of HRQoL than subdividing patients with previous contralateral hip surgery into a separate class, as some authors have suggested (Dunbar et al. Citation2004, Röder et al. Citation2006).
There was also a sex difference in the impact of Charnley class C on EQ-5D indices: women gained less than men. The mobility dimension in the EQ-5D appeared to be the main cause behind this interaction, where 25% more men than women improved 1 year after surgery. A possible explanation may be that Charnley class is closely correlated to postoperative ambulation (Röder et al. Citation2003) and that women have a different rehabilitation pattern (Vincent et al. Citation2006). It is also conceivable that women interpret class C differently, i.e. that the men in class C and women in class C are not comparable. As almost half of all women belonged to Charnley class C, we believe that this is an interesting sub-population to further study.
Interestingly, sex differences were not seen for the EQ VAS outcome, possibly due to a different impact of mobility on HRQoL between the sexes. Furthermore, the Charnley class interaction difference between the EQ-5D and the EQ VAS illustrates how the 5 dimensions can capture different qualities than the EQ VAS, providing important input that helps the HRQoL interpretation.
The Charnley classification is intended to categorize patients according to their walking ability and contralateral hip disease. Consistent with this intention, the mobility and pain/discomfort dimensions in the EQ-5D index were the dimensions most affected by the self-categorized Charnley classification. Perhaps less consistent with the intention was the sizeable change between the preoperative Charnley class and the class 1 year later. It is worth noting that a considerable group crossed over to class A from both the B class and the C class, suggesting that classification based on a patient-administered questionnaire is less rigid than originally intended (Charnley Citation1972). Conversely, patients did seem to classify themselves correctly, since those who had their contralateral hip operated soon after rarely reported class A. This is further supported by the lack of improvement when subdividing the B class according to previous hip arthroplasties. Interestingly, the few patients with a contralateral THR who reported class B performed worse even after adjusting for pain and preoperative HRQoL. This could be due to fear of surgery or to being genetically predisposed to postoperative pain (Macrae Citation2008). We conclude that even though there is a difference from the original intention, patients appear to have a good understanding of their physical health, thus possibly explaining why this self-categorized Charnley classification is such a strong predictor.
To our knowledge, no other large cohort studies on Charnley classification have gone into the details of the classification’s impact on HRQoL. In order to keep our message simple, we did not investigate other important metrics such as pain and satisfaction, which are also included by the SHAR PROM program. Generic measures such as the EQ-5D index are interesting metrics, as they combine many dimensions of health. While these measures are not as sensitive as disease-specific measures (Ostendorf et al. Citation2004), they do contain common osteoarthritis characteristics such as pain, activities of daily living, and mobility, while at the same time retaining the option of detecting unexpected correlations in other dimensions such as anxiety and depression. In large cohort studies, the size of the study group compensates for the lack of sensitivity while maintaining the ability to detect unexpected correlations.
The estimated outcomes 1 year after surgery for different Charnley classes suggest that some patients will end up with values lower than their preoperative level. This estimation applies to the average-aged patient with the most common preoperative health state according to EQ-5D/EQ VAS. Shifting the references to a lower preoperative EQ-5D index/EQ VAS or to younger patients would reduce the risk of not improving. We chose this presentation of combined estimates instead of single estimates to better illustrate different quantiles.
The main strength of the present study was the large nationwide cohort with a good response rate to the survey and small differences between respondents and non-respondents. We believe that the cohort selected was representative while minimizing confounders such as early reoperations, recall bias due to contralateral surgery, and misclassification of surgery indication. Another strength was the use of splines to control for age confounding, thus minimizing the residual confounding. This is important, as Charnley classification is a comorbidity indicator and strongly correlates with age. By modeling age with a spline, and not in categories or as a straight line, confounding will be negligible.
We chose in this study to exclude those who died within 1.5 years. We believe that HRQoL is interesting only if a patient survives and can benefit from the HRQoL gained. Furthermore, if a patient in Charnley class C is advised not to go through with surgery both due to risk of dying and poor HRQoL outcome, in a sense there will be a double penalty.
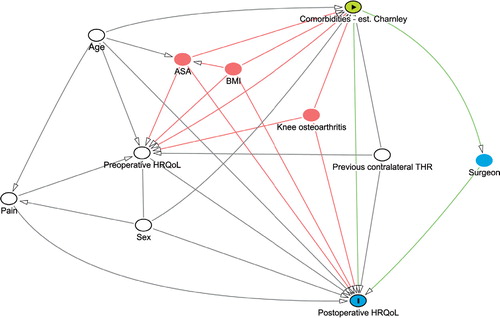
Our main limitation was the scarcity of information per patient. During the study period, 2008 to 2010, the registry has started collecting interesting confounders such as BMI and ASA class. In future studies, these will most likely be included in the models. The Charnley classification can also be strongly influenced by simultaneous knee osteoarthritis and other lower extremity disabilities that we have not been able to adjust for (see ).
Figure 4. Our directed acyclic graph (DAG) for this study as generated by dagitty.net. The green node indicates the exposure of interest, the green lines the exposures effect pathways, and the blue node with the “I” indicates the outcome of interest. The blue node without “I” is an intermediate to the effect pathway. White nodes are confounders that are adjusted for in the models, while red nodes indicate nodes that should be adjusted for but that are not available.
Although major surgery such as THR would be expected to affect a patient’s HRQoL, it is important to remember that other health-related events can occur between surgery and follow-up. With limited knowledge of this period, we want to stress the observational nature of our study and the need for further in-depth analysis. The scarcity applies also to the fact that the follow-up was only 1 year after surgery. The SHAR collects PROMs at 6- and 10-year follow-up, but the data are still too few to analyze in-depth, although other studies have shown negligible change with longer follow-up (Judge et al. Citation2013).
We conclude that the self-administered Charnley classification is a reliable instrument, with interesting properties that are easy to use in everyday clinical practice. There is also strong evidence that women in Charnley class C fail to improve in mobility as much as men.
MGo initiated and planned the study, performed all the analyses including programming of the graphs, and wrote the draft manuscript. MGr aided by scanning of PubMed and Google Scholar for possible causes of interaction between sex and Charnley class, and helped in writing the manuscript. PF aided with the statistical analyses. OR contributed with study planning, gathering of data, and writing of the manuscript. GG contributed with study planning, gathering of data, and writing of the manuscript. OS contributed with study planning and writing of the manuscript.
We thank all of the Swedish orthopedic departments and patients for kindly supplying us with this high-quality data.
No competing interests declared.
Related Research Data
- Bjorgul K, Novicoff WM, Saleh KJ. Evaluating comorbidities in total hip and knee arthroplasty: available instruments. J Orthop Traumatol 2010; 11: 203–9.
- Burström K, Johannesson M, Diderichsen F. A comparison of individual and social time trade-off values for health states in the general population. Health Policy 2006; 76 (3): 359–70.
- . Burström K, Sun S, Gerdtham U-G, Henriksson M, Johannesson M, Levin L-Å, et al. Swedish experience-based value sets for EQ-5D health states. Qual Life Res 2013; 22: 1–12.
- Callaghan JJ, Dysart SH, Savory CF, Hopkinson WJ. Assessing the results of hip replacement. A comparison of five different rating systems. J Bone Joint Surg (Br) 1990; 72 (6): 1008–9.
- Charnley J. The long-term results of low-friction arthroplasty of the hip performed as a primary intervention. J Bone Joint Surg (Br) 1972; 54 (1): 61–76.
- Dunbar M, Robertsson O, Ryd L. What’s all that noise? The effect of co-morbidity on health outcome questionnaire results after knee arthroplasty. Acta Orthop 2004; 75 (2): 119–26.
- Garellick G, Malchau H, Herberts P. Specific or general health outcome measures in the evaluation of total hip replacement. A comparison between the Harris hip score and the Nottingham health profile. J Bone Joint Surg (Br) 1998; 80 (4): 600–6.
- Harrell FE. Regression modeling strategies: with applications to linear models, logistic regression, and survival analysis. New York: Springer; 2001.
- Harrell J F E. rms: Regression Modeling Strategies [Internet]. 2013. Available from: http://CRAN.R-project.org/package=rms
- Hulleberg G, Aamodt A, Espehaug B, Benum P. A clinical and radiographic 13-year follow-up study of 138 Charnley hip arthroplasties in patients 50–70 years old: Comparison of university hospital data and registry data. Acta Orthop 2008; 79 (5): 609–17.
- Judge A, Arden N K, Batra R N, Thomas G, Beard D, Javaid M K, et al. The association of patient characteristics and surgical variables on symptoms of pain and function over 5 years following primary hip-replacement surgery: a prospective cohort study. BMJ Open [Internet]. 2013 Jan 1 [cited 2013 May 22];3(3). Available from: http://bmjopen.bmj.com/content/3/3/e002453
- Kärrholm J. The Swedish Hip Arthroplasty Register (www.shpr.se). Acta Orthop 2010; 81: 3–4.
- Koenker R, Bassett G Jr. Regression quantiles. Econom J Econom Soc 1978; 46: 33–50.
- Lavernia CJ, Laoruengthana A, Contreras JS, Rossi MD. All-patient refined diagnosis-related groups in primary arthroplasty. J Arthroplasty (Suppl 1) 2009; 24 (6): 19–23.
- Lawless BM, Greene M, Slover J, Kwon Y-M, Malchau H. Does age or bilateral disease influence the value of hip arthroplasty? Clin Orthop 2012; (470) (4): 1073–8.
- Long JS, Ervin LH. Using heteroscedasticity consistent standard errors in the linear regression model. Am Stat 2000; 54 (3): 217–24.
- Macrae WA. Chronic post-surgical pain: 10 years on. Br J Anaesth 2008; 101 (1): 77–86.
- McGuigan FX, Hozack WJ, Moriarty L, Eng K, Rothman RH. Predicting quality-of-life outcomes following total joint arthroplasty: Limitations of the SF-36 health status questionnaire. J Arthroplasty 1995; 10 (6): 742–7.
- Ostendorf M, van Stel HF, Buskens E, Schrijvers A JP, Marting LN, Verbout AJ, et al. Patient-reported outcome in total hip replacement. A comparison of five instruments of health status. J Bone Joint Surg (Br) 2004; 86 (6): 801–8.
- Röder C, Parvizi J, Eggli S, Berry DJ, Müller ME, Busato A. Demographic factors affecting long-term outcome of total hip arthroplasty. Clin Orthop 2003; (417): 62–73.
- Röder C, Staub LP, Eichler P, Widmer M, Dietrich D, Eggli S, et al. Avoiding misclassification bias with the traditional Charnley classification: Rationale for a fourth Charnley class BB. J Orthop Res 2006; 24 (9): 1803–8.
- Rolfson O, Dahlberg LE, Nilsson J-A, Malchau H, Garellick G. Variables determining outcome in total hip replacement surgery. J Bone Joint Surg (Br) 2009; 91 (2): 157–61.
- Rolfson O, Kärrholm J, Dahlberg LE, Garellick G. Patient-reported outcomes in the Swedish Hip Arthroplasty Register: Results of a nationwide prospective observational study. J Bone Joint Surg (Br) 2011; 93 (7): 867–75.
- Team RC. R: A Language and environment for statistical computing (Internet). Vienna, Austria; 2013. Available from: http://www.R-project.org/
- Vincent HK, Alfano AP, Lee L, Vincent KR. Sex and Age Effects on outcomes of total hip arthroplasty after inpatient rehabilitation. Arch Phys Med Rehabil 2006; 87 (4): 461–7.
- Wickham H. ggplot2: elegant graphics for data analysis (Internet). Springer New York; 2009. Available from: http://had.co.nz/ggplot2/book
- Xie Y. Dynamic documents with R and Knitr. New York, NY: CRC Press; 2013.
- Zeileis A. Econometric computing with HC and HAC covariance matrix estimators. J Stat Softw 2004; 11 (10): 1–17.