
Abstract
Background and purpose — Optical coherence tomography (OCT) is a light-based imaging technique suitable for depiction of thin tissue layers such as articular cartilage. Quantification of results and direct comparison with a reference standard is needed to confirm the role of OCT in cartilage evaluation.
Materials and methods — Goat talus articular cartilage repair was assessed quantitatively with OCT and compared with histopathology using semi-automated analysis software. Osteochondral defects were created centrally in goat tali with subsequent healing over 24 weeks. After sacrifice, the tali were analyzed using OCT and processed into histopathology slides. Cartilage thickness, repair tissue area, and surface roughness were measured. Also, light attenuation coefficient measurements were performed to assess differences in the properties of healthy tissue and repair tissue.
Results — Intra-class correlation coefficients for resemblance between the 2 techniques were 0.95 (p < 0.001) for thickness, 0.73 (p = 0.002) for repair tissue area, and 0.63 (p = 0.015) for surface roughness. Light attenuation differed significantly between healthy cartilage (8.2 (SD 3.9) mm-1) and repair tissue (2.8 (SD 1.5) mm-1) (p < 0.001).
Interpretation — Compared to histopathology as the standard reference method, OCT is a reproducible technique in quantitative analysis of goat talus articular cartilage, especially when assessing cartilage thickness and to a lesser extent when measuring repair tissue area and surface roughness. Moreover, differences in local light attenuation suggest measurable variation in tissue structure, enhancing the clinical applicability of quantitative measurements from cartilage OCT images.
Within the diagnostic work-up of degenerative disease in small joints, imaging techniques such as conventional radiographs, computed tomography (CT), and magnetic resonance imaging (MRI) are unable to accurately depict thin cartilage layers in clinical diagnostics.
Optical coherence tomography (OCT) can detect damage to articular cartilage (CitationChu et al. 2010; CitationCernohorsky et al. 2012), and at an earlier stage compared to macroscopic evaluation during arthroscopy (CitationChu et al. 2004, CitationZheng et al. 2010). OCT is analogous to ultrasound, but uses near-infrared light rather than sound to produce high-resolution, cross-sectional images with limited depth penetration (typically up to 2 mm). Relatively recently, the use of OCT in cartilage imaging in large joints such as the knee has been reported (CitationChu et al. 2004, Citation2007, CitationZheng et al. 2010). Also, animal models (CitationHan et al. 2003, CitationPan et al. 2003; CitationAdams et al. 2006, CitationXie et al. 2008, CitationSaarakkala et al. 2009, CitationBear et al. 2010, CitationLiu et al. 2012, CitationVirén et al. 2012) and in vitro studies (CitationDrexler et al. 2001, van CitationBergen et al. 2013) have been used to assess the feasibility of OCT in imaging of osteoarthritic cartilage. A strong correlation was found between the grade of degenerative changes seen on OCT and results of macroscopic evaluation during knee arthroscopy in humans (r = 0.85) (CitationChu et al. 2010). This correlation was also seen when using a histopathology grading scale (r = 0.98) (CitationChu et al. 2004).
In contrast to imaging of the relatively thick cartilage layers of the knee joint (> 2 mm) (CitationChu et al. 2007, CitationBear et al. 2010, CitationChu et al. 2010, CitationZheng et al. 2010), OCT of thin cartilage layers in small joints (CitationHan et al. 2003, CitationPan et al. 2003, CitationAdams et al. 2006, CitationXie et al. 2008, CitationSaarakkala et al. 2009, CitationBear et al. 2010, CitationCernohorsky et al. 2012, CitationLiu et al. 2012, CitationVirén et al. 2012) allows the possibility of depicting the cartilage-bone interface, enabling cartilage thickness measurements. Also, the use of the OCT signal attenuation as a function of depth (µoct) has discriminative capabilities when assessing tissue structure in urology (CitationBus et al. 2013) and gynecology (CitationWessels et al. 2012). The application of similar parameters using the back reflection of light was demonstrated in OCT of horse articular cartilage (CitationVirén et al. 2012). Recently, the use of fiber-optic OCT was demonstrated in minimally invasive imaging of trapeziometacarpal articular cartilage (CitationCernohorsky et al. 2012), paving the way for clinical application during arthroscopy. Thus, OCT remains a promising technique for in situ evaluation of cartilage damage in patients with osteoarthritis in small joints of the wrist or ankle.
Using a goat model in this study, we optimized conditions for the best achievable one-to-one co-localization between 3D OCT images and histopathology, which has not been described before. Here we describe a direct comparison between OCT and histopathology in assessment of the clinically valuable parameters cartilage thickness, repair tissue area, and surface roughness. To reliably assess these parameters simultaneously, we developed custom-made semi-automated analysis software. In addition, quantification of the OCT signal using µoct was performed on all cartilage OCT samples to assess differences between healthy cartilage and repair tissue.
Materials and methods
Subjects and surgical procedure
The study protocol was approved by the animal welfare committee of the Academic Medical Center, University of Amsterdam (ORCA102287). 11 female Dutch milk goats were used. All goats were 4 years of age with a mean weight of 71 (SD 11) kg. To ensure assessment of both healthy tissue and cartilage-like repair tissue during quantitative analysis, osteochondral defects with a diameter of 6.0 mm and a depth of 3.0 mm were created in the tali of the hind legs. Under general anesthesia, an incision was made on the lateral side of the Achilles tendon, exposing the talus (CitationDrexler et al. 2001; van CitationBergen et al. 2013). Using a cannulated drill guide, the osteochondral defects were drilled centrally in the surface of the talus under continuous rinsing with 0.9% NaCl. The joint capsule, subcutaneous tissue, and skin were closed with absorbable sutures. Postoperatively the goats were allowed normal weight bearing and were followed up daily without any restrictions on food or exercise.
The goats were killed after 24 weeks. The tali were cut into 20 × 20 mm blocks, marking the ventral side of the saw plane. Samples were fixed in 4% formaldehyde and dehydrated in ethanol in preparation for further histological processing.
Optical coherence tomography
OCT images were acquired with a commercially available 50-kHz swept source OCT system (Santec Inner Vision 2000) with an optical depth (z-axis) resolution of ~10 μm and lateral (x/y-axis) resolution of ~40 μm, operating at a central wavelength of 1,300 nm with a bandwidth of 120 nm. Cartilage samples were placed on a translation platform in a small petri dish. The OCT scan unit was vertically mounted and focused by moving it towards and from the sample, in order to optimize OCT imaging depth sensitivity. Conceding that there were height differences in the talar articular surface, care was taken to place the surface of the samples at a perpendicular overall angle to the OCT signal beam. Then, 3D OCT datasets were acquired, focusing on the center of the osteochondral defect—producing cross-sectional images perpendicular to the labeled ventral saw plane. Dimensions of the datasets were 400 (z, depth) × 300 (x, length) pixels over 300 (y, width) slices, distributed over a 2.7 (z, refractive index = 1.4 for cartilage) × 12 (x) × 12 (y) mm3 scanned area, resulting in a digital sampling resolution of 10 × 40 × 40 µm3, equivalent to the optical resolution of the system. Raw data were converted to TIFF stacks and calibrated to the appropriate scale. Amira software (version 4.5; Visage Imaging, San Diego, CA) was used for 3D visualization of the datasets.
Histopathology
After OCT scanning, the fixed and dehydrated samples were embedded in methyl methacrylate (MMA). Before sectioning into slices, the previously marked ventral saw plane was re-identified. Samples were placed in the microtome with the marked saw plane perpendicular to the cutting blade. The (regenerated) osteochondral defect was visually located and 5-µm slices were produced halfway through the defect. The slices were stained with hematoxylin and eosin for general cell morphology and identification of cartilage tissue, and visually inspected using light microscopy. Then the slices were scanned using a slide scanner at 4× magnification. Images from scanned slices were converted to TIFF format and calibrated to the appropriate scale.
Matching of OCT with histology
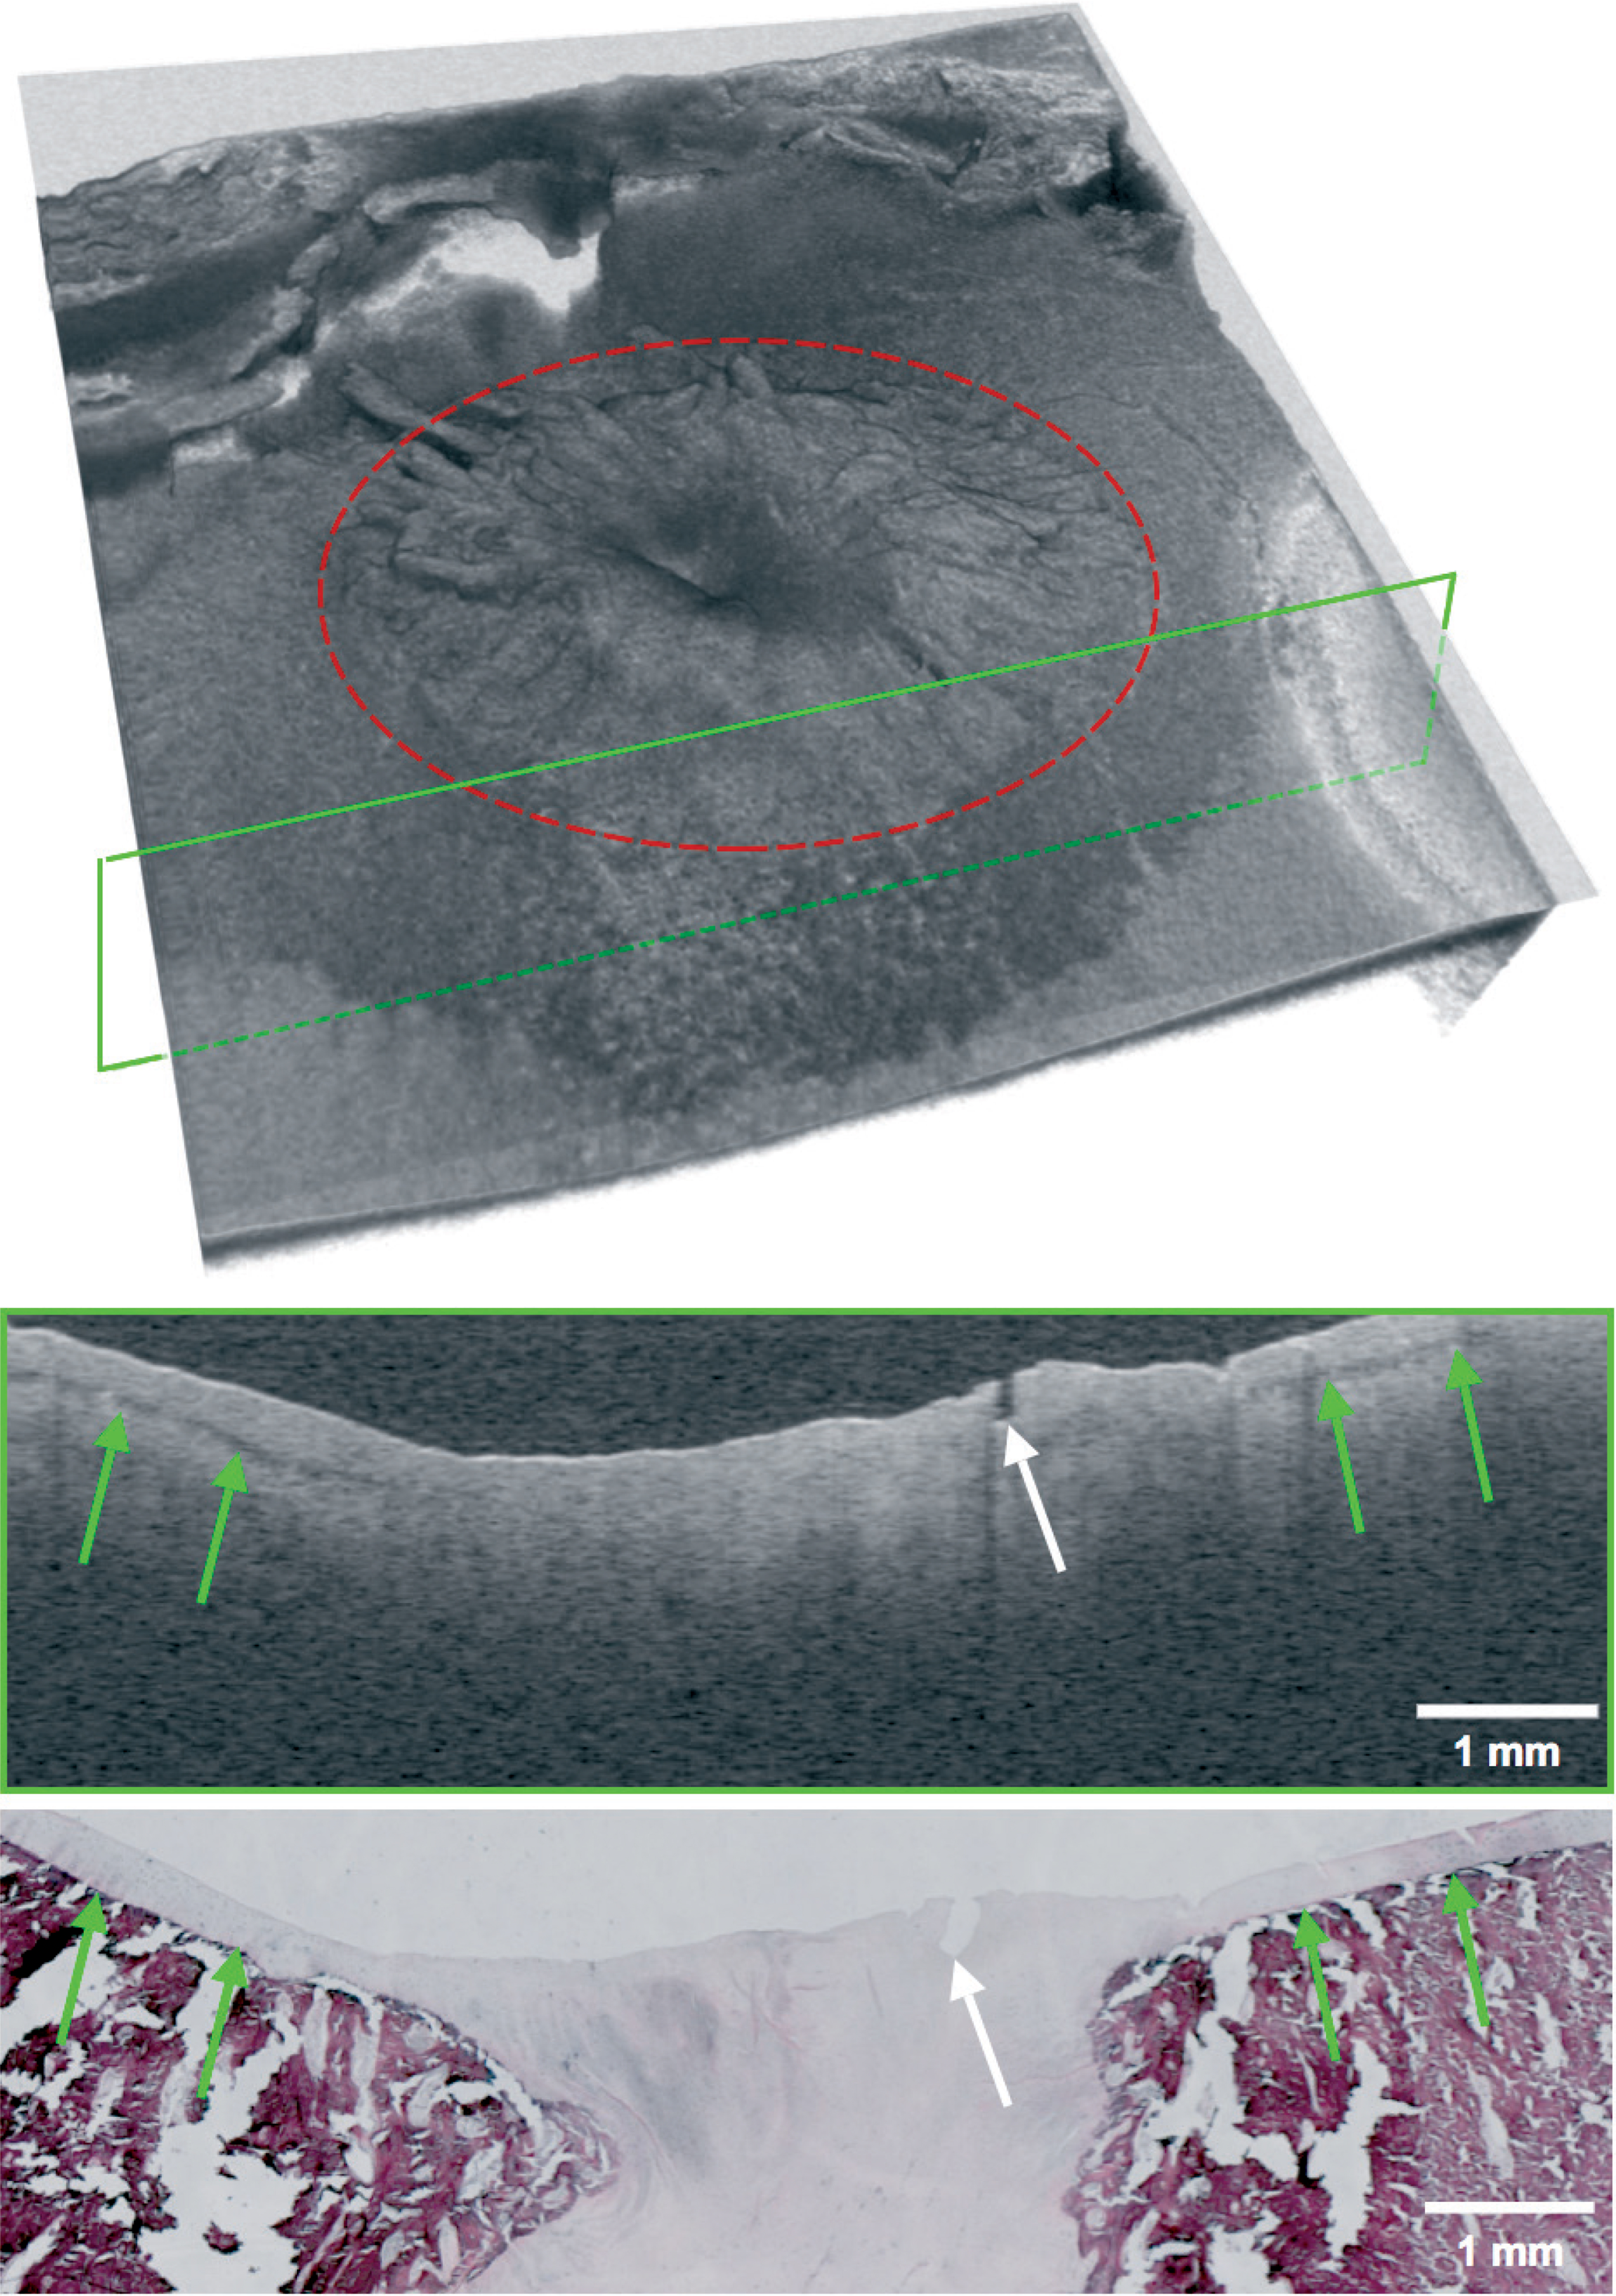
From each talus, 1 histopathology slide clearly depicting the central part of the osteochondral defect was selected for analysis. Where possible, slides with distinct features were selected in order to facilitate matching with corresponding OCT images. From a 300-slice 3D OCT dataset, 1 OCT B-scan was selected for analysis after agreement on matching of structural visual parameters with similar visual parameters in previously selected histopathology slides ().
Figure 1. View of a typical OCT dataset consisting of 300 slices with corresponding single OCT slice (top) and matched histopathology slide (bottom). The site of the osteochondral defect is marked in red and the location of the OCT slide is marked with a green frame. Landmark properties such as small fissures (white arrow) and the transitional zone between cartilage and subchondral zone (green arrows) are identified in both modalities.
Analysis of OCT and histological data
For quantitative analysis, the parameters cartilage thickness, repair tissue area, and surface roughness were chosen since they provide distinct and (clinically) relevant information about the condition of the articular cartilage.
For reproducible measurements, custom-made image analysis software was developed, written as a Java plugin for the open-source image processing software package Fiji. The software incorporates edge detection for identification of the articular surface and assisted drawing of auxiliary lines used for calculation of the 3 descriptive parameters (). For edge detection in both the OCT images and the histopathology images, a median filter was applied. Then a starting (z-) coordinate was chosen, after which the next x-point was found as the maximum of the first derivative of the intensity versus depth in a band around the previous z-value. After smoothing in the x-direction, the final edge was constructed. Auxiliary lines were constructed by manually placing 5 points (in orange) on the normal-appearing cartilage interface, top and bottom, on both sides of the defect. The points were fitted with a fourth-degree polynomial to extrapolate the expected cartilage layer through the osteochondral defect. The top line (in blue) represented the expected trajectory of the articular cartilage top surface when disregarding the osteochondral defect. The bottom auxiliary line (in green) represented the expected transitional zone between cartilage and subchondral bone when disregarding the osteochondral defect.
Figure 2. A. Good match between histopathology and OCT with auxiliary lines created by the analysis software. The pink line represents edge detection. The top and bottom boundaries of the cartilage layer with extrapolation through the osteochondral defect are shown with the blue and green lines, respectively. The vertical red lines mark the location of healthy cartilage and the (start of the) osteochondral defect. Thickness is defined as the average distance between the blue and green line in healthy tissue regions. Area is computed from the area bounded by the pink line and green line in the defect region. Roughness is defined as the root-mean-square distance between the pink line and the blue line in the defect region. B. Fair match between OCT and histopathology, producing noticeable differences in the parameters repair tissue area and surface roughness. Definitions of the parameters are explained above and in the text.
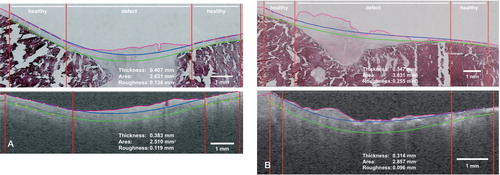
Measured cartilage thickness was defined as the mean thickness of the articular cartilage layer outside the boundaries of the osteochondral defect identified, representing a measurement of healthy articular cartilage thickness in mm. Cartilage repair tissue area was defined as the area marked by the bottom auxiliary line (green), the detected edge (pink), and the lateral boundaries of the osteochondral defect (red), in mm2. Surface roughness was defined as the root mean square of the distance between the top auxiliary line (blue) and the detected edge (pink), restricted by the lateral boundaries of the osteochondral defect (red). For determination of intra-observer variability, all semi-automated analyses were repeated 5 times by the same observer for every OCT and histopathology image, at intervals of at least 1 week.
To correct for learning effects of the observer, the last 3 measurements for each image were used for analysis. Agreement between these measurements was calculated using Spearman’s correlation.
OCT signal attenuation measurements were performed as described previously (CitationFaber et al. 2004). The attenuation per mm-1 (µoct) was calculated using an exponential decay model on the OCT signal amplitude curve as a function of depth after correction for setup-specific calibration parameters (de CitationBruin et al. 2010). These corrections are needed in order to take into account the effects of the point spread function of the optics in the sample arm (van CitationLeeuwen et al. 2003) and the roll-off of the OCT sensitivity with depth. The “healthy cartilage” and “repair tissue” regions were readily identified for analysis of the other quantitative parameters (thickness, repair tissue area, and surface roughness). A region with vertical boundaries at least 400–600 µm apart (10–15 A-lines), to ensure averaging over enough data points, was therefore chosen for attenuation measurements from each predefined region. For the horizontal boundaries, in healthy cartilage, measurements were taken from the air-to-tissue interface (blue lines in ) to the cartilage-bone interface (green lines in ). In repair tissue, measurements were taken from the air-to-tissue interface (pink lines in ) to the location of the lower fitted boundary line (green lines in ). In all cases, care was taken to select a measurement area with an apparently homogeneous OCT signal to give the most reliable attenuation fit.
Statistics
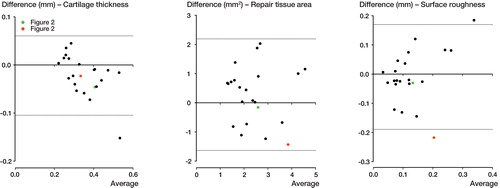
2D plots with linear correlation fit were constructed for direct comparison of OCT values and histopathology values regarding the 3 parameters measured. The slope and goodness of fit (r) of the correlation lines were determined. Since 2 different methods of measurement (OCT and histopathology) were used, Bland-Altman plots were constructed to show the differences between measurements.
To determine agreement between measurements in the OCT and histopathology groups, the intra-class correlation coefficient (ICC) was calculated. An ICC value of 0 indicated poor agreement, between 0 and 0.20 slight agreement, between 0.20 and 0.40 fair agreement, between 0.40 and 0.60 moderate agreement, between 0.60 and 0.80 substantial agreement, and between 0.80 and 1.00 indicated near-perfect agreement. Paired t-tests were used to assess the differences in attenuation measurements between healthy cartilage and repair tissue. Any p-values < 0.05 were considered statistically significant. Statistical analyses were performed using GraphPad Prism 5 and SPSS 19.
Results
22 tali were scanned using the Santec OCT system. The 3D OCT datasets acquired clearly showed the osteochondral defect, located centrally in the scans (). On all OCT scans, similar image characteristics were observed and identification of the cartilage layer and the transitional zone between articular cartilage and subchondral bone was achieved. A distinct dark banding pattern on the cartilage-bone interface was discerned in normal-appearing cartilage; this was not visible in the OCT sections containing the osteochondral defect (indicated by green arrows in ).
Regarding the histopathology, hematoxylin and eosin-stained slides were obtained from all 22 tali. Visual inspection of the articular surface and the site of the osteochondral defect was performed using light microscopy. Care was taken to achieve an accurate match between OCT and histopathology. By visual inspection, a good match was achieved in 13 cases (). However, in 9 cases only a fair match was found between OCT and histopathology, resulting in differences between the parameters measured (). For all the measurements taken into account for analysis, both on OCT and histopathology, inter-observer correlation coefficients were > 0.97, showing reproducibility of measurements.
All the results obtained for the 3 parameters (cartilage thickness, repair tissue area, and surface roughness) by the 2 modalities are depicted in (scatter plots) and (Bland-Altman plots). Exemplary measurements from a good match and a fair match are highlighted in green and red, respectively. When assessing cartilage thickness in the x-y plots, the slope of the regression line was 0.71 (r = 0.93, Pearson’s correlation). With a calculated ICC of 0.95 (95% CI: 0.87–0.98, p < 0.001), agreement between OCT and histopathology regarding thickness measurement was considered to be near-perfect. For repair tissue area, the slope of the regression fit was 0.55 (r = 0.57). With a calculated ICC of 0.73 (95% CI: 0.34–0.87, p = 0.002), agreement between OCT and histopathology when assessing repair tissue area was deemed substantial. For surface roughness, the slope of the regression line was 0.69 (r = 0.48). With a calculated ICC of 0.63 (95% CI: 0.10–0.84, p = 0.02), agreement between OCT and histopathology when assessing surface roughness was substantial.
Figure 3. Graphical comparison between OCT and histopathology (x-y plot). The figure depicts measurements of the quantitative parameters cartilage thickness, repair tissue area, and surface roughness, with fitted linear regression lines. Measurements from a good match between OCT and histopathology (Figure 2A) and a fair match (Figure 2B) are shown in green and red, respectively.
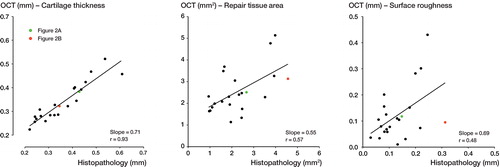
Figure 4. Bland-Altman plots showing the differences between the 2 methods of measurement. The dashed lines represent the 95% limits of agreement. The good match from Figure 2A is shown in green and the fair match from Figure 2B is shown in red.
Attenuation coefficients were measured for all 22 samples, in both healthy cartilage and repair tissue. A difference in attenuation coefficient was observed between the healthy cartilage group (8.2 (SD 3.9) mm-1) and the repair tissue group (2.8 (SD 1.5) mm-1) (p < 0.001). The difference in attenuation denotes a local difference in tissue characteristics and structure.
Discussion
To our knowledge, this is the first report of a direct quantitative comparison of 3D OCT and histopathology in imaging of articular cartilage using semi-automated software with a surface detecting algorithm that calculates the 3 parameters cartilage thickness, repair tissue area, and surface roughness simultaneously. Identification of measurement parameters that are clinically relevant is important for the development of OCT as a clinical diagnostic technique when directed at degenerative joint disease such as osteoarthritis. Since in osteoarthritis, loss of thickness and quality of cartilage are important diagnostic features, thickness appears to be an important parameter to be able to measure accurately. When considering cartilage quality, this is less straightforward since it is a parameter that is difficult to quantify. However, fibrillation of the cartilage surface is a known degenerative feature in the development of osteoarthritis, and was chosen as a relevant parameter to measure. Regarding repair tissue area, measurement of areas of distinct tissue types (for clinical purposes) can help to establish whether there is disease. Since osteochondral defects were created in a standardized procedure, we considered it feasible to attempt to measure its area on a (2D) cross-sectional slice as a precursor to 3D cartilage volume measurements in future.
Our findings show that OCT provided information similar to that from histopathology when we assessed selected quantitative parameters in goat articular cartilage tissue. Previously, structural analysis of articular cartilage has been performed on histopathology alone (CitationPastoureau et al. 2010) or OCT alone (CitationChu et al. 2004), and cartilage thickness has been compared between OCT and histopathology in a rabbit model (CitationHan et al. 2003). Moreover, Han et al. found a near-perfect correlation in thickness measurements between OCT and histopathology (r = 0.96). More recently, better intra- and inter-observer agreement was found when using OCT (69% and 44%, respectively) than when using arthroscopy (57% and 32%, respectively) in assessment of cartilage damage based on the International Cartilage Repair Society (ICRS) grading system (CitationNiemelä et al. 2014). Comparisons have also been made between OCT and ultrasound using parameters such as roughness-, reflection-, and backscattering coefficients for both modalities (CitationVirén et al. 2012), with similar levels of agreement. Also, OCT has shown to be an accurate imaging technique for thickness measurements in thin (tissue) layers (de CitationBruin et al. 2010).
Our custom-devised software enabled standardized and partially automated analysis that was applicable to the 2 different imaging modalities (OCT and histopathology). Intra-observer agreement was measured to be more than 0.90 for all 3 parameters, showing the reliability of the measurement method and software. The ICC for comparison between the 2 groups showed at least substantial agreement in all parameters, and near-perfect agreement for the parameter thickness. Although this means good agreement between OCT and histopathology for cartilage thickness, it also shows to a certain extent the fallibility of the model for measurement of the parameters repair tissue area and surface roughness. Differences measured are partly attributable to a degree of tearing and wrinkling of the tissue slides that will occur during histological processing with a microtome. Moreover, the OCT-derived thickness is linearly dependent on the assumed refractive index, i.e. a lower refractive index would lead to greater measured thickness. Even though the refractive index of most highly scattering tissues is around 1.4 (SD 0.1) (CitationTearney et al. 1995), the exact value for processed specimens such as those in our study is unknown, and it may well be slightly different.
A dark banding pattern was seen at the cartilage-bone interface on the OCT images. Banding patterns have been seen on cartilage OCT images, especially when using polarization-sensitive OCT (PS-OCT) (CitationDrexler et al. 2001). They may well be caused by birefringence due to differences in local collagen fiber orientation, which has been described before using polarized light (CitationChangoor et al. 2011). Further studies using a PS-OCT system are needed to measure the polarization properties of cartilage tissue.
The present study revealed that a direct quantitative comparison between OCT and histopathology was not exemplary for the parameters repair tissue area and surface roughness. In general, when comparing tissue structures from 2D histopathology slides to a selected slice from a 3D OCT dataset, accurate matching is crucial for reliable measurements. Small changes in orientation of the slides compared to the OCT scans may have occurred during matching, mainly as a result of histological processing, inevitably leading to minor differences in measurement.
Clinical implications
The value of OCT compared to the information from histopathology slides suggests an important (clinical) advantage. Regions of interest are investigated more easily on OCT, since orientation of the images is no longer an issue that should be taken into account. Also, in our study, accurate perpendicular alignment of the OCT camera with respect to the sample ensured the largest (3D) field of view possible. For clinical application and using fiber-optic OCT, a flexible, sideward-looking OCT probe would permit easier (and more natural) perpendicular placement of the OCT beam in relation to the sample, automatically correcting for this alignment issue.
Previous reports have shown virtually perfect correlations between quantitative measurements in 2D OCT and histopathology. Oddly, we did not succeed in replicating the same level of correlation using 3D OCT. Since small differences in sub-millimeter measurements appear to be inevitable, an accurate description of the methods of matching between OCT and histopathology is important—as is extraction of quantitative parameters.
Modern, non-invasive imaging techniques such as high-field-strength MRI (HF-MRI) may provide new insights in the development of osteoarthritis. However, development of dedicated HF-MRI cartilage sequences (at 5 or 7 Tesla) is slow—and to our knowledge, not yet fit for clinical practice. More conventional field strengths (1.5 and 3 Tesla) lack signal-to-noise ratio and spatial resolution to accurately depict the thin cartilage layers that are the subject of the present study. While the development of HF-MRI is very inspiring and clinical application would be a major contribution to the field, until such time, the development of high-resolution optical techniques such as in situ OCT for clinical cartilage imaging may enhance our understanding of the etiology and progression of disease. Moreover, in contrast to non-invasive imaging such as MRI, OCT can be used hands-on by the surgeon during operative procedures such as arthroscopy.
When light attenuation was assessed, a significant difference was found between healthy cartilage and repair tissue. This shows that healthy cartilage and repair tissue (as we defined it in this study) have distinct optical properties causing the observed differences in attenuation, although it is as yet unknown which (cellular) components in cartilage tissue play the main role. Differences in light attenuation will have to be confirmed by morphological differences in local tissue structure in future studies. However, the attenuation coefficient as a quantifiable measure of pathology in degenerative joint disease greatly enhances the value of OCT as a non-destructive diagnostic technique.
Finally, OCT has already been shown to be able to monitor disease in an animal osteoarthritis model (CitationAdams et al. 2006). In addition, the feasibility of in situ cartilage measurements in a small wrist joint has been demonstrated (CitationCernohorsky et al. 2012), making quantification of structures from cartilage OCT images a valuable addition to clinical disease monitoring in osteoarthritis of small joints. In summary, the combination of high-resolution non-destructive imaging, percutaneous access for in situ measurements using fiber-optic OCT, hands-on use by the attending physician, and the quantitative information that the OCT signal can provide could make OCT a very promising technique for clinical imaging of small-joint osteoarthritis in the near future.
Study design: PC, AK, DB, GK, GT, and SS. Data acquisition: PC, AK, DB, GK, and GT. Data analysis: PC, DB, and MB. Interpretation of data: PC, DB, DF, and TL. Drafting of manuscript: PC, DB, and SS. Revision of manuscript: AK, MB, GK, GT, TL. All the authors approved the final version of the manuscript.
No competing interests declared.
- Adams S B, Herz P R, Stamper D L, Roberts M J, Bourquin S, Patel N A, et al. High-resolution imaging of progressive articular cartilage degeneration. J Orthop Res 2006; 24(4): 708–15.
- Bear D M, Szczodry M, Kramer S, Coyle C H, Smolinski P, Chu C R. Optical coherence tomography detection of subclinical traumatic cartilage injury. J Orthop Trauma 2010; 24(9): 577–82.
- Bus M T J, Muller B G, de Bruin D M, Faber D J, Kamphuis G M, van Leeuwen T G, et al. Volumetric in vivo visualization of upper urinary tract tumors using optical coherence tomography: a pilot study. J Urol 2013; 190(6): 2236–42.
- Cernohorsky P, de Bruin D M, van Herk M, Bras J, Faber D J, Strackee S D, et al. In-situ imaging of articular cartilage of the first carpometacarpal joint using co-registered optical coherence tomography and computed tomography. J Biomed Opt 2012; 17(6): 060501.
- Changoor A, Nelea M, Méthot S, Tran-Khanh N, Chevrier A, Restrepo A, et al. Structural characteristics of the collagen network in human normal, degraded and repair articular cartilages observed in polarized light and scanning electron microscopies. Osteoarthritis Cartilage 2011; 19(12): 1458–68.
- Chu C R, Lin D, Geisler J L, Chu C T, Fu F H, Pan Y. Arthroscopic microscopy of articular cartilage using optical coherence tomography. Am J Sports Med 2004; 32(3): 699–709.
- Chu C R, Izzo N J, Irrgang J J, Ferretti M, Studer R K. Clinical diagnosis of potentially treatable early articular cartilage degeneration using optical coherence tomography. J Biomed Opt 2007; 12(5): 051703.
- Chu C R, Williams A, Tolliver D, Kwoh C K, Bruno S, Irrgang J J. Clinical optical coherence tomography of early articular cartilage degeneration in patients with degenerative meniscal tears. Arthritis Rheum 2010; 62(5): 1412–20.
- de Bruin D M, Bremmer R H, Kodach V M, de Kinkelder R, van Marle J, van Leeuwen T G, et al. Optical phantoms of varying geometry based on thin building blocks with controlled optical properties. J Biomed Opt 2010; 15(2): 025001.
- Drexler W, Stamper D, Jesser C, Li X, Pitris C, Saunders K, et al. Correlation of collagen organization with polarization sensitive imaging of in vitro cartilage: implications for osteoarthritis. J Rheumatol 2001; 28(6): 1311–8.
- Faber D, van der Meer F, Aalders M, van Leeuwen T. Quantitative measurement of attenuation coefficients of weakly scattering media using optical coherence tomography. Opt Express 2004; 12(19): 4353–65.
- Han C W, Chu C R, Adachi N, Usas A, Fu F H, Huard J, et al. Analysis of rabbit articular cartilage repair after chondrocyte implantation using optical coherence tomography. Osteoarthritis Cartilage 2003; 11(2): 111–21.
- Liu B, Vercollone C, Brezinski M E. Towards improved collagen assessment: polarization-sensitive optical coherence tomography with tailored reference arm polarization. Int J Biomed Imaging 2012; 2012: 892680.
- Niemelä T, Virén T, Liukkonen J, Argüelles D, Moller te N C R, Puhakka P H, et al. Application of optical coherence tomography enhances reproducibility of arthroscopic evaluation of equine joints. Acta Vet Scand 2014; 56(1): 3.
- Pan Y, Li Z, Xie T, Chu C R. Hand-held arthroscopic optical coherence tomography for in vivo high-resolution imaging of articular cartilage. J Biomed Opt 2003; 8(4): 648–54.
- Pastoureau P C, Hunziker E B, Pelletier J-P. Cartilage, bone and synovial histomorphometry in animal models of osteoarthritis. Osteoarthritis Cartilage 2010; 18 Suppl 3: S106–12.
- Saarakkala S, Wang S-Z, Huang Y-P, Zheng Y-P. Quantification of the optical surface reflection and surface roughness of articular cartilage using optical coherence tomography. Phys Med Biol 2009; 54(22): 6837–52.
- Tearney G J, Brezinski M E, Southern J F, Bouma B E, Hee M R, Fujimoto J G. Determination of the refractive index of highly scattering human tissue by optical coherence tomography. Opt Lett 1995; 20(21): 2258.
- van Bergen C J A, Kerkhoffs G M M J, Marsidi N, Korstjens C M, Everts V, van Ruijven L J, et al. Osteochondral defects of the talus: a novel animal model in the goat. Tissue Eng Part C Methods 2013; 19(6): 449–57.
- van Leeuwen T G, Faber D J, Aalders M C. Measurement of the axial point spread function in scattering media using single-mode fiber-based optical coherence tomography. IEEE J Select Topics Quantum Electron 2003; 9(2): 2 27–33.
- Virén T, Huang Y P, Saarakkala S, Pulkkinen H, Tiitu V, Linjama A, et al. Comparison of ultrasound and optical coherence tomography techniques for evaluation of integrity of spontaneously repaired horse cartilage. J Med Eng Technol 2012; 36(3): 185–92.
- Wessels R R, de Bruin D M D, Faber D J D, van Boven H H H, Vincent A D A, van Leeuwen T G T, et al. Optical coherence tomography in vulvar intraepithelial neoplasia. J Biomed Opt 2012; 17(11): 116022–2.
- Xie T, Xia Y, Guo S, Hoover P, Chen Z, Peavy G M. Topographical variations in the polarization sensitivity of articular cartilage as determined by polarization-sensitive optical coherence tomography and polarized light microscopy. J Biomed Opt 2008; 13(5): 054034.
- Zheng K, Martin S D, Rashidifard C H, Liu B, Brezinski M E. In vivo micron-scale arthroscopic imaging of human knee osteoarthritis with optical coherence tomography: comparison with magnetic resonance imaging and arthroscopy. Am J Orthop 2010; 39(3): 122–5.