
Abstract
Background and purpose — Charcot neuropathy is characterized by bone destruction in a foot leading to deformity, instability, and risk of amputation. Little is known about the pathogenic mechanisms. We hypothesized that the bone-regulating Wnt/β-catenin and RANKL/OPG pathways have a role in Charcot arthropathy.
Patients and methods — 24 consecutive Charcot patients were treated by off-loading, and monitored for 2 years by repeated foot radiography, MRI, and circulating levels of sclerostin, dickkopf-1, Wnt inhibitory factor-1, Wnt ligand-1, OPG, and RANKL. 20 neuropathic diabetic controls and 20 healthy controls served as the reference.
Results — Levels of sclerostin, Dkk-1 and Wnt-1, but not of Wif-1, were significantly lower in Charcot patients than in the diabetic controls at inclusion. Dkk-1 and Wnt-1 levels responded to off-loading by increasing. Sclerostin levels were significantly higher in the diabetic controls than in the other groups whereas Wif-1 levels were significantly higher in the healthy controls than in the other groups. OPG and RANKL levels were significantly higher in the Charcot patients than in the other groups at inclusion, but decreased to the levels in healthy controls at 2 years. OPG/RANKL ratio was balanced in all groups at inclusion, and it remained balanced in Charcot patients on repeated measurement throughout the study.
Interpretation — High plasma RANKL and OPG levels at diagnosis of Charcot suggest that there is high bone remodeling activity before gradually normalizing after off-loading treatment. The consistently balanced OPG/RANKL ratio in Charcot patients suggests that there is low-key net bone building activity by this pathway following diagnosis and treatment. Inter-group differences at diagnosis and changes in Wnt signaling following off-loading treatment were sufficiently large to be reflected by systemic levels, indicating that this pathway has a role in bone remodeling and bone repair activity in Charcot patients. This is of particular clinical relevance considering the recent emergence of promising drugs that target this system.
Charcot neuropathy mainly affects diabetic patients with bilateral peripheral neuropathy and is characterized by degenerative changes of the bone, joints, and soft tissues of the foot and ankle. However, the pathophysiological processes that lead to acute Charcot foot remain obscure. The identification of a cytokine system belonging to the tumor necrosis factor family—consisting of RANKL (receptor activator of nuclear factor-κB ligand), its receptor RANK (receptor activator of nuclear factor-κB), and its soluble decoy receptor, osteoprotegerin (OPG)—has substantially increased our understanding of bone regulatory mechanisms responsible for osteolytic activity by osteoclasts. The RANKL/OPG pathway has therefore been implicated in an increasing number of diseases affecting the bone, and several review articles have hypothesized about the possible role of this pathway in Charcot arthropathy (CitationJeffcoate 2008, CitationMascarenhas and Jude 2013), although only a few studies have been published. Although there has been much interest in RANKL/OPG signaling, recent research has significantly increased our understanding of the pivotal role played by other pathways in bone regulation. One such pathway is that of Wnt, which has been shown to be a key regulator of embryonic bone development, mechanical loading and unloading of the skeleton, bone growth, bone remodeling, and fracture repair by increasing osteoblast commitment from progenitor cells and by stimulating their proliferation and activation (CitationAgholme and Aspenberg 2011, CitationKim et al. 2013). In addition, there is crosstalk between the bone anabolic Wnt pathway and the bone-catabolic RANKL/OPG pathway (CitationDiarra et al. 2007), with recent studies suggesting that the Wnt pathway is in control of osteoclast differentiation and activation through its actions on the osteoblasts, and by participating in osteoclast recruitment and the initiation of bone remodeling (CitationBellido 2014). We are not aware of any study investigating the role of the Wnt system in the pathology of Charcot arthropathy.
In this 2-year longitudinal, observational study in Charcot patients, we repeatedly measured plasma levels of endogenous mediators forming part of the RANKL/OPG and Wnt/ß-catenin pathways with the aim of elucidating their role in the pathophysiology of Charcot arthropathy from the acute phase until reaching a cold/chronic state.
Material and methods
Patient selection and treatment
26 consecutive ambulatory men (n = 15) and women (n = 11) admitted to Sahlgrenska University Hospital, Mölndal with clinical signs of unilateral acute Charcot’s foot were included in the study during the period 2009–2014. 2 patients died shortly after inclusion and were excluded. 1 patient interrupted participation after 18 months, after being informed that radiographs showed finalized bone healing, but this patient did not object to data being processed in the study. Diagnosis of Charcot foot was based on medical history, clinical examination, and radiological findings including the following criteria: (1) type-1 or type-2 diabetes with a duration of ≥ 1 year, (2) peripheral bilateral neuropathy as defined below, and (3) clinical signs of active Charcot arthropathy with hot/reddened/swollen foot and skin temperature in the affected foot ≥ 2oC higher than in the contralateral foot. Off-loading treatment of the diseased foot by a non-weight bearing total contact cast (TCC) was introduced in all Charcot patients within 1 day of inclusion in the study. The TCC was repeatedly replaced as required from changes in foot volume due to increased or attenuated swelling. The non-weight-bearing protocol was supplemented with crutches or wheel-chair and was continued until the difference in skin temperature between the feet was ≤ 1oC and there had been no signs of redness or swelling for the previous 30 days. The TCC was then replaced by orthosis for partial weight bearing. Evaluation of skin temperature and toe pressure was continued until 2 years after inclusion. When full weight bearing was allowed, the patient was given accommodative shoes. Bilateral foot radiographs and magnetic resonance imaging (MRI) at inclusion and repeatedly during the follow-up period were used to monitor fractures, dislocations, and soft-tissue- or bone marrow edema.
Exclusion criteria were plantar ulcerations, documented history of trauma or surgery involving bone tissue during the year before inclusion, current immunosuppressive therapy (steroids or cancer treatment), or medication known to affect bone metabolism (e.g. bisphosphonates, denosumab). A control group of 20 ambulatory diabetes type-1 or type-2 patients with neuropathy documented as described below was included at Frölunda Specialist Hospital during 2011 and another control group of 20 healthy subjects was included at Sahlgrenska University Hospital/Mölndal during 2010. Neither of the control groups had any history of joint/bone disease or bone trauma/surgery in the year before inclusion and they had not received any osteoporosis medication.
Skin sensitivity, skin temperature and toe pressure
Skin sensitivity (neuropathy) was measured in Charcot foot patients and diabetic control patients bilaterally at inclusion, at 4 different locations of the foot using the Semmes-Weinstein monofilament test. The monofilament (10 g) was pressed against the skin and the patient’s ability or inability to feel the sensation upon buckling of the monofilament was registered. Neuropathy was present if 3 or more sites were insensitive to the monofilament. Skin temperature was measured bilaterally on the dorsal foot, 5 cm distal to the ankle and 2 cm proximal to the mid-toe. Toe blood pressure was measured bilaterally using a specially designed cuff (CitationSamuelsson et al. 1996). Measurements of skin temperature and toe pressure were performed at inclusion, at 1 week, and 2, 4, 6, 8, 12, 18, and 24 months thereafter.
Blood samples
Peripheral venous blood was collected for routine analysis (hemoglobin, serum creatinine, CRP, SR, and HbA1c) and for cytokine analysis (pre-chilled EDTA tubes immediately centrifuged at 3,000× g for 10 min at 4°C before being stored at −85oC until analysis). Blood was collected at inclusion, at 1 week, and 2, 4, 6, 8, 12, 18, and 24 months after inclusion. Before analysis, samples were thawed on ice before being mounted on assay plates and analyzed for OPG, RANKL, sclerostin, dickkopf-1 (Dkk-1), Wnt ligand-1 (Wnt-1), and Wnt inhibitory factor-1 (Wif-1).
Determination of plasma biomarkers by ECL technology
The Sector Imager 2400 assay platform from MesoScaleDiagnostics (MSD; Gaithersburg, MD) was used for biomarker analysis (for details see www.meso-scale.com). Quantitative measurements were done using a matched pair of anti-human (ah) antibodies, i.e. capture antibody (CA) and biotinylated detection antibody (DA). Standard curves were created using the corresponding human recombinant proteins (hRPs). Samples were applied to uncoated standard plates from MSD (cat. no. L15XA). OPG CA: affinity-purified polyclonal rabbit ahOPG antibody (PeproTech cat. no.500-P149); OPG DA: biotinylated polyclonal rabbit ahOPG antibody (ReproTech cat no. 500-P149Bt), hRP (450-14). RANKL CA: monoclonal mouse IgGκ ahRANKL antibody (ReproTech cat. no. 500-M46); RANKL DA: biotinylated goat polyclonal ahRANKL antibody (ReproTech cat. no. 500-P133GBT), hRP (310-01). RANKL antibodies were directed against the soluble form of RANKL corresponding to the amino acid sequence 143–317 of the full-length RANKL molecule. Sclerostin CA: monoclonal mouse IgG2B ahsclerostin antibody (R&D Systems (Minneapolis, MN) cat. no. MAB1406); sclerostin DA: biotinylated monoclonal mouse IgG1 ahsclerostin antibody (R&D Systems cat no. BAM1406), hRP (1406-ST-025). Dkk-1 CA: monoclonal mouse IgG2B ahDkk-1 antibody (R&D Systems cat. no. MAB10962); Dkk-1 DA: biotinylated affinity-purified goat polyclonal IgG ahDkk-1 antibody (R&D Systems cat. no. BAF1096), hRP (PeproTech cat. no. 120-30). Wnt-1 CA: affinity-purified polyclonal rabbit ahWnt-1 antibody (Reprotech cat. no. 500-P250); Wnt-1 DA: biotinylated polyclonal rabbit ahWnt-1 antibody (Peprotech cat. no. 500-P250Bt), hRP (450-14). Wif-1 CA: monoclonal mouse IgG1 ahWnt-1 antibody (R&D Systems cat. no. MAB1342); Wif-1 DA: biotinylated monoclonal mouse IgG1 ahWnt-1 antibody (R&D Systems cat. no. BAM1341), hRP (1341-WF-50). Optimization of primary and secondary antibodies was done by checkerboard titration and subsequent checking of standard curves against plasma from healthy donors.
Radiography
Radiographs of both feet were performed in supine position with dorso-plantar, oblique, and lateral projections as well as weight bearing in frontal and lateral projections. MRI was performed on a 1.5-T Siemens Magnetom Symphony scanner with the patient supine and feet-first into the gantry. All examinations were performed with a head-neck surface coil and with the feet in flexed position. The feet were examined with 4 sequences each and without intravenous contrast medium: T1, T2, T2 3d, and STIR sequences in sagittal, transverse, and coronary positions. Following administration of intravenous contrast medium, transverse and sagittal projections were obtained by T-sequences. Radiographic and MRI examinations were performed according to a preset schedule within a week of being assigned to the study, and then 6, 12, 18, and 24 months after inclusion.
For anatomical classification of Charcot arthropathy, we used the system previously described (CitationPapanas and Maltezos 2013) with 5 different patterns depending on the areas of the foot affected; i.e. pattern 1: metatarsophalangeal and interphalangeal joints; pattern 2: tarso-metatarsal joints; pattern 3: naviculocuneiform, talonavicular and calcaneocuboid joints; pattern 4: ankle and subtalar joints; and pattern 5: calcaneus. As the sensitivity differs substantially between plain radiographs and MRI regarding identification of the early stages of Charcot, we included both a modified Eichenhotz staging based on plain radiographs as described by CitationSella and Barrette (1999) and an MRI-based identification of early inflammation-induced signs of Charcot arthropathy (CitationChantelau and Grutzner 2014). The staging by Sella and Barrette comprises 5 stages: stage 0 (warm, reddened, swollen foot and normal radiographs); stage 1 (clinical findings and radiographic cysts, erosions, localized osteopenia, and occasionally diastases); stage 2 (joint subluxation); stage 3 (dislocation and arch collapse); and stage 4 (healed stage of bony process). The severity of inflammation in the Charcot foot on MRI was graded in 2 stages, inactive or active, depending on the presence or absence of skeletal inflammation/bone edema.
Statistics
Before analyzing the data by repeated measures ANOVA, we tested for a number of assumptions to be met. The variables tested (biomarkers) were measured at a continuous level over time, and a comparison was made between the 3 independent study groups for each individual biomarker at inclusion and 2 years after inclusion by means of 1-way repeated measures ANOVA followed by the Holm-Šidak test. Where applicable, this model was used for comparisons of blood pressure, Hb, CRP, SR, and S-kreatinin between the 3 study groups (). This statistical model ensures that the probability of incorrectly rejecting the null hypothesis for any of the pairwise comparisons in the family does not exceed alpha, thereby controlling the family-wise error rate (FWE) and setting the alpha value according to Šidak correction of Bonferroni inequality. This stepwise method is generally more powerful than the corresponding single-step procedures. The Holm-Šidak test applies an accept/reject criterion to a sorted set of null hypotheses, starting from the lower p-value and going up to the acceptance of the null hypothesis. For each comparison, the alpha value is set according to Šidak correction of Bonferroni inequality. The Šidak formula is: Šidak corrected alpha = 1 − (1 − α)1/k where k is the number of comparisons performed for each individual biomarker (3 in our study). The Šidak procedure has slightly more power than the Bonferroni procedure when alpha = 0.05. A multiplicative model was assumed to be more accurate for the current data, and the logarithms of measurements were therefore used for the comparisons. Comparisons between 2 datasets of individual biomarkers within the Charcot group (e.g. at inclusion vs. 4 months) were performed by Wilcoxon rank sum test. Comparison of HbA1c between the Charcot and diabetic control groups was done by Mann-Whitney U-test ()
Table 1. Clinical and demographic data in Charcot patients, diabetes controls, and healthy subjects
The statistical program identified significant outliers in the related groups for RANKL when analysis was run using polyclonal detection antibody. In order to satisfy the condition of not having outliers (i.e. ≥10× the median value), we tested with a monoclonal ahRANKL capture antibody, which eliminated significant outliers and satisfied this requirement.
Ethics
The study was approved in 2007 by the Review Board of the Västra Götaland Region (EPN entry number 499-07), with additional approval in 2010 (T 762-10 ad 499-07). All the subjects provided informed consent before participating in the study. The study complied with the STROBE statement for observational studies (www.strobe-statement.org).
Results
Clinical and demographic data are presented in . In Figures 4, 5C, , , and 8C, the results are given as linear graphs representing repeated measurements of individual biomarkers ranging over the entire period of observation from inclusion until 2 years after inclusion. In the other figure panels, the box plots illustrate inter-group comparisons at inclusion and 2 years after inclusion with the median represented by the horizontal line within the box, the 25th and 75th percentiles represented by the box, the 5th and 95th percentiles represented by the whiskers, and outliers represented by dots.
OPG
OPG (ng/mL) levels were significantly higher in Charcot patients and diabetic controls than in healthy subjects, whereas OPG levels in Charcot patients and diabetic controls were similar (). OPG at 2 years was significantly higher in diabetic controls than in healthy subjects and Charcot patients, but they were similar in Charcot patients and healthy subjects (). Plasma OPG was significantly higher in Charcot patients at inclusion than at 2 years (p < 0.001).
Figure 1. A and B. Box plots of plasma osteoprotegerin values (OPG, ng/mL) in Charcot patients (n = 24), diabetic controls (n = 20), and healthy subjects (n = 20) at inclusion (A) and at termination of the study after 2 years (B). Inter-group comparison performed by 1-way repeated measures ANOVA and post-hoc Holm-Šidak test.
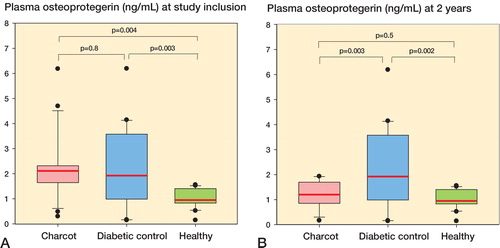
As circulating OPG has been linked to cardiovascular and renal disease (CitationBjerre 2013, CitationKlejna et al. 2009), we identified Charcot patients with such diseases () and compared their plasma OPG levels to those of the diabetic control group as a whole (excluding nephropathy and cardiopathy patients). There was no significant difference (p = 0.3) between Charcot patients with nephropathy (n = 7) and those without (n = 17) (mean 2.44 (SEM 0.15) ng/mL vs. 2.15 (SEM 0.28) ng/mL). Similarly, mean OPG levels in Charcot patients with cardiopathy (n = 4) and those without (n = 20) were not significantly different (p = 0.5) (2.40 (SEM 0.29) ng/mL vs. 2.0 (SEM 0.24) ng/mL). The numbers of patients with renal/cardiac affection in the diabetes control group were too small for statistical analysis ().
RANKL
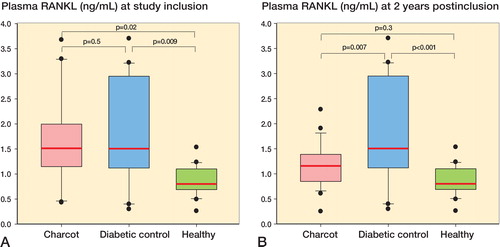
At inclusion, plasma RANKL levels (in ng/mL) were significantly higher in Charcot patients than in healthy subjects and significantly higher in diabetic controls than in healthy subjects, but they were similar in Charcot patients and in diabetic controls (). At 2 years, plasma RANKL levels were significantly higher in diabetes controls than in healthy subjects and Charcot patients, whereas they were not significantly different in Charcot patients and healthy subjects (). Plasma RANKL levels were significantly higher in Charcot patients at inclusion than at 2 years (p = 0.04).
Figure 2. A and B. Box plots of plasma receptor activator of nuclear factor-κB ligand (RANKL, ng/mL) in Charcot patients (n = 24), diabetic controls (n = 20), and healthy subjects (n = 20) at inclusion (A) and at termination of the study after 2 years (B).
OPG-RANKL ratio
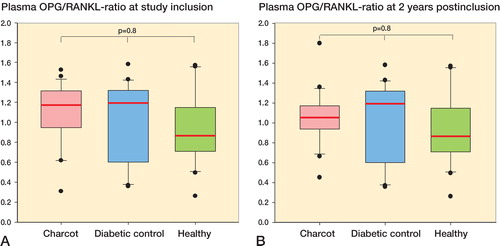
OPG-RANKL ratio was similar between Charcot patients, diabetes controls, and healthy subjects at inclusion () and at 2 years after inclusion (). Repeated measurements of plasma OPG, plasma RANKL, and OPG-RANKL ratio from diagnosis until 2 years showed a sharp decline in OPG and RANKL at 8 months after inclusion, whereas OPG-RANKL ratio remained in balance throughout the study (Figure 4, see Supplementary data).
Figure 3. A and B.Box plots of plasma OPG-RANKL ratio in Charcot patients (n = 24), diabetic controls (n = 20), and healthy subjects (n = 20) at inclusion (A) and at termination of the study after 2 years (B).
Sclerostin
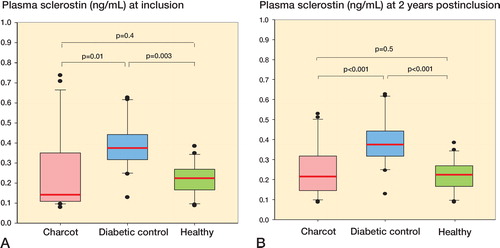
Sclerostin levels at inclusion were significantly higher in diabetes controls than in Charcot patients and healthy subjects, but they were similar in Charcot patients and healthy subjects (). At 2 years, sclerostin levels were significantly higher in diabetes controls than in healthy subjects and Charcot patients, but they were similar in Charcot patients and in healthy subjects (). The trajectory of sclerostin in Charcot patients throughout the observation period of 2 years—based on repeated sampling over time and relative to diabetes controls and healthy subjects—was similar at inclusion and 2 years after inclusion (Figure 5C, see Supplementary data).
Figure 5. A and B. Box plots of plasma sclerostin (ng/mL) in Charcot patients (n = 24), diabetic controls (n = 20), and healthy subjects (n = 20) at inclusion (A) and at termination of the study after 2 years (B).
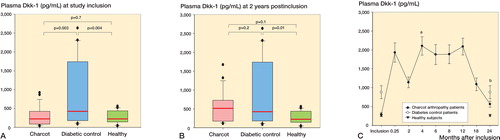
Dkk-1
Dkk-1 levels at inclusion were significantly higher in diabetes controls than in Charcot patients and healthy subjects, but they were similar in Charcot patients and healthy subjects (). At 2 years, Dkk-1 levels were significantly higher in diabetes controls than in healthy subjects, but not significantly higher than in Charcot patients. Again, they were not significantly different in Charcot patients and healthy subjects (). illustrates the Trajectory Of Plasma Dkk-1 (in pg/mL) in Charcot patients throughout the observation period of 2 years, based on repeated sampling over time and relative to diabetes controls and healthy subjects. Plasma Dkk-1 levels in Charcot patients were significantly higher at 4 months and 2 years after inclusion than at inclusion.
Figure 6. A and B. Box plots of plasma Dickkopf-1 (Dkk-1, pg/mL) in Charcot patients (n = 24), diabetic controls (n = 20), and healthy subjects (n = 20) at inclusion (A) and at termination of the study after 2 years (B). C. Trajectory of plasma Dkk-1 in Charcot patients throughout the observation period of 2 years, based on repeated sampling over time and relative to diabetic controls and healthy subjects. Mean (SEM). a p = 0.009 for Charcot patients at 4 months vs. Charcot patients at inclusion; b p = 0.01 for Charcot patients at 2 years vs. Charcot patients at inclusion, as analyzed by Mann-Whitney rank sum test.
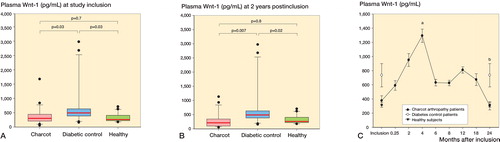
Wnt-1
Wnt-1 levels at inclusion were significantly higher in diabetes controls than in healthy subjects and Charcot patients, but they were similar in Charcot patients and in healthy subjects (). At 2 years, Wnt-1 levels were significantly higher in diabetes controls than in healthy subjects and Charcot patients, but they were similar in Charcot patients and healthy subjects (). illustrates the trajectory of Wnt-1 (in pg/mL) in Charcot patients throughout the observation period of 2 years, based on repeated sampling over time and relative to diabetes controls and healthy subjects. Plasma Wnt-1 levels in Charcot patients were significantly higher at 4 months than at inclusion, but at 2 years they were similar to the levels at inclusion.
Figure 7. A and B. Box plots of plasma Wnt ligand-1 (Wnt-1, pg/mL) in Charcot patients (n = 24), diabetic controls (n = 20), and healthy subjects (n = 20) at inclusion (A) and at termination of the study after 2 years (B). C. Trajectory of plasma Wnt-1 in Charcot patients throughout the observation period of 2 years, based on repeated sampling over time and relative to diabetic controls and healthy subjects. Mean (SEM). a p = 0.003 for Charcot patients at 4 months vs. Charcot patients at inclusion; b p = 0.2 for Charcot patients at 2 years vs. Charcot patients at inclusion, as analyzed by Mann-Whitney rank sum test.
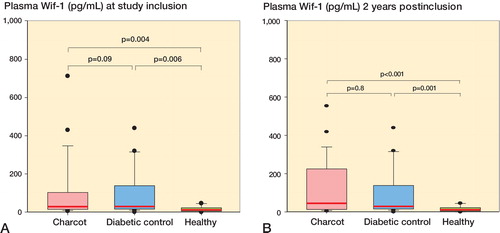
Wif-1
Wif-1 levels at inclusion were significantly higher in diabetes controls than in healthy subjects and significantly higher in Charcot patients than in healthy subjects, but they were similar in Charcot patients and diabetes controls (). At 2 years, Dkk-1 levels were significantly higher in diabetes controls than in healthy subjects and significantly higher in Charcot patients than in healthy subjects but they were similar in Charcot patients and diabetes controls (). Wif-1 levels in Charcot patients at 4 months and at 2 years were similar to the levels in these patients at inclusion (Figure 8C, see Supplementary data).
Figure 8. A and B. Box plots of plasma Wnt inhibitory factor-1 (Wif-1, pg/mL) in Charcot patients (n = 24), diabetic controls (n = 20), and healthy subjects (n = 20) at inclusion (A) and at termination of the study after 2 years (B).
Radiographic data
1 patient lacked data after 18 months due to interrupted participation. All the study patients had reached complete mineralization on radiographs and there were no signs of inflammation on MRI at 2 years after inclusion ().
Table 2. Staging of radiographic changes in the Charcot arthropathy foot as described by CitationSella and Barrette (1999) based on weight-bearing radiographic examinations of the diseased foot; also, inflammation/bone edema on MRI based on activity (see Chantelau and Grutzner 2014) . Numbers in the table are numbers of patients.
Discussion
Patient selection and confounding factors
We did not do repeated blood sampling in healthy and diabetic controls, as we did not expect their clinical and laboratory variables to undergo substantial changes during the short duration of the study. Biomarker data from these groups were thus used as a reference for the Charcot group, both at inclusion and at the end of the study. Frequent routine monitoring in diabetic control patients enabled us to compare laboratory data at inclusion and 2 years later, confirming that no substantial changes had occurred during the course of the study.
OPG is involved in cardiovascular disease (CitationBjerre 2013) and chronic renal disease (CitationKlejna et al. 2009), conditions that often affect diabetic patients. However, comparison of plasma OPG levels in Charcot patients with or without nephropathy and/or heart disease () did not reveal any substantial differences, which is in line with previous reports mainly linking high OPG to HbA1c and the hyperglycemic state rather than to diabetes-related vascular complications (CitationBjerre 2013).
The RANKL/OPG pathway
Only 2 previous studies have investigated OPG and RANKL in Charcot patients. CitationMabilleau et al. (2008) compared peripheral blood monocytes from diabetic Charcot patients, diabetic controls, and healthy subjects and found higher numbers of osteoclasts and increased osteolytic activity in Charcot patients. Osteolysis was augmented further by RANKL but only partially inhibited by OPG in Charcot patients, suggesting that other mechanisms or pathways participate in Charcot-induced bone pathology. CitationNdip et al. (2011) investigated the link between arterial calcification and RANKL/OPG in Charcot patients, but also measured serum levels of OPG and RANKL. They found higher OPG levels in Charcot patients and diabetic controls than in healthy subjects, and higher RANKL levels in Charcot patients than in diabetic controls and healthy subjects. In contrast, our results showed that both OPG and RANKL were higher in Charcot patients and diabetic controls at diagnosis than in healthy controls. In contrast to CitationNdip et al. (2011), who found that RANKL-OPG ratio was higher in Charcot patients and diabetic controls than in healthy subjects, we found similar ratios between all groups at inclusion. There are several possible explanations for these differences. One was the small number of subjects in the study by Ndip et al. (12 Charcot patients, 10 diabetic controls, and 5 healthy subjects). Another was the fact that they analyzed differences between groups on a single occasion, whereas we made repeated measurements of OPG, RANKL, and OPG-RANKL ratio in Charcot patients over a period of 2 years after inclusion. We were thus able to show that the OPG-RANKL ratio in Charcot patients was in balance—not only at inclusion and termination of the study, but throughout the 2-year follow-up—as shown by a stable trajectory over time. In addition to the above, the study by Ndip et al. also lacked documentation of the criteria used to verify Charcot; it had no radiographic examinations of the foot to confirm changes typical of Charcot and no information as to whether the diabetic controls were neuropathic or not, as neuropathy is a prerequisite for Charcot and circulating OPG has been shown to be significantly higher in diabetic patients with neuropathy than in those without (CitationTerekeci et al. 2009). Our results showing higher OPG and RANKL levels in Charcot patients and diabetic controls at inclusion than in healthy subjects, despite the fact that only Charcot patients had bone pathology, could suggest that they are primarily related to the diabetic disease per se rather than to the arthropathy. However, despite the fact that previous studies have shown higher systemic OPG in diabetic patients than in healthy subjects (CitationBjerre 2013) and a correlation between plasma OPG and peripheral neuropathy in diabetic patients (CitationNybo et al. 2010), any link to the diabetic disease as the sole explanation was contradicted by results in Charcot patients showing that levels of both cytokines at 2 years had decreased to levels below those in diabetic controls. A possible reason for the similarly high levels of OPG and RANKL in Charcot patients and diabetic controls despite the fact that only Charcot patients have suffered fractures could be that they share another comorbidity apart from diabetes—i.e. peripheral neuropathy, which is characterized by insensate feet, therefore making victims prone to develop “silent” bone stress injuries (CitationChantelau et al. 2007). This would most probably trigger increased bone remodeling and repair activity, reflected by higher systemic levels of RANKL and OPG, and would suggest that both cytokines are already at a maximum in neuropathic diabetic patients with full weight bearing on their feet, with little ability to increase further in response to additional bone trauma. This could also explain our results showing that OPG and RANKL levels were significantly lower at 2 years in Charcot patients than in diabetic controls, as Charcot patients have had a long period of immobilization without weight bearing, allowing normalization of RANKL and OPG levels, although we can only speculate about the duration of these changes.
The integrity of the skeleton requires a balance between bone formation by osteoblasts and bone degradation by osteoclasts (CitationKohli and Kohli 2011). The OPG-RANKL ratio, which determines the net effect of osteoclast activity, is considered to be more relevant than plasma levels of the individual markers when describing the activity of these cytokines in the bone microenvironment (CitationRogers and Eastell 2005). Our results showing OPG-RANKL ratio to be close to 1 in all 3 groups at inclusion and in the Charcot group throughout the follow-up period of 2 years suggest that despite a higher bone turnover rate in both diabetic groups as suggested by higher RANKL and OPG, the ratio is in balance and does not contribute to net loss of bone or increased bone formation in Charcot patients. This does not, however, rule out the OPG/RANKL pathway playing a critical role at the very early and clinically undetected phase of the disorder, when OPG-RANKL ratio may have been shifted towards net bone loss before being counterbalanced by a compensatory increase in OPG—the soluble endogenous blocker of RANKL.
The Wnt/ß-catenin pathway
There have not been any previous studies investigating the role of Wnt in Charcot, despite accumulating evidence that this is an important bone anabolic pathway (CitationKim et al. 2013), which—through its actions on osteoblasts—can indirectly control osteoclast differentiation and activation, participate in osteoclast recruitment, and initiate bone remodeling (CitationBellido 2014). As there have been studies investigating Wnt in diabetes, we were able to compare the results with our findings. We found higher plasma sclerostin and Dkk-1 levels in diabetic controls at inclusion relative to healthy subjects, which is in line with studies showing higher systemic sclerostin and Dkk-1 levels and reduced ß-catenin levels in diabetes type-2 patients than in healthy subjects (CitationGaudio et al. 2014). These findings link Wnt to augmented fracture risk in diabetic patients, as suggested by a significant correlation between fractures and high systemic sclerostin levels in postmenopausal women (CitationArasu et al. 2012). In contrast, sclerostin and Dkk-1 levels in Charcot patients at inclusion were comparable to the levels in healthy subjects and significantly lower than those in diabetic controls. This inhibition of the antagonists reflecting increased bone anabolic activity in the Wnt/ß-catenin pathway is most likely a natural response to the destructive processes taking place in the Charcot foot, and is supported by experimental studies showing that inhibition of Dkk-1 and sclerostin improve healing of fractured bone (CitationAgholme et al. 2010, Citation2011, Citation2014)
As sclerostin is mainly produced by osteocytes, it has been suggested to play a critical role in the bone anabolic responses to mechanical loading (CitationSapir-Koren and Livshits 2014). Thus, mechanical loading suppresses sclerostin, leading to increased bone mass and strength whereas unloading increases sclerostin and induces bone loss as part of a natural adaptation by the body to skeletal demands. One would therefore expect sclerostin to increase in response to unloading by TCC treatment in the Charcot group—in contrast to our results, which showed a stable and uninterrupted trajectory. However, previous studies showing an association between sclerostin and immobilization in humans did not involve a concomitant fracture or other bone pathology (CitationGaudio et al. 2010), factors that may have changed the priorities of this key Wnt regulator in favor of promoting bone repair activity in Charcot arthropathy patients. This is supported by a recent experimental study showing that unloading of rat hind limb induced a paradoxical downregulation of sclerostin gene expression in cancellous and cortical metaphyseal bone as opposed to diaphyseal cortical bone (CitationMacias et al. 2013), suggesting that the role of sclerostin in unloading is more complex than previously assumed. We were also surprised to find that sclerostin levels at the end of the study remained suppressed in Charcot patients relative to the the levels in the diabetic controls, despite the fact that radiographs showed mineralized bone and no active inflammation on MRI. One plausible explanation to such ongoing Wnt stimulation would be that bone deformities in the wake of Charcot often cause unnatural high pressure on areas of the foot during weight bearing, increasing the need for continuous bone repair and remodeling (CitationGouveri and Papanas 2011). In contrast to sclerostin, off-loading treatment triggered an elevation of Dkk-1 levels in the present study, which persisted until 1 year after inclusion before retreating towards inclusion levels. This is in line with results suggesting a paradoxical upregulation of Dkk-1 in cancellous bone of rat hind leg in response to mechanical unloading (CitationAgholme et al. 2011), and adds to the current results supporting a role for Dkk-1 in mechano-transduction of the skeleton.
A recent study showing lack of correlation between Dkk-1 and ß-catenin—as opposed to a strong correlation between sclerostin and ß-catenin (CitationGaudio et al. 2012)—could suggest that the seemingly paradoxical increase in the Wnt antagonist Dkk-1 during the bone repair phase of acute Charcot is the result of sclerostin being the main modulator of canonical Wnt with Dkk-1 playing a fine-tuning role. 2 recent studies in patients with primary hyperparathyroidism (PHTP) (CitationViapiana et al. 2013) and predialysis chronic kidney disease (CitationThambiah et al. 2012) have shown a similar discrepancy between serum sclerostin and Dkk-1 levels, with sclerostin being lower and Dkk-1 higher than in healthy subjects. The authors suggested that the bone anabolic effect of lower sclerostin may be counterbalanced in PHPT patients by higher Dkk-1 as part of a regulatory feedback mechanism. In a bone fracture study in rodents (CitationLi et al. 2011), the authors were able to show that Dkk-1 was only able to influence bone formation in connection with inflammation and bone trauma, but had no effect on non-fractured bone in adult animals. These findings may shed some light on our results showing that Dkk-1 levels had risen during the most active inflammatory phase of bone repair before retreating, which could suggest that Dkk-1 had outplayed its role once bone healing had begun to abate. An interesting finding made by the authors (CitationLi et al. 2011), albeit surprising, was that overexpression of Dkk-1 after fracture in adult mice increased serum OPG levels and reduced RANKL levels at the early stages of fracture healing with no inhibition of osteoclastogenesis. These results indicate that canonical Wnt, and particularly Dkk-1, may have a role in the bone remodeling phase of fracture healing and may, apart from being a fine-tuning tool of Wnt, also have a role in regulation of the RANKL/OPG pathway. As proposed by CitationDiarra et al. (2007), Dkk-1 may be a master regulator of joint (and bone) remodeling, which shifts its balance from bone resorption when increased to formation of new bone when inhibited, although the nature of its effects seem to vary depending on the cell type and timing of activation in the aftermath of a fracture (CitationKomatsu et al. 2010).
Another possible partner in the complex regulation of canonical Wnt is the agonistic Wnt ligand Wnt-1. Its importance in bone and joint homeostasis was only recently highlighted by publications proposing that it acts as a key regulator of human bone mass despite its relatively low expression in bone (CitationLaine et al. 2013, CitationWilson 2013). The suppression of the Wnt agonist Wnt-1 in Charcot patients relative to diabetic controls at inclusion, despite pronounced bone pathology in the Charcot foot, may appear to be paradoxical when considered independently. However, when viewed in conjunction with other changes in Wnt regulatory proteins, our results reveal that Wnt-1 inhibition is counterbalanced by a concomitant inhibition of the Wnt antagonists sclerostin and Dkk-1. Although we are presently unable to understand the inherent interplay between the regulators of Wnt at the time of Charcot diagnosis, it is reasonable to assume that the balance between the agonists and antagonists is aimed at preserving the damaged foot skeleton. Similar to Dkk-1, off-bearing treatment triggered a 3-fold increase in plasma Wnt-1, peaking at 4 months before retreating. This concomitant increase in Wnt-1 and Dkk-1 levels shortly after introducing TCC might suggest that the 2 opposing mediators of Wnt are part of the Wnt-controlled bone remodeling activity, as shown for the RANKL/OPG pathway. In support of this, Dkk-1 has been implicated in the osteolytic phase of osteoarthritis (CitationDaoussis and Andonopoulos 2011), an action similar to that of RANKL, whereas Wnt-1 has been implicated in the bone anabolic activity of Wnt (CitationLaine et al. 2013, CitationWilson 2013), thus exerting an action similar to that of OPG.
Wif-1 is a new type of secreted antagonist of Wnt signaling, which is structurally unrelated to Dkk-1 or sclerostin and is expressed in the cartilage, bone, and tendons. The antagonistic effect of Wif-1 is exerted by binding to several Wnt ligands, both canonical and non-canonical, thereby interfering with their induction of Wnt signaling—although not all of the regulatory mechanisms of Wif-1 are understood. Wif-1 has been shown to be a negative regulator of osteoblast differentiation and maturation and a promoter of bone erosion by increasing RANKL expression in osteoblasts, and thus the bone-resorbing activity of osteoclasts (CitationStock et al. 2013). Our results show for the first time that plasma Wif-1 levels were higher in Charcot patients and in diabetic controls at inclusion than in healthy subjects and that this paradoxical inhibition of Wnt in Charcot patients remained in place throughout the study. Interestingly, this continuous inhibition of Wnt by elevated Wif-1 was paralleled by equally persistent stimulation of Wnt through inhibition of sclerostin, suggesting that the 2 mediators exert a counterbalancing control of Wnt signaling during the entire course of the disease until recovery.
In summary, our results have shown a high degree of remodeling activity in Charcot patients and diabetic controls at inclusion, as reflected by high plasma OPG and RANKL levels. A decrease in both cytokines in the Charcot group to levels similar to those in healthy subjects at 2 years, and below those in diabetic controls, could be secondary to a protracted off-loading and fracture-stabilizing treatment. The OPG-RANKL ratio being in balance from inclusion and onward suggest that this pathway did not lean in the direction of net bone anabolism or catabolism after diagnosis and treatment, but could have had an important role in bone catabolism during the extended period between trauma and diagnosis. We also provide evidence in support of the Wnt/ß-catenin pathway being involved in bone remodeling following off-loading treatment, and also being a regulator of bone healing in Charcot patients—as suggested by the actions of its endogenous antagonists and agonists. It is tempting to speculate about the possibility of Wnt signaling playing the role previously proposed for RANKL/OPG, although additional studies will be required to corroborate our findings.
Supplementary data
Figures 4, 5C, and 8C are available at Acta’s website (www.actaorthop.org) identification number 7967.
IORT_A_1033606_SM1621.pdf
Download PDF (214.7 KB)AF and JC designed the study, carried out the statistical analyses, and wrote the manuscript. SA, MÅ, and JF treated the patients and collected the clinical data and samples. JC analyzed the blood samples. JG analyzed the radiological data. All the authors contributed to the manuscript.
The study was supported financially by the Västra Götaland Region (VGRFOU, grants 306311, 374761, and 478171).
No competing interests declared.
- Agholme F, Aspenberg P. Wnt signaling and orthopedics, an overview. Acta Orthop 2011; 82 (2): 125–30.
- Agholme F, Li X, Isaksson H, Ke HZ, Aspenberg P. Sclerostin antibody treatment enhances metaphyseal bone healing in rats. J Bone Miner Res 2010; 25 (11): 2412–8.
- Agholme F, Isaksson H, Kuhstoss S, Aspenberg P. The effects of Dickkopf-1 antibody on metaphyseal bone and implant fixation under different loading conditions. Bone 2011a; 48 (5): 988–96.
- Agholme F, Macias B, Hamang M, Lucchesi J, Adrian MD, Kuhstoss S, et al. Efficacy of a sclerostin antibody compared to a low dose of PTH on metaphyseal bone healing. J Orthop Res 2014; 32 (3): 471–6.
- Arasu A, Cawthon PM, Lui LY, Do TP, Arora PS, Cauley JA, et al. Serum sclerostin and risk of hip fracture in older Caucasian women. J Clin Endocrinol Metab 2012; 97 (6): 2027–32.
- Bellido T. Osteocyte-driven bone remodeling. Calcif Tissue Int 2014; 94 (1): 25–34.
- Bjerre M. Osteoprotegerin (OPG) as a biomarker for diabetic cardiovascular complications. Springerplus 2013; 2: 658.
- Chantelau EA, Grutzner G. Is the Eichenholtz classification still valid for the diabetic Charcot foot? Swiss Med Wkly 2014; 144: w13948.
- Chantelau E, Richter A, Ghassem-Zadeh N, Poll LW. “Silent” bone stress injuries in the feet of diabetic patients with polyneuropathy: a report on 12 cases. Arch Orthop Trauma Surg 2007; 127 (3): 171–7.
- Daoussis D, Andonopoulos AP. The emerging role of Dickkopf-1 in bone biology: is it the main switch controlling bone and joint remodeling? Semin Arthritis Rheum 2011; 41 (2): 170–7.
- Diarra D, Stolina M, Polzer K, Zwerina J, Ominsky MS, Dwyer D, et al. Dickkopf-1 is a master regulator of joint remodeling. Nat Med 2007; 13 (2): 156–63.
- Gaudio A, Pennisi P, Bratengeier C, Torrisi V, Lindner B, Mangiafico RA, et al. Increased sclerostin serum levels associated with bone formation and resorption markers in patients with immobilization-induced bone loss. J Clin Endocrinol Metab 2010; 95 (5): 2248–53?.
- Gaudio A, Privitera F, Battaglia K, Torrisi V, Sidoti MH, Pulvirenti I, et al. Sclerostin levels associated with inhibition of the Wnt/beta-catenin signaling and reduced bone turnover in type 2 diabetes mellitus. J Clin Endocrinol Metab 2012; 97 (10): 3744–50.
- Gaudio A, Privitera F, Pulvirenti I, Canzonieri E, Rapisarda R, Fiore CE. The relationship between inhibitors of the Wnt signalling pathway (sclerostin and Dickkopf-1) and carotid intima-media thickness in postmenopausal women with type 2 diabetes mellitus. Diab Vasc Dis Res 2014; 11 (1): 48–52.
- Gouveri E, Papanas N. Charcot osteoarthropathy in diabetes: A brief review with an emphasis on clinical practice. World J Diabetes 2011; 2 (5): 59–65.
- Jeffcoate W. The causes of the Charcot syndrome. Clin Podiatr Med Surg 2008; 25 (1): 29–42, vi.
- Kim JH, Liu X, Wang J, Chen X, Zhang H, Kim SH, et al. Wnt signaling in bone formation and its therapeutic potential for bone diseases. Ther Adv Musculoskelet Dis 2013; 5 (1): 13–31.
- Klejna K, Naumnik B, Gasowska K, Mysliwiec M. OPG/RANK/RANKL signaling system and its significance in nephrology. Folia Histochem Cytobiol 2009; 47 (2): 199–206.
- Kohli SS, Kohli VS. Role of RANKL-RANK/osteoprotegerin molecular complex in bone remodeling and its immunopathologic implications. Indian J Endocrinol Metab 2011; 15 (3): 175–81.
- Komatsu DE, Mary MN, Schroeder RJ, Robling AG, Turner CH, Warden SJ. Modulation of Wnt signaling influences fracture repair. J Orthop Res 2010; 28 (7): 928–36.
- Laine CM, Joeng KS, Campeau PM, Kiviranta R, Tarkkonen K, Grover M, et al. WNT1 mutations in early-onset osteoporosis and osteogenesis imperfecta. N Engl J Med 2013; 368 (19): 1809–16.
- Li X, Grisanti M, Fan W, Asuncion FJ, Tan HL, Dwyer D, et al. Dickkopf-1 regulates bone formation in young growing rodents and upon traumatic injury. J Bone Miner Res 2011; 26 (11): 2610–21.
- Mabilleau G, Petrova NL, Edmonds ME, Sabokbar A. Increased osteoclastic activity in acute Charcot’s osteoarthropathy: the role of receptor activator of nuclear factor-kappaB ligand. Diabetologia 2008; 51 (6): 1035–40.
- Macias BR, Aspenberg P, Agholme F. Paradoxical Sost gene expression response to mechanical unloading in metaphyseal bone. Bone 2013; 53 (2): 515–9.
- Mascarenhas JV, Jude EB. Pathogenesis and medical management of diabetic charcot neuroarthropathy. Med Clin North Am 2013; 97 (5): 857–72.
- Ndip A, Williams A, Jude EB, Serracino-Inglott F, Richardson S, Smyth JV, et al. The RANKL/RANK/OPG signaling pathway mediates medial arterial calcification in diabetic Charcot neuroarthropathy. Diabetes 2011; 60 (8): 2187–96.
- Nybo M, Poulsen MK, Grauslund J, Henriksen JE, Rasmussen LM. Plasma osteoprotegerin concentrations in peripheral sensory neuropathy in Type 1 and Type 2 diabetic patients. Diabet Med 2010; 27 (3): 289–94.
- Papanas N, Maltezos E. Etiology, pathophysiology and classifications of the diabetic Charcot foot. Diabet Foot Ankle 2013; 4.
- Rogers A, Eastell R. Circulating osteoprotegerin and receptor activator for nuclear factor kappaB ligand: clinical utility in metabolic bone disease assessment. J Clin Endocrinol Metab 2005; 90 (11): 6323–31.
- Samuelsson P, Blohme G, Fowelin J, Eriksson JW. A new non-invasive method using pulse oximetry for the assessment of arterial toe pressure. Clin Physiol 1996; 16 (4): 463–7.
- Sapir-Koren R, Livshits G. Osteocyte control of bone remodeling: is sclerostin a key molecular coordinator of the balanced bone resorption-formation cycles? Osteoporos Int 2014; 25(12): 2685–700.
- Sella EJ, Barrette C. Staging of Charcot neuroarthropathy along the medial column of the foot in the diabetic patient. J Foot Ankle Surg 1999; 38 (1): 34–40.
- Stock M, Bohm C, Scholtysek C, Englbrecht M, Furnrohr BG, Klinger P, et al. Wnt inhibitory factor 1 deficiency uncouples cartilage and bone destruction in tumor necrosis factor alpha-mediated experimental arthritis. Arthritis Rheum 2013; 65 (9): 2310–22.
- Terekeci HM, Senol MG, Top C, Sahan B, Celik S, Sayan O, et al. Plasma osteoprotegerin concentrations in type 2 diabetic patients and its association with neuropathy. Exp Clin Endocrinol Diabetes 2009; 117 (3): 119–23.
- Thambiah S, Roplekar R, Manghat P, Fogelman I, Fraser WD, Goldsmith D, et al. Circulating sclerostin and Dickkopf-1 (DKK1) in predialysis chronic kidney disease (CKD): relationship with bone density and arterial stiffness. Calcif Tissue Int 2012; 90 (6): 473–80.
- . Viapiana O, Fracassi E, Troplini S, Idolazzi L, Rossini M, Adami S, et al. Sclerostin and DKK1 in primary hyperparathyroidism. Calcif Tissue Int 2013; 92 (4): 324–9.
- Wilson C. Bone: Wnt--1-a key player in the regulation of human bone mass? Nat Rev Endocrinol 2013; 9 (7): 377.