
Abstract
Background and purpose — During acetabular fracture surgery, the acetabular roof is difficult to visualize with 2-dimensional fluoroscopic views. We assessed whether intraoperative 3-dimensional (3D) imaging can aid the surgeon to achieve better articular reduction and improve implant fixation.
Patients and methods — We operated on 72 acetabular fractures using intraoperative 3D imaging and compared the operative results, duration of surgery, and complications with those for 42 consecutive acetabular fracture operations conducted using conventional fluoroscopic imaging. Postoperative reduction was evaluated on reconstructed coronal and sagittal images of the acetabulum.
Results — The fracture severity and patient characteristics were similar in the 2 groups. In the 3D group, 46 of 72 patients (0.6) had a perfect result after open reduction and internal fixation, and in the control group, 17 of 42 (0.4) had a perfect result. The mean difference in postoperative articular incongruity was 0.5 mm (95% CI: 0.4–0.7). In 29 of 72 operations, the intraoperative 3D scans led to intraoperative correction of the reduction and an improved result. The duration of surgery and infection rate were similar in the 2 groups.
Interpretation — Intraoperative 3D imaging, which is not time-consuming, allowed the surgeon to correct malreductions and screw placement in 29 of 72 operations, leading to better articular reduction and more precise screw placement than in operations where conventional fluoroscopic imaging was used to control the reduction.
The overall incidence of coxarthrosis after acetabular fracture is high and multifactorial. CitationGiannoudis et al. (2005) found that patients with residual articular steps of the acetabular roof smaller than 2 mm had a 13% risk of coxarthrosis and that patients with articular steps larger than 2 mm had a 43% risk. CitationTannast et al. (2012) reported a 27% conversion rate to arthroplasty after acetabular surgery in 816 patients, with a close correlation to the quality of reduction postoperatively. Most surgeons use computed tomography (CT) of the acetabulum to plan their approach and strategy before fracture surgery. For intraoperative decision making and for evaluation of the reduction, 2-dimensional (2D) fluoroscopic imaging is still the standard imaging modality. Several studies have found that intraoperative fluoroscopy is unable to detect clinically significant steps and incongruences of the acetabular roof, and standard postoperative anteroposterior and oblique Judet radiographs cannot detect significant articular steps and screws protruding into the joint (CitationBorrelli et al. 2002, CitationMoed et al. 2003, CitationKendoff et al. 2008).
Several image intensifiers now offer 3-dimensional (3D) imaging solutions that provide the surgeon with reconstructed intraoperative 2-dimensional (2D) images in axial, coronal, and sagittal projections at a resolution and with a quality comparable to CT. Before purchase of the 3D image intensifier, we investigated whether the operative results achieved with the 3D image intensifier were better than the operative results achieved with conventional fluoroscopic control. The primary outcome measure was postoperative articular residual step and secondary outcome measures were infection and duration of operation.
Material and methods
Patients and methods
Copenhagen University Hospital is a referral center for pelvic and acetabular fractures in Copenhagen and eastern Denmark, with a catchment population of 1.7 million. 40 patients per year are referred for operative treatment of acetabular fractures, and during the 4-year study period (from October 2009 through October 2013) all acetabular surgeries were performed by either the first author or the third author, both of whom are experienced pelvic surgeons. In October 2010 an O-arm was purchased, which we used for intraoperative 3D imaging to aid and control fracture reduction and plate fixation for acetabular fracture surgery. In this study, we compared the operative result after open reduction and internal fixation of acetabular fractures before purchase of the O-arm (the control group) with the operative results achieved after purchase of the O-arm (the 3D group). Data were collected retrospectively. From October 2009 through October 2010, we performed open reduction and internal fixation (ORIF) in 42 consecutive patients with an acetabular fracture using conventional intraoperative fluoroscopic control, and these patients formed the control group. From November 2010 through October 2013, we performed ORIF in 72 non-consecutive patients using intraoperative 3D imaging, and these patients formed the 3D group. At this institution the O-arm is also used for spine surgery, so 3D imaging was not available for all the acetabular surgeries performed between November 2010 and October 2013. In that period, 33 non-consecutive patients were operated on using conventional fluoroscopic control, and they were not included in the study.
All patients had a preoperative CT of the pelvis. The control group had a postoperative CT performed and the 3D group had intraoperative 3D imaging performed before wound closure. The acetabular fractures were classified according to the Judet-Letournel classification.
Preoperative displacement was measured on a preoperative CT as the largest step-off of articular fragments in the weight-bearing area on sagittal or coronal views, and the postoperative displacement was measured as the largest articular step-off in the weight-bearing area as described by Borrelli et al. (Citation2002, Citation2005). The quality of reduction was marked as unsatisfactory when articular steps exceeded 3 mm, as imperfect when the steps were 1–2 mm, and as anatomic or perfect when the steps were less than 1 mm. The first and second author conducted all the radiological assessments and discussed the images until agreement was achieved. Comparison of the postoperative acetabular CT in the control group and intraoperative acetabular 3D imaging in the 3D group could not be done blind due to the obvious differences between CT and O-arm images.
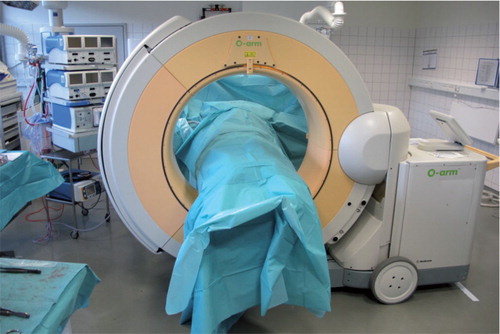
The operative procedure in the control group was performed using a conventional fluoroscope. In the 3D group, we performed the operative procedure aided by a conventional fluoroscope and when the reduction and fixation was satisfactory, we draped the patient with 2 operation cloths, closed the O-arm unsterile around the patient, and performed a scan (). The scan was evaluated by the surgeon and if reduction or fixation was unsatisfactory, we proceeded with re-reduction or re-osteosynthesis followed by re-draping of the patient and re-scanning until the 3D imaging showed a satisfactory result. The degree of radiation exposure of the patient was obtained from the O-arm. Data on duration of surgery and surgical site infection within the first 30 days after surgery were retrieved from the electronic patient record. Patients were referred to their local hospital after surgery, usually after a week when the wound was stable. We may therefore have missed infections that occurred after referral.
Figure 1. The unsterile O-arm closed around the patient for an intraoperative 3D scan. The patient is draped with 2 sterile drapings, which are removed after scanning so that sterility is not jeopardized.
The O-arm
For image acquisition, the beam rotates 360 degrees for 16 s, acquiring 192 images. The beam is pulsed, and the total duration of radiation exposure is 4 s. Images are reconstructed to a CT-like multiplanar cube with side lengths of 15 cm. On the monitor, the images are displayed as reconstructed 2D images in axial, sagittal, and coronal projections. A 3D surface image reconstruction of the pelvis can also be displayed, turned and tilted to gain a spatial perception of the reduction, but for intraoperative use, the 2D images are the most useful. The term “3D imaging” may therefore be confusing to the reader, but it is used in the literature for the imaging modality described here. The surgeon and floor staff are positioned behind a mobile lead screen during scanning, and the degree of scattered radiation is negligible in this position (CitationZhang et al. 2009).
Statistics
In order to balance potential bias due to the non-randomized study design, we calculated propensity scores estimating the average treatment effect. The propensity score model included age, preoperative displacement, and fracture type as known potential confounders. The propensity score was included in all statistical models that analyzed the primary and secondary endpoints by inverse probability weighting (CitationHeinze and Juni 2011). To analyze the primary endpoint postoperative reduction (perfect reduction, imperfect reduction, poor reduction), we converted the categorical values to a metric scale using a resampling approach. Each category of postoperative articular incongruity corresponds to a certain range of incongruity measured in mm as follows: anatomic/perfect: 0–0.99 mm; imperfect: 1.00–3.00 mm; unsatisfactory/poor: 3.01–5.00 mm. For each patient, we randomly drew a value for postoperative articular incongruity in mm from the range of the corresponding category of postoperative articular incongruity, assuming a uniform distribution. For example, for a patient with perfect articular reduction, a value between 0 and 1 mm was drawn. This simulated postoperative articular incongruity was used as primary endpoint. In order to obtain robust results for this simulated endpoint, this resampling procedure was repeated 999 times, resulting in 999 simulated datasets. For each simulated dataset, we performed a 1-way ANOVA, applying propensity score inverse probability weighting of receiving treatment (CitationHeinze and Juni 2011) to estimate the difference in the primary endpoint between the intervention group and the control group (with a negative difference indicating that the primary endpoint is smaller in the intervention group). We calculated the overall mean with 95% confidence interval (CI) of the 999 estimated differences in primary endpoint. Superiority of the 3D imaging method was declared if the upper limit of the CI did not exceed zero, thus rejecting the null hypothesis of no difference. Duration of surgery was log-transformed and analyzed using a 1-way ANOVA, applying propensity score inverse probability weighting. Infection rate was analyzed using propensity score inverse probability weighted logistic regression.
Demographic and baseline characteristics were compared using the Mann-Whitney test for continuous variables and Fisher’s exact test for categorical variables. The complete statistical analysis report is included in “Supplementary data”.
Results
There was no statistically significant difference in fracture distribution (p = 0.4), and half of the fractures were associated in both groups (). The mean preoperative displacement was 9.0 (SD 5.5) mm in the 3D group and 4.8 (SD 4.2) mm in the control group (p = 0.003). High-energy accidents accounted for 25 of 72 fractures in the 3D group and 16 of 42 fractures in the control group. In both groups, the mean age was 58 years. The female-to-male ratio was 23:49 in the 3D group and 14:28 in the control group (p = 1.0).
Table 1. Distribution of fractures according to Judet-Letournel, and the operative result achieved for the group operated on with intraoperative 3D control (3D) and the group operated on with intraoperative fluoroscopic control alone (Control)
In the 3D group, we performed 1 intraoperative 3D scan in 37 patients, 2 scans in 29 patients, and 3 scans in 6 patients. The reasons for multiple scans were a change of screw or plate positioning in 16 patients, re-reduction of the fracture in 13 patients, and change of operative strategy in 2 patients. There were no reoperations due to misplaced screws or unsatisfactory reduction. In the control group, the postoperative CT showed intra-articular screw placement in 1 patient and a screw that was too long in 1 patient. Reoperation with screw removal was required in both cases.
The reduction of the acetabular roof was perfect in 46 patients (0.6) in the 3D group, imperfect in 18 patients (0.3), and poor in 8 patients (0.1). In the control group, these values were 17 (0.4), 12 (0.3), and 13 (0.3), respectively.
We observed a mean simulated postoperative articular incongruity of 1.28 mm for the 3D group and 1.83 mm for the control group. The corresponding mean difference in simulated postoperative articular incongruity was statistically significant: −0.54 (95% CI: −0.72 to −0.37) mm.
In the 3D group, there was 1 early superficial surgical site infection and there were 3 deep incisional infections requiring revision surgery, provisional vacuum sealing, and secondary suture. In the control group, 3 patients had superficial infections and 1 had a deep infection (p = 0.7). None of the infections proceeded to chronic osteomyelitis.
The average operation time was 167 (SD 79) min in the 3D group and 168 (SD 89) min in the control group. The corresponding weighted means were 166 min for the intervention group and 162 min for the control group.
The dose index by volume for 1 pelvic 3D scan in this study was 14.1 mGy, and the scan length was 16 cm, which resulted in a dose length product per scan of 225 mGycm. The average number of scans was 1.6 and the average absorbed dose per patient was 360 mGycm.
Discussion
Traditionally, postoperative articular reduction after acetabular surgery has been evaluated on conventional radiographs, which is less sensitive to the detection of articular steps and gaps than CT. CitationBorrelli et al. (2002) found using CT that 4-mm steps of the acetabular roof could not be detected fluoroscopically, and CitationMoed et al. (2003) found that 10-mm residual gaps after posterior wall fracture surgery could not be seen on radiographs but were detectable with postoperative CT. The strong correlation between the quality of articular reduction of the weight-bearing dome and the clinical outcome after 1–2 years (CitationGiannoudis et al. 2005, CitationTannast et al. 2012) suggests that the residual steps and gaps that remain undetected with the fluoroscope—but are identifiable with 3D imaging—have clinical relevance and should be corrected.
In the present study, the intraoperative 3D scan helped the surgeon to improve the reduction or the implant positioning in 29 of 72 operations. Similar results were found by CitationKendoff et al. (2008). 248 patients with intra-articular fractures of the acetabulum, knee, and ankle had an intraoperative 3D scan performed when the surgeon found the operative result to be satisfactory after fluoroscopic control. The evaluation of the 3D scan resulted in 19% operative revisions, with improvement of fracture reduction in 8% and implant repositioning in 11%.
We achieved 46 anatomic reductions in 72 operations (0.6), which is good. CitationBriffa et al. (2011) reported on 257 acetabular surgeries with radiographic evaluation in 161 fractures. Of these, 73% were anatomical, 12% were imperfect, and 14% were poor. CitationTannast et al. (2012) operated on 1,326 acetabular fractures and reported on 816 acetabular fractures with radiographic evaluation. Of these, 75% of reductions were anatomic, 18% were imperfect, and 4% were poor. Our results cannot be directly compared with historic results because previous reports are based on radiographic evaluation of the acetabular roof, which underestimates the true articular incongruence (CitationBorrelli et al. 2002, CitationMoed et al. 2003, CitationKendoff et al. 2008, CitationHufner et al. 2009).
Our results enable comparison of postoperative results before and after purchase of the O-arm. 42 patients out of 72 (0.6) had perfect reduction in the 3D group and 17 of 42 (0.4) had perfect reduction in the control group. The weighted difference in simulated postoperative articular residual step was 0.54 mm. We included in the propensity score calculation the important confounders preoperative displacement, age, and fracture type. We evaluated the baseline data in the 2 groups and noted a larger degree of preoperative dislocation of the acetabular roof in the 3D group, and similar distribution between the 2 groups with respect to fracture type, age, and sex. The baseline parameters were comparable to those in the other acetabular fracture studies reported in this manuscript (CitationBriffa et al. 2011, CitationOberst et al. 2012, CitationTannast et al. 2012, CitationShazar et al. 2014). Propensity score methods are an option to reduce potential bias between trial arms in non-randomized trials. However, we are aware of the fact that there might still be bias due to unobserved confounders. One limitation of the propensity score method was that the primary outcome (residual step) was recorded on an ordinal scale (categories) and not on a metric scale (mm). The categories therefore contain much coarser information compared to precise measures. We tried to antagonize this by “back-transforming” the ordinal variable to the metric scale by the simulation procedure described. The underlying assumption for the simulation procedure is the uniform distribution of the outcome “residual step” within the categories “anatomic”, “imperfect”, and “poor”. We have no data to support this assumption; the appropriateness of the underlying assumptions is based on practical/medical experience, and the result obtained must be interpreted with these limitations in mind.
Estimation of the postoperative articular incongruence was conducted on images from the O-arm in the 3D group and on postoperative CT in the control group; the evaluation could therefore not be done blind, which may have added observer bias to the result. The O-arm was used whenever it was available, and there was no patient selection for the operations where intraoperative 3D imaging was used.
The articular incongruence was measured as step-offs in the weight-bearing area. Borrelli et al. (Citation2002, Citation2005) found intra- and interobserver agreement above 95% when conducting these measurements and a close relation between the gap size and the step size of the articular roof. We did not conduct any variability measurements.
We had no reoperations due to intra-articular screws or poor reductions in the 3D group, whereas 2 patients in the control group underwent reoperations due to misplacement of screws detected on the postoperative CT. We have not found any reports on postoperative revision rates due to intra-articular screws or clinically significant articular steps after acetabular surgery. Based on the intraoperative revision rate of 19% in the clinical study of 248 patients with intra-articular fractures by CitationKendoff et al. (2008), and the number of reoperations that is avoided with the use of intraoperative 3D imaging, the purchase of an intraoperative 3D imaging device is cost-effective when it is used in more than 240 operations a year (CitationHufner et al. 2009).
Introduction of a new procedure in the operating room should improve the operative result without jeopardizing patient safety. The duration of the operations aided by 3D imaging was 167 min—not longer than the operations before introduction of the O-arm and shorter than the duration of 264 min reported by CitationOberst et al. (2012) and the 242 min reported by CitationShazar et al. (2014). The surgical site infection rates was 4 out of 42 in the control group and 4 out of 72 in the 3D group, which is similar to the infection rate of 18/161 (11%) reported by CitationBriffa et al. (2011) and 17/122 (7%) reported by CitationShazar et al. (2014). Late-occurring infections may have escaped our notice because patients were transferred to their local hospital, usually 1 week postoperatively.
We found that the intraoperative 3D scan proved particularly useful in the following situations.
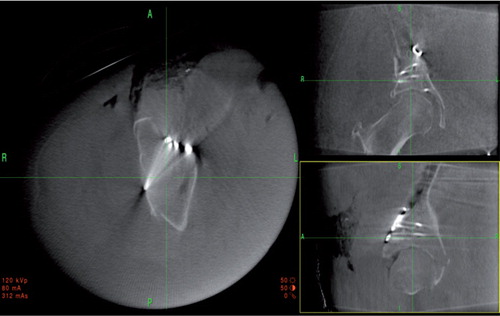
1. A posterior column lag screw from the pelvic brim parallel to the quadrilateral plate and engaging the posterior column is useful in transverse and posterior column fractures. The screw runs close to or across the cotyloid fossa and may penetrate the joint. Fluoroscopic evaluation is difficult when axial or lateral traction to the femoral head or blood distends the joint. 3D imaging ensures the extra-articular placement and correct positioning with bicortical purchase (). 2. Small posterior wall fragments in posterior wall fractures that are reduced and stabilized with plates and screws may move during instrumentation, causing articular incongruences despite initially perfect reduction. Intraoperative 3D imaging allows the surgeon to tilt and rotate the reconstructed 2D images so that the joint and screw paths are visualized, and reduction and extra-articular screw placement can then be confirmed (). 3. In 2-column fractures, fixation of the supra-acetabular fracture that is seen as a spur on the radiographs can be performed indirectly with 1 or 2 screws inserted medially through the iliac wing across the fracture and into the supra-acetabular region. With 3D imaging, the correct screw path is easy to plan and the reduction and fixation can be controlled ( and ).
Figure 2. The intraoperative 2D reconstructed views of a posterior column lag screw visualized in a 2-column fracture. The axial reconstruction is shown to the left, coronal view is shown to the upper right, and sagittal view is shown to the lower right. The surgeon can orientate the planes parallel to the screw, enabling a precise evaluation of the screw path and confirming the extra-articular position in the cytoloid fossa.
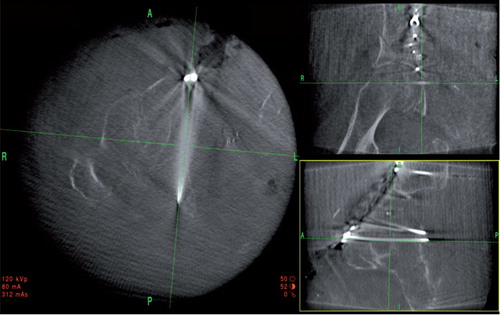
Figure 3. Intraoperative 2D reconstructions of a reduced and stabilized posterior wall fracture. Axial view to the left, coronal view to the upper right, and sagittal view to the lower right. This clearly shows good reduction and extra-articular screw placement.
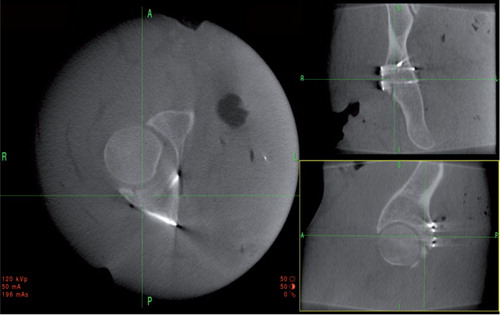
Figure 4. Intraoperative 2D reconstructed views of the unreduced fragment in the supra-acetabular region of a 2-column fracture. Axial view to the left, coronal view to the upper right, and sagittal view to the lower right. The fracture can be reduced with a ball spike through a stab incision laterally and the screw paths for the screws that indirectly fixate the fracture can be planned. The result achieved is shown in .
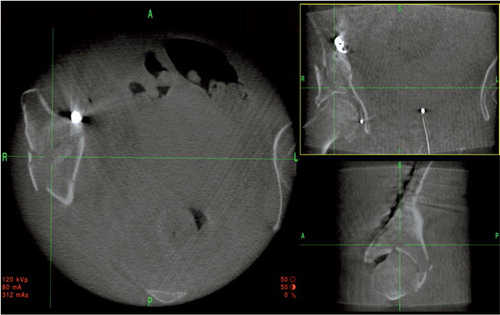
Figure 5. 2D reconstructed images of the 2-column fracture seen in after reduction and indirect screw fixation.
The average number of scans with the O-arm was 1.6, and the average absorbed dose per patient was 360 mGycm, which is 80% of that in a conventional pelvic CT with a 64-slice CT scanner. 3 meters from the center of the gantry, behind the console, the scattered radiation is negligible, and the surgeon and staff positioned behind the lead screen receive no radiation (CitationZhang et al. 2009). CitationPetersen et al. (2012) have shown that the manufacturer’s settings for radiation intensity of the O-arm can be reduced by 89% and still deliver reliable images when used for pedicle instrumentation in children. A similar reduction in radiation could probably be achieved in intraoperative control of the acetabulum, but this has not been tested yet. The O-arm was used for all types of acetabular fractures at our institution when it was available, and we found that simple fractures that appeared perfectly reduced under the fluoroscope could also have intra-articular incongruences or screw misplacements requiring intraoperative revision. Isolation of the fractures where postoperative 3D control is not needed is therefore difficult, and at our institution we recommend that all acetabular fractures have intraoperative 3D imaging control or receive a postoperative CT.
In conclusion, we found that intraoperative 3D imaging of acetabular fractures was superior to fluoroscopic 2D imaging regarding reduction, with similar duration of surgery and similar surgical site infection rates.
IORT_A_1055690_SM2340.pdf
Download PDF (155.2 KB)HE operated on the patients, had the idea of the manuscript, collected the data, and reviewed radiographs and computed tomographies. DL collected the data and reviewed radiographs and computed tomographies. ET operated on the patients. All 3 authors wrote and revised the manuscript.
The study did not receive any financial support. The statistical analyses were conducted by Deborah Vogt, statistician, and Lisa Herzog of the Clinical Trial Unit, University Hospital, Basel, Switzerland.
No competing interests declared.
- Borrelli JJr, Goldfarb C, Catalano L, Evanoff BA. Assessment of articular fragment displacement in acetabular fractures: a comparison of computerized tomography and plain radiographs. J Orthop Trauma 2002; 16(7): 449-456; discussion 456-447.
- Borrelli JJr, Ricci WM, Steger-May K, Totty WG, Goldfarb C. Postoperative radiographic assessment of acetabular fractures: a comparison of plain radiographs and CT scans. J Orthop Trauma 2005; 19(5): 299-304.
- Briffa N, Pearce R, Hill AM, Bircher M. Outcomes of acetabular fracture fixation with ten years follow-up. J Bone Joint Surg (Br) 2011; 93(2): 229-236.
- Giannoudis PV, Grotz MR, Papakostidis C, Dinopoulos H. Operative treatment of displaced fractures of the acetabulum. A meta-analysis. J Bone Joint Surg (Br) 2005; 87(1): 2-9.
- Heinze G, Juni P. An overview of the objectives of and the approaches to propensity score analyses. Eur Heart J 2011; 32(14): 1704-1708.
- Hufner T, Stubig T, Citak M, Gosling T, Krettek C, Kendoff D. Utility of intraoperative three-dimensional imaging at the hip and knee joints with and without navigation. J Bone Joint Surg (Am) 2009; 91 Suppl 1: 33-42.
- Kendoff D, Gardner MJ, Citak M, Kfuri MJr, Thumes B, Krettek C, Hufner T. Value of 3D fluoroscopic imaging of acetabular fractures comparison to 2D fluoroscopy and CT imaging. Arch Orthop Trauma Surg 2008. 128(6): 599-605.
- Moed BR, Carr SE, Gruson KI, Watson JT, Craig JG. Computed tomographic assessment of fractures of the posterior wall of the acetabulum after operative treatment. J Bone Joint Surg (Am) 2003; 85-A(3): 512-522.
- Oberst M, Hauschild O, Konstantinidis L, Suedkamp NP, Schmal H. Effects of three-dimensional navigation on intraoperative management and early postoperative outcome after open reduction and internal fixation of displaced acetabular fractures. J Trauma Acute Care Surg 2012; 73(4): 950-956.
- Petersen AG, Eiskjaer S, Kaspersen J. Dose optimisation for intraoperative cone-beam flat-detector CT in paediatric spinal surgery. Pediatr Radiol 2012; 42(8): 965-973.
- Shazar N, Eshed I, Ackshota N, Hershkovich O, Khazanov A, Herman A. Comparison of acetabular fracture reduction quality by the ilioinguinal or the anterior intrapelvic (modified Rives-Stoppa) surgical approaches. J Orthop Trauma 2014; 28(6): 313-319.
- Tannast M, Najibi S, Matta JM. Two to twenty-year survivorship of the hip in 810 patients with operatively treated acetabular fractures. J Bone Joint Surg (Am) 2012; 94(17): 1559-1567.
- Zhang J, Weir V, Fajardo L, Lin J, Hsiung H, Ritenour ER. Dosimetric characterization of a cone-beam O-arm imaging system. J Xray Sci Technol 2009; 17(4): 305-317.
Supplementary article data
The complete statistical report is available at Acta’s website (www.actaorthop.org), identification number 8209.