Abstract
Understanding the identity and changes of organisms in the urogenital and other microbiomes of the human body may be key to discovering causes and new treatments of many ailments, such as vaginosis. High-throughput sequencing technologies have recently enabled discovery of the great diversity of the human microbiome. The cost per base of many of these sequencing platforms remains high (thousands of dollars per sample); however, the Illumina Genome Analyzer (IGA) is estimated to have a cost per base less than one-fifth of its nearest competitor. The main disadvantage of the IGA for sequencing PCR-amplified 16S rRNA genes is that the maximum read-length of the IGA is only 100 bases; whereas, at least 300 bases are needed to obtain phylogenetically informative data down to the genus and species level. In this paper we describe and conduct a pilot test of a multiplex sequencing strategy suitable for achieving total reads of > 300 bases per extracted DNA molecule on the IGA. Results show that all proposed primers produce products of the expected size and that correct sequences can be obtained, with all proposed forward primers. Various bioinformatic optimization of the Illumina Bustard analysis pipeline proved necessary to extract the correct sequence from IGA image data, and these modifications of the data files indicate that further optimization of the analysis pipeline may improve the quality rankings of the data and enable more sequence to be correctly analyzed. The successful application of this method could result in an unprecedentedly deep description (800,000 taxonomic identifications per sample) of the urogenital and other microbiomes in a large number of samples at a reasonable cost per sample.
Introduction
Diverse populations of microorganisms are persistently associated with the non-sterile parts of the human body such as the mouth, lungs, gut, skin, and urogenital tract. Known as the ‘human microbiome,’ these microorganisms are thought to have important roles in health and be a potential source of pathogens in disease. For example, the etiology of some diseases of the urogenital tract, such as vaginosis, is thought to have complex causes associated with changes in the diverse bacterial community present in the tract [Oakley et al. Citation2008]. In addition, urogenital infections that are attributed to specific species of bacteria, such as puerperal sepsis in post partum women caused by Group A Streptococcus [Chuang et al. Citation2002], may be enabled by the complex bacterial communities from which they arise. However, only a fraction of the bacterial species that are closely associated with humans in the urogenital tract, gut, and other non-sterile parts of the human body are estimated to have been cultured [Oakley et al. Citation2008; Zoetendal et al. Citation2009]. To overcome this paucity of culture-based knowledge of the human microbiome, culture-free molecular methods have been used to reveal many uncultured and sometimes unknown microbes. Epidemiological studies that include identification of all members of the urogenital microbiome may be necessary to understand the causes and to guide prophylaxis and treatment of these and other serious infections.
Molecular methods have recently used population-based 16S rRNA gene sequencing methods to characterize the number and types of bacterial species associated with the urogenital tract and other parts of the human microbiome. With 300 bp of 16S rRNA gene sequence, various ribosomal sequence classifiers are generally able to correctly assign a sequence with high confidence to at least the genus level and sometimes to the species level [Wang et al. Citation2007]. In theory, such a metagenomic approach can be used to describe the sampled community of microorganisms. In practice, the results that have been reported have been limited by cost and the unexpected diversity, which indicates that hundreds of thousands of 16S rRNA genes must be sequenced to begin to get close to saturating the diversity that is present in these microbiomes [Petrosino et al. Citation2009]. An early example for the gastrointestinal tract utilized Sanger sequencing to provide sequences of approximately 15,000 16S rRNA genes, an approach that identified approximately 400 ‘bacterial phylotypes’ but was so insensitive due to the small (in retrospect) number of sequence reads that not even the well-known enteric bacterium E. coli was detected in the samples [Eckburg et al. Citation2005]. Similarly, a study of the urogenital tract using Sanger sequencing, published in 2008, reported a total of 969 sequences for 34 subjects, an average of less than 30 sequences per subject [Oakley et al. Citation2008]. The results clearly reveal that much diversity in the urogenital microbiome remains unexplored, and that larger subject pools are needed to draw statistically valid epidemiological conclusions.
New sequencing platforms have recently become available, including the Roche 454, Illumina Genome Analyzer (IGA), and ABI Solid [Perkel Citation2009], and others are in development [Metzker Citation2010] that enable much larger numbers of sequence reads to be obtained at much lower cost per base. Sequencing of DNA or amplified PCR products on the Roche 454 ‘next generation’ sequencer has been reported (e.g., [Forney et al. Citation2010; Turnbaugh et al. Citation2009]; however, we describe here a strategy to develop the IGA sequencing platform as the best method for analyzing the urogenital microbiome at reasonable cost. While 454 sequencing currently has the advantage of longer reads (> 400 bases per read), it also has disadvantages. A recent estimate is that sequencing costs are ∼$400/Mb by Sanger; ∼$10/Mb by 454; and ∼$2/Mb by IGA [Chen 2008]. The 454 technology has also been reported to have problems reading homopolymer repeats accurately [Metzker Citation2010]. A recent application of the IGA to bacterial microbiomes utilized sequence reads of 75 - 100 bases and was able to correctly assign sequences to order-level taxa, but due to the short read lengths was generally unable to assign sequences correctly to genus-level taxa [Caporaso et al. Citation2010]. The significance of the present study is that the sequencing strategy described here will overcome the main disadvantage of the IGA, its relatively short read length of only 75 - 100 bases per read [Perkel Citation2009]. By focusing on specific features of 16S rRNA sequences to obtain longer, accurate reads, the lower cost and higher data density of the IGA will enable large epidemiological studies of microbiomes to be accomplished at reasonable cost.
Sequencing Strategy for the Illumina Genome Analyzer
The taxonomic identification of bacteria usually requires at least 300 bp of rRNA gene sequence. Therefore, we propose a technical strategy that enables the IGA to sequence contiguous phylogenetically useful rRNA sequences directly. As described here, our ‘16S center primer method’ enables the sequencing of at least 350 bp, comprising at least two phylogenetically useful variable regions. This approach is easily extended to other variable regions of the 16S rRNA gene.
The standard IGA sequencing method (illustrated by [Metzker Citation2010]) requires Illumina-designed adapter sequences to be ligated to the ends of the DNA fragments to be sequenced. The adapters have 3 regions: 1) adapter, for ligation to the DNA fragment, 2) read primer sequences, complementary to read primers in later steps, and 3) anchors, complementary to oligonucleotides (call them X and Y) immobilized on the IGA sequencer ‘tiles.’ There are two different read primer and anchor sequences. Following ligation of the adapter sequences to the DNA, the resultant DNA is attached to the flow cell surface by means of their anchor sequences that are complementary to DNA already attached to the flow cell tiles. Attached DNA molecules can form bridges between the two different anchor sequences and closely situated complementary oligonucleotide sequences (X and Y) on the flow cell tiles. The bound flow cell oligonucleotides are therefore used as primers to synthesize DNA across the bridge, a process that is repeated many times, resulting in a cluster of anchored copies of the DNA sequence insert. The sequence of the DNA attached to the flow cell in each cluster is then determined by ‘reversible fluorescent terminator chemistry’ in which a complement to the primer region sequence of each anchored DNA is used as a primer to initiate sequencing. Fluorescent bases (A*,G*,C*,T*) that are modified to allow only a single base to be added, are applied simultaneously and add a single complementary base to all members of each cluster. The fluorescence of all clusters is imaged, the fluorescent label and its chemical block to extension are removed (but not the nucleotide itself), the DNA is extended another base by the same method and imaged again. This process is repeated many times to obtain sequence data simultaneously from hundreds of millions of clusters per flow cell. Current technology enables 75 to 100 accurate cycle reads per initiating primer. The technology also enables paired end reads in which the clustered DNA is ‘flipped over’ and the same piece of DNA is sequenced from the other end, giving a total read (usually separated by a non-sequenced region) of ∼200 bases. The technology also allows for multiplex indexing, in which index sequences, also known as ‘bar-codes,’ are included between the anchor adapter and the read primer sequences and can be read using a primer that initiates sequencing in the direction of the index (the opposite direction of the unknown DNA sequence). Illumina has 12 standard 6-base index sequences, designed so that an error in one base can still be interpreted correctly. Another 6-base system with internal checks has been used in IGA sequencing, comprising 48 of the possible 4,096 6-base index sequences [Craig et al. Citation2008].
It should be noted that sequencing of the DNA insert and index sequences are initiated by primers that are ‘merely’ complementary to a sequence in the anchored DNA. No special chemistry or sequence for these primers is needed other than sufficient length and complexity to assure strong and specific binding. Thus, we have designed a sequencing strategy based on using the naturally conserved regions of ribosomal rRNA genes for the read primer sequences in Illumina sequencing runs.
To understand this sequencing strategy, we first consider the structure of the bacterial 16S rRNA gene sequence. rRNA sequences are highly conserved, but some regions are more highly conserved than others. A, summarizes the 9 variable regions in 16S rRNA and the most highly conserved sequence regions for which ‘universal’ primers have been designed [Baker et al. Citation2003]. Although no primer set works with every rRNA sequence, many are excellent (see ++ + indicated in in [Baker et al. Citation2003]). Bases 331 to 810 (B) includes 3 conserved regions (e.g., 11 bases of C4 are invariant in bacteria; C3 is highly conserved for 19 bases). The strategy proposed and tested here focuses on the C2 to C4 region illustrated in B; however, the approach that we describe here can be applied to any sequence with sufficiently conserved primer sites (thus, data can also be obtained with primers to other rRNA regions or other genes).
Figure 1. Location of variable and conserved regions in a typical bacterial 16S rRNA. A) location of variable (Vi, green) and conserved (Ci, pink) regions in a typical bacterial 16S rRNA gene (complete gene). The black bases in C4 are completely invariant in all bacteria. B) Specific example of the C2 to C4 region in Escherichia coli, with a similar color code to A. The C2, C3, and C4 conserved regions are the targets of universal bacterial ribosomal DNA primers.
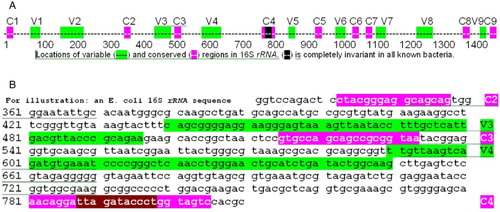
Table 1. Names and sequences of primers used in these experiments.
The initial step in the proposed strategy is to amplify rRNA gene DNA with primers that include the anchor, index, and read primer sequences that can be anchored to the standard Illumina flow cell. This is accomplished (and described in more detail in the Methods section) with primers that have forward and reverse sequences for C2 and C4, respectively, based on published universal primer sequences [Baker et al. Citation2003]. These DNA sequences also function as read primer sequences when anchored on the Illumina flow cell. An example is primer C2X, illustrated in A, which will anneal to conserved ribosomal region C2 and can be anchored to flow cell sequence X. Similarly, the reverse primer has anchor sequences complementary to oligo Y (immobilized on the flow cell), an index sequence, and the reverse primer sequence, complementary to conserved region C4. The structure of a resultant amplified DNA using these primers is illustrated in B.
Figure 2. Example of the primer structure. A) Example of structure of primer containing anchor sequence (blue), spacer, index sequence (green), and 16S specific primer (red). Specifically, this is the sequence of primer C2X, which has the C2 forward sequence, an index, and an anchor sequence for anchor X. B) Cartoon of resultant DNA amplified with primers C2X and C4Y. The conserved regions of this amplicon (C2, C3, and C4) are shown in red. Arrows under the cartoon indicate the location and direction that specific primers would initiate sequencing. C) Cartoon illustrates direction of sequencing with 3 primers, for DNA anchored with Y adapter.

After hybridizing and chemically attaching the amplified DNA to the Illumina flow plate, clusters are formed with Illumina's standard bridge amplification technology followed by linearizing the DNA in each cluster, so that one end is anchored and the other is available for hybridizing sequencing primers to one or the other conserved regions of the anchored DNA. The process is illustrated in C. For example, single stranded DNA anchored to the flow cell by anchor Y at its 5' end has the complementary sequence to C2 at its 3' end. Sequencing can therefore be initiated with a C2 forward primer, by the usual addition and reading, a cycle at a time, of reversibly fluorescently labeled nucleotides to the 3'-end of the nascent growing DNA (i.e., the usual IGA sequencing procedure, but initiated by our own primers). After 75 - 100 cycles of sequencing, single stranded anchored DNA can then be regenerated and sequenced again, but this time using a different forward primer, for example, the C3 conserved region (C3F: 5′- GTGCCAGCMGCCGCGGTAA-3′) [Baker et al. Citation2003] and again doing 75 - 100 cycles of sequencing. To detect the index sequence, a forward primer for region C4 is sequenced for 6 cycles. Altogether, this yields 150 - 200 bases of variable regions of the 16S ribosomal gene.
To achieve > 300 bases of sequences, IGA procedures for paired-end sequencing are then followed: linearized single-strand anchored DNA is regenerated, bridged, and synthesized from the anchor X sequence of the flow cell; the attachment of anchor Y to the flow cell is cut; and then the single stranded DNA, now anchored by the X sequence is regenerated, ready for sequencing with reverse primers in the opposite direction. Sequencing is then done with reverse primers to region C4 (75+ cycles) and region C3 (75+ cycles). The described strategy should yield 300 - 400 bp of sequence: C2F: 358 – 432 + ; C3R: 439 – 514 or more; C3F: 534 – 608 + ; and C4R: 706 – 780 or more, covering most of variable regions V3 and V4, as well as adjacent to V3 and V4, which has species specific changes as well [Wang et al. Citation2007]. Since all 300 - 400 bp in a cluster are from the same piece of DNA, there is ‘no assembly required’ to put the > 300 bp in the proper order compared to reference sequences. With reads of up to 100 cycles, the C2F- and C3R-primed sequences will overlap, providing bidirectional sequencing for quality-checking.
Pilot Test of the Sequencing Strategy
In the present paper, we have tested three aspects of the proposed sequencing strategy: 1) whether the complex primers needed for generating DNA amplicons to be anchored to the flow cell work, 2) whether sequencing initiated by the six different sequencing primers needed for the strategy produces useful reversible terminator fluorescent signal using the standard sequencing conditions for the Illumina flow cell, and 3) what bioinformatic methods are needed to accurately extract the sequence information from the resultant cluster image data. In order to know whether accurate sequence data were being obtained, experiments utilized DNA from several species of bacteria for which the 16S rRNA gene sequences were known with certainty. To conserve resources, this pilot test strategy was designed to obtain this information with a minimal number of total cycles, obtaining only 5 - 10 cycles for each primer (total cycles for all tests, 35 cycles), sufficient to ascertain that the expected species specific sequences were obtained.
Methods
Purified genomic DNA was obtained commercially for Escherichia coli (ATCC® cat. 10798D) and Desulfovibrio vulgaris(ATCC® cat. 29579D). Streptococcus pyogenes genomic DNA was obtained for strain M14 HSC5, from the laboratory of Melody Neely (Wayne State University). An ∼95% complete genomic sequence for this strain of S. pyogenes obtained by pyrosequencing (Ram, unpublished data) showed that the 16S rRNA gene sequences are identical to other strains of S. pyogenes. Several other DNA samples (Bacteroides fragilis and several extracts of fecal DNA) were also used in this study. DNA samples for each were amplified using the primers listed in , with the following cycle conditions: 94°C for 3 min for initial denaturation, 35 cycles of amplification (30 s 94°C, 45 s 60°C primer annealing, 1 min 72°C elongation), and 7 min final 72°C elongation, while monitoring the reaction with SYBR Green on a BioRad iCycler. Size and purity of products were assessed by agarose gel electrophoresis and, for samples selected for Illumina sequencing (), on an Agilent Bioanalyzer, followed by isolation of the major amplification product. The PCR products were purified on Qiagen MinElute columns according to the kit protocol, eluted in 20µL elution buffer, and amounts measured by absorbance using a Nanodrop spectrophotometer.
Table 2. Expected sequences in cycles 1 – 10 of samples selected for sequencing.
These purified amplified samples, along with Illumina's phiX control DNA, were anchored and clustered to the Illumina flow cell in the lane positions listed in , using the Illumina Cluster Station according to the manufacturer's instructions. The Illumina methodology allows a different primer and DNA sample to be put into each lane on the Cluster Station; these are also listed in . Following clustering and primer hybridization on the Cluster Station, the flow cell was transferred to the Genome Analyzer and sequencing was initiated for 10 cycles. The read 1 product was then removed and the next primer to be tested was annealed to the anchored DNA, according to the manufacturer's instructions. Unlike the first read, for which primers are applied in individual lanes on the Cluster Station, subsequent primers flow onto the entire flow cell and cannot be individually targeted to different lanes. The order and identity of primers were as follows: cycles 1 – 10, see ; 11 – 16, C4F and C2R; 17 – 21, C3R; 22 – 26, C2F; and 27 – 35, C2F and C4R.
Resultant image data were then processed using the IGA Pipeline Software to identify cluster positions and color intensities (Firecrest process) and then Bustard for basecalling from the IGA image data. As will be briefly discussed in Results, initial analysis with the standard Illumina software parameters applied directly to all 35 cycles yielded only fragmentary results, indicating a need for modifications of the analysis pipeline to take into account which lanes and tiles were expected to have sufficient sequence variability for contrasting fluorescence colors and intensities to be recognized. Ultimately, modifications were made (see Supplemental File 1 available in electronic copy) so that Bustard would employ a matrix deconvolution file for basecalling based only on parameters derived from the control phiX library run in lane one of the 8-lane flow cell. Also, since the phiX control was able to generate sequence for only the first 10 cycles (its primers were replaced by the 16S targeted primers in subsequent read cycles), the data collected in the first 10 cycles for phiX were used as ‘pseudo-controls’ for subsequent cycles 11 – 20, 21 – 30, and 31- 35, for this matrix deconvolution process. The IGA Bustard process also generated quality scores to identify low quality clusters or to identify low quality basecalls for particular read cycles. The result for each cluster was a potentially identified base for each cycle, along with its quality score. The quality scores are identified by letters that can be converted to a standard PHRED score, according to the following formula: ASCII code of the indicated character - 64. A typical high quality score was ‘b’ (ASCII code = 98) equivalent to a PHRED score of 34; a satisfactory quality score might be ‘_’ (ASCII code = 95) equivalent to PHRED = 31; whereas a quality score of ‘B’ (ASCII code = 66) was the lowest that might be given by the software pipeline (PHRED = 2). PHRED scores > 20 are generally considered satisfactory, since PHRED is usually interpreted as the probability that the basecall is incorrect equal to 10−PHRED/10. For some cycles, the software sometimes did not identify a base at all, apparently as a result of calculating that the quality was too low even to provide a potential base identification. Problems with these quality scores and failures to identify bases are discussed below.
Results
The complex primers containing anchor and index sequences all produced PCR products of approximately the predicted sizes (). The predicted size for all species was ∼540 bases (the length of the E. coli sequence from C2 to C4, plus the additional length of the C2X and C4Y complex primers). The lengths of the major PCR products were estimated by the Bioanalyzer as: B. fragilis, 585; S. pyogenes, 574 and 576 (two runs); E. coli, 575; and D. vulgaris, 554 and 563 (two runs). A further confirmation that the resultant PCR products were amplifications of rRNA gene was provided by nested PCR. PCR products subjected to amplification with C2F/C3R or C3F/C4R produced products of predicted sizes (data not shown).
Figure 3. PCR products amplified by complex primers. 16S rRNA gene PCR products amplified by complex primers, having anchor, index, and primer sequence, from many species. Primers were either C2X with C4Y or C2Y with C4X, as indicated. The C2Y/C4X reaction for Sp.01 failed for unknown reasons. Abbreviations: W: water control; Sp: S. pyogenes; Ec: E. coli; Bac: B. fragilis; Dsv: D. vulgaris.
Analysis of sequences of the above PCR products on the IGA gave images of clusters in lanes 2 - 8 for 35 cycles. Lane one, which contained the phiX control and Illumina primers, produced fluorescent clusters in cycles 1 - 10 but was essentially blank after the first 10 read cycles, as expected. Examination of comparably magnified tile images from the various lanes showed a 5- to 10-fold higher cluster density for the experimental samples than for the phiX Illumina control sample in lane 1 (data not shown).
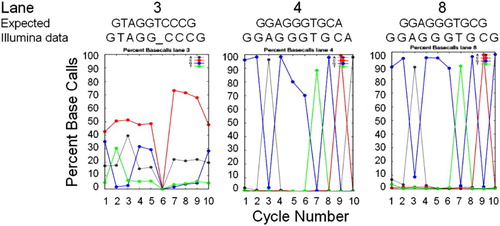
Initially, applying the standard Illumina image analysis software pipeline to all 35 cycles, did not generate any of the expected basecalls. We next applied the software pipeline solely to cycles 1 - 10. Again, very few bases were called for any cluster; however, as illustrated in , a graphic summary output of Bustard known as the ‘percent basecalls’ revealed expected sequence data for cycles 1 - 10 for several lanes. The best summary data were obtained for lanes 4 (E. coli sequence) and 8 (Desulfovibrio data). For lane 3, there appeared to be shifts in the baseline call rate for A and C, which, if subtracted, resulted in a better interpretation of the data. Thus, bases were erroneously called as ‘C’ about 50% of the time (top curve in cycles 1 - 5 in ) and ‘A’ about 20% of the time. Correcting for these high baseline rates resulted in the correct sequence for 9 out of 10 bases for S. pyogenes; no base was called for one of the bases. These outputs indicated that the primers for several of the lanes had indeed worked and that the image files did contain potentially accurate sequence data. With further modifications of the analysis scripts and application of the phi-X control data to later read cycles, we were able to demonstrate that other primers worked as well.
Figure 4. Sequence Basecall graphic summaries. Sequence information from the Percent Basecall graphic summaries of the Illumina analysis pipeline for cycles 1 – 10 for three lanes for which the basecalls (‘Illumina data’) matched the species-specific sequence expected in that lane (‘Expected’ for lane 3, S. pyogenes; lane 4, E. coli; and lane 8, D. vulgaris, based on sequences in Genbank). Basecall colors are: A, gray; C, red; G, blue; and T, green. For lane 3, the ‘Illumina data’ basecalls are listed after subtracting the high baseline error rate for ‘C’ and ‘A’ (see text).
illustrates a mostly successful analysis of data from E. coli, obtained for many clusters in lane 4. A shows the typical text output of data from a single cluster, illustrating both the sequence interpretation by the pipeline as well as its quality scoring. Since all DNA for this lane was known to be amplified from E. coli we know precisely what sequence should have been read from every cluster (B), and we therefore can calculate the percentage of clusters that successfully identified the correct base at each read cycle (C). Despite the fact that low quality scores of ‘B’ (PHRED score = 2) were given for all cycles > 10 (illustrated for one cluster in A, but also true of almost all other clusters), by Bustard, the correct base was often called > 99% of the time, and for some bases, the call was correct on 100% of the clusters. Indeed, the first 10 cycles, which had the highest quality scores, actually miscalled the correct base more frequently than those scored as quality ‘B’ in the last 10 cycles.
Figure 5. Accuracy of multiplex sequencing. Output and accuracy of Illumina 16S rRNA gene multiplex sequencing for a target of known sequence (Lane 4, E. coli). A) typical text output from the analysis pipeline, shown for one cluster of lane 4, tile 43. The sequence calls are followed by quality estimates using characters ‘_’, ‘B’, etc (see text). B) Expected sequence for E. coli, with the primers shown for their respective read cycles. Bases in black were called correctly > 95% of the time; in red, either not called or mostly incorrectly. C) Summary of the percent of correct calls analyzed for 150 clusters from lane 4, tile 43. Brackets are the same as in (B).
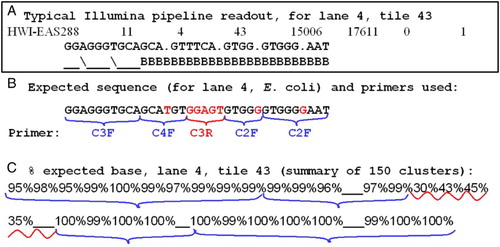
In this pilot test, only the forward primers appeared to work, and these clearly yielded correct sequence for read cycles initiated by primers C2F, C3F, and C4F. Primer C3R, which initiated sequencing for cycles 17 - 21, did not yield accurate sequence. Thus, for the best tiles and lanes, an example of which is illustrated in , the correct base was identified for > 95% of the clusters for 27 out of the 35 cycles that were read. In cases where both a forward and a reverse primer were put on the flow cell (e.g., primers C4R and C2F were used in cycles 27 - 35, hoping to get sequence from the two primers on different clusters) they gave only sequences initiated by the forward primer.
Discussion
While it was expected that the short primers (20 to 30 bases) that had been used in previous amplifications of 16S rRNA gene would work, prior to these experiments it was unknown whether the complex primers > 50 bases long containing anchor and index sequences would effectively amplify these target DNAs. It was possible that the anchor sequences might have unexpected effects on the specificity or side reactions of the primers. Therefore, it is reassuring that the initial step in this strategy produced PCR products of approximately the expected size. We further confirmed that these were rRNA gene PCR products with nested PCR using primers to the C3 region (data not shown). The slightly larger average size estimated by the Bioanalyzer (∼555 -585) than the expected ∼540 bp, may be due to a systematic bias in the Bioanalyzer calibration.
These experiments also confirmed that three of the six primers tested for initiating sequencing on the IGA did so effectively. All three forward primers (C2F, C3F, and C4F) worked, and one of them was tested twice (C2F, in the absence and presence, respectively, of primer C4R), demonstrating the consistency with which this forward primer could produce accurate sequence. Reverse primer C3R did not yield accurate sequence. The reason(s) for the failures of the reverse primers are unknown. We do know that DNA was amplified by the appropriate complex anchor primers on which the reverse primers should have worked. Whether this DNA failed to become properly anchored or possibly adjustments in the Bioinformatic Pipeline failed to identify those clusters in later cycles because they were not present in earlier cycles is unknown. The initial pilot test design attempted to test the reverse primers by using as their targets amplified DNA with ‘switched’ anchor sequences (i.e., switching anchor X and Y); possibly, a real ‘paired end’ approach would be a better test of these primers. There does not seem to be any intrinsic reason why the reverse primers should have failed, as they are equivalent in basic melting points and lengths to the forward primers that did work.
The analysis pipeline for these data needs further adjustment. Symbolic of this fact is that, despite the high accuracy of the sequences obtained when bases were actually called, the Bustard analysis indicated low PHRED scores that would have predicted numerous errors that we know did not occur. For example, the quality score of ‘B’ obtained for most of the later basecalls would ordinarily have been interpreted as a probability of 67% that the basecall was incorrect. In fact, in , the last two bases were called correctly 100% of the time despite that the quality score was ‘B’ for every one of them. Positions in the sequence at which Bustard did not call a base at all (cycles 14, 21, 26, and 32) may have occurred due to even lower quality score estimates, since we know that adjacent bases were nevertheless accurately called. Further modifications of the analysis pipeline may reveal how to enable the software to make more accurate quality estimates and hence reveal more of the sequence that we know is there. Some of the missing sequence may ‘appear’ when these parameters are improved.
Another issue is the necessity for the analysis pipeline to use reference data from a control lane. According to Illumina technical advice, the analysis pipeline depends on sufficient variation in color signals to determine which signals correspond to which base. In the present application, we had only a single entity in most lanes; hence, there was no cluster-to-cluster variation and the analysis pipeline was stymied. Instead, we had to apply the signals from the randomly fragmented phiX DNA signals in lane one to analyzing color data in the other lanes. Unfortunately, the phiX DNA can only be sequenced with the primers that were added during the cluster step. When the next primer is added for continuing the sequencing on the IGA, one can no longer get signal from the phiX control. We adopted the non-ideal solution of simply reusing the control phiX data collected in the first 10 cycles for the later cycles. This solution potentially assumes more stability in the instrument than is warranted, and may have accounted for the lower quality scores in cycles 11 - 35 than in cycles 1 - 10. Two other solutions are proposed for future testing: 1) using a mix of primers in later read cycles, an Illumina designed primer that targets the phiX sequences and the selected primer for reading the bacterial 16S rRNA gene sequences, and 2) design of a custom made control set of DNA sequences, having both the bacterial 16S rRNA primer sites and the requisite sequence-to-sequence variation so as to work for determining relative color intensities in the control lane.
Finally, the analysis pipeline may have been handicapped by abnormally high cluster densities observed for experimental samples compared to the phiX control. Excess or abnormal cluster formations could have accounted for failures to obtain any usable sequence data in lanes 2, 5, 6, and 7. In future experiments, lowering the DNA concentrations applied to the flow cell may improve the outcome.
Conclusions and Expected Applications
The strategy described in this paper shows how the reading of several sequences of length 75 - 100 bases can be initiated and combined to obtain > 300 bases needed for taxonomic analysis of mixed populations of bacteria. The successful application of this method to various human microbiomes, including the urogential tract, is expected to result in an unprecedentedly deep description of human microbiomes by sequencing representative sequences from a large number of organisms in multiplexed samples at a reasonable cost per sample. This will enable epidemiological studies of associations of features of that microbiome with various disease risk factors that probably could not otherwise be accomplished at a reasonable cost.
If applied to vaginal samples, the method could be used to determine changes in the proportions of specific bacterial species in disease and to quantify species normally occurring in frequencies lower than 0.1%. Each lane in the IGA flow cell normally yields ∼10,000,000 quality sequences, according to Illumina specifications and experimental reports [Turner et al. Citation2009]. With 12 multiplexed samples per lane, each sample should yield about 800,000 300 - 400 bp sequences. In vaginal samples from healthy women, common phylotypes, such as various species of Lactobacillus, might represent > 85% of the observed sequences [Forney et al. Citation2010; Oakley et al. Citation2008], and therefore account for > 700,000 of the sequences. However, the normal vaginal microbiome also contains many species present at frequencies < 0.1% [Forney et al. Citation2010], and vaginosis is known to be accompanied by increases or appearance of normally minor or absent constituents [Oakley et al. Citation2008]. For example, Prevotella averages ∼0.2% - 3% in vaginal samples from healthy subjects [Forney et al. Citation2010; Oakley et al. Citation2008] and is completely absent (< 0.1%) from about half the subjects [Forney et al. Citation2010]. In vaginosis, Prevotella increased to ∼20% of taxa detected [Oakley et al. Citation2008]. Organisms present in microbiome samples in the range of 0.2% - 20% would be expected to be represented by 1,600 - 160,000 sequences, respectively. A phylotype present at 0.002% would yield an average of 16 sequences, with a 95% confidence limit of 8 to 24 sequences. Even with microbiomes that have as many as 1,000 different species [Zoetendal et al. Citation2009], analyzing 800,000 sequences per sample stands an excellent chance of encountering nearly all of them. Future proof of concept studies may test whether the number of sequences detected accurately reflects the proportions of microbes in the input DNA by sequencing experimenter-constructed ratios of microbes of known sequence. A fully realized demonstration of the method, as outlined in the earlier section on “Sequencing Strategy for the Illumina Genome Analyzer,” would test a mixed set of bar-coded DNA extracts from several complex natural microbiomes. Potentially, the ratios of commonly observed sequences could be compared to the results of similar metagenomic analysis of the same DNA samples analyzed at less sequencing depth and higher price per base on another sequencing platform, such as the Roche 454.
Indeed, if the method can be implemented on the IGA as described, the costs per multiplexed sample are quite reasonable. The flow cell has 8 lanes, of which one is usually used for a control. At our facility, costs range from $6,500 (including labor) for an 18-cycle one-read full flow cell (7 non-multiplexed samples) to $30,000 for a 4-read + index 300-bp multiplexed full flow cell procedure. The multiplexed 4-read procedure would provide sequences for 12 samples/lane x 7 lanes = 84 samples (e.g., DNA obtained from 84 separate samples). Therefore, the cost per sample for sequencing would be $30,000/84 samples or ∼$350 per sample. If each lane contains 48 multiplexed samples, then a single run of 7 lanes would yield 7 x 48 samples (336 samples), which would be < $100 per sample. Sample acquisition, preparation, and post-sequencing analysis would add to this cost, but such costs would be encountered for practically any other molecular analysis as well. In comparison, the costs for pyrosequencing methods to achieve similar numbers of sequences per sample are currently at least five times as high.
The multiple-primer sequencing strategy described here may have wider applications, in other sequencers and in describing other microbiomes. The strategy may be applicable to other short-read next generation sequencers, such as the Ion Torrent. In addition to demonstrating a metagenomic technology that could be applied to the microbiome of the reproductive tract, this method can be extended to the study of other bacterial communities in humans, agriculture, and the environment.
Supplemental File 1
Strategy for microbiome analysis using 16S rRNA gene sequence analysis on the Illumina sequencing platform
Jeffrey L. Ram, Aos S. Karim, Edward D. Sendler, and Ikuko Kato
Methods: Details of Illumina basecalling used in this study
Sequence generation of data from the Illumina sequencer consists of two steps: image analysis (Firecrest module) and basecalling (Bustard). In a typical sequencing run these steps may be performed in a manner transparent to the experimenter by default Illumina software (SCS) with automatic generation of sequences from individual clusters. However, due to the extremely non-heterogeneous nature of the samples (basically identical sequences) in all lanes except for lane 1 (PhiX control), the standard Bustard basecalling parameters could not be used.
For Bustard basecalling, two calibration files are produced from initial image analysis results and used to properly analyze and assign confidence value to cluster identification and base identity. First, a cross-talk matrix file is required due to the fact that the Illumina Genome Analyzer uses two different lasers to excite dyes attached to each nucleotide. Since the emission spectra of these dyes overlap, the cross-talk between excited frequencies must be deconvolved using a matrix determined by overall image intensity results. Second, depending on the efficiency of the fluidics and the sequencing reactions, a small number of molecules in each cluster may run ahead (prephasing) or fall behind (phasing) the current incorporation cycle. A phasing file uses statistical averaging over many clusters and sequences to estimate the correlation of signal between different cycles and apply corrections during each basecalling step. By default, Bustard takes advantage of all tiles in all lanes to produce the most appropriate cross-talk and phasing calibration for each specific tile.
For both the cross-talk and phasing calibration, samples which contain only a small number of different sequences produce extremely skewed results for these estimates, necessitating a change in the default parameters for calculating their matrices (Sequencing Analysis Software User Guide, Illumina Corp. 2009). Due to the non-heterogeneous composition of our samples in lanes 2-8, only lane 1 (PhiX) contained a reasonable distribution of bases for each cycle. We therefore specified (as an additional Bustard parameter in the command line, “–control-lane = 1”) that only lane 1 should be used as control to generate calibration files for all lanes. Additionally, since primers for sequencing the PhiX sample were present only for cycles 1-10 (new primers used in later cycles go to all lanes, and hence primers designed for lanes 2 – 8 did not yield sequence for phiX), we copied PhiX results for cycles 1-10 in place of the original lane 1 data for cycles > 10 to create new (and valid for statistical calibration purposes) PhiX results for cycles 11-20, 21-30, and 31-35. Basecalling calibration for all sample lanes was thereby corrected based on a more appropriate distribution of sequence for each tile and cycle.
This method would be expected to introduce a higher error rate for overall basecalling in each of the sample lanes since calibration was no longer lane-specific; however, the higher error rate still allowed for determining the sample-specific sequences in each lane for a sufficient number of clusters to demonstrate the correct action of our new primers.
Abbreviation
| IGA: | = | Illumina Genome Analyzer. |
Acknowledgments
Fecal samples were obtained from community volunteers by Dr. Ikuko Kato under a research protocol that was approved by Wayne State University and the VA Medical Center Human Investigation Committees. Signed informed consent was obtained from each study participant. The research was supported by internal research stimulation funds provided by the Department of Physiology and Wayne State University. We thank the personnel of Wayne State's Applied Genomics Technology Center for technical assistance in designing these experiments and analyzing the image data.
Declaration of Interest: The authors alone are responsible for the content and writing of the paper and report no conflicts of interest.
References
- Baker, G.C., Smith, J.J. and Cowan, D.A. (2003) Review and re-analysis of domain-specific 16S primers. J Microbiol Methods 55(3):541–555.
- Caporaso, J.G., Lauber, C.L., Walters, W.A., Berg-Lyons, D., Lozupone, C.A., Turnbaugh, P.J., (2010) Global patterns of 16S rRNA diversity at a depth of millions of sequences per sample. Proceedings of the National Academy of Sciences of the United States of America. Published online before print June 3, 2010, doi: 10.1073/pnas.1000080107: 7 pp.
- Chen, F. (2008) New sequencing technologies at JGI and applications in bioenergy researches. In: Metagenomics 2008 workshop http://metagenomics.calit2.net/webcast.php, San Diego, CA. Viewed on August 1, 2010.
- Chuang, I., Van Beneden, C., Beall, B. and Schuchat, A. (2002) Population-based surveillance for postpartum invasive group A streptococcus infections, 1995–2000. Clin Infect Dis 35(6):665–670.
- Craig, D.W., Pearson, J.V., Szelinger, S., Sekar, A., Redman, M., Corneveaux, J.J., (2008) Identification of genetic variants using bar-coded multiplexed sequencing. Nat Methods 5(10):887–893.
- Eckburg, P.B., Bik, E.M., Bernstein, C.N., Purdom, E., Dethlefsen, L., Sargent, (2005) Diversity of the human intestinal microbial flora. Science 308:1635–1638.
- Forney, L.J., Gajer, P., Williams, C.J., Schneider, G.M., Koenig, S.S.K., McCulle, S. (2010) Comparison of self-collected and physician-collected vaginal swabs for microbiome analysis. J Clin Microbiol 48(5):1741–1748.
- Metzker, M.L. (2010) Applications of next-generation sequencing: Sequencing technologies - the next generation. Nat Rev Genet 11(1):31–46.
- Oakley, B.B., Fiedler, T.L., Marrazzo, J.M. and Fredricks, D.N. (2008) Diversity of human vaginal bacterial communities and associations with clinically defined bacterial vaginosis. Appl Environ Microbiol 74(15):4898–4909.
- Perkel, J.M. (2009) Sanger who? Sequencing the next generation. Science 324:275–279.
- Petrosino, J.F., Highlander, S., Luna, R.A., Gibbs, R.A. and Versalovic, J. (2009) Metagenomic Pyrosequencing and Microbial Identification. Clin Chem 55(5):856–866.
- Turnbaugh, P.J., Hamady, M., Yatsunenko, T., Cantarel, B.L., Duncan, A., Ley, R.E., (2009) A core gut microbiome in obese and lean twins. Nature 457(7228):480–484.
- Turner, E.H., Lee, C., Ng, S.B., Nickerson, D.A. and Shendure, J. (2009) Massively parallel exon capture and library-free resequencing across 16 genomes. Nat Methods 6(5):315–316.
- Wang, Q., Garrity, G.M., Tiedje, J.M. and Cole, J.R. (2007) Naive Bayesian classifier for rapid assignment of rRNA sequences into the new bacterial taxonomy. Appl Environ Microbiol 73:5261–5267.
- Zoetendal, E.G., Booijink, C., Wels, M., Smidt, H., de Vos, W.M. and Kleerebezem, M. (2009) A metagenomics view on the human microbiota of the small intestine. Microbial Ecology 57(3):587–588.