Abstract
An endogenous 17β-estradiol (E2) metabolite, 2-methoxyestradiol (2-ME2), has been reported to exhibit estrogen receptor (ER)-independent anti-angiogenic and anti-tumor effects. Several mechanisms have been proposed for 2-ME2 actions, but there is a lack of evidence for a common pathway for all of the cell-types sensitive to this metabolite. We have examined potential alterations in p53 in response to 2-ME2, E2 and the microtubule disruptor taxol in T47D breast cancer cells. Cells were cultured for six days in medium depleted of endogenous steroids or effectors. Semi-confluent cells were treated with 2-ME2 (1 nM – 10 µM), 10 nM E2 and/or 1 µM taxol and subjected to SDS-PAGE and Western blot analysis, quantitative analysis, or laser-scanning confocal microscopy. Western blot analysis revealed a concentration-dependent biphasic trend in p53 levels. Addition of 10 nM – 1 µM 2-ME2 induced significant up-regulation in p53, and this response gradually diminished to levels comparable to the control upon treatment with higher concentrations (2.5 – 10 µM). The observed upregulation of p53 induced by 2-ME2 is inhibited by concurrent treatment with 1 µM taxol. Cell quantitation revealed a significant decrease (50 – 90%) in cell number upon treatment with 1 – 10 µM 2-ME2 with minimal effect at lower concentrations. No additional effect on cell proliferation was observed when taxol was combined with 10 nM or 1 µM 2-ME2. In a concentration dependent manner, treatment with 2-ME2 for 24 h differentially influenced cellular localization of p53. These results may aid in further understanding the relationship between steroid receptors, tumor suppressor proteins, and effects of hormone metabolites on breast cancer cells.
Introduction
Estrogen exerts multiple effects on physiological functions in reproductive and other tissues [Agrawal and Alvin Jose Citation2010; Depalo et al. Citation2009]. It is widely known that 17β-estradiol (E2) is a mitogenic steroid that enhances proliferation of target cells. Several E2 metabolites have been shown to be more potent estrogenic compounds than their precursor [Nandi et al. Citation1995; Seegers et al. Citation1989]. However, unlike these growth-enhancing estrogen metabolites, 2-methoxyestradiol (2-ME2) is a highly potent anti-proliferative metabolite that induces apoptosis in tumor cells in vitro as well as in vivo [Pribluda et al. Citation2000]. The formation of 2-ME2 occurs from the catechol-o-methyltransferase (COMT)-mediated o-methylation of the catecholestrogen 2-hydroxyestradiol, a major metabolite formed in humans by the hepatic hydroxylation of E2 [Mannisto and Kaakkola Citation1999]. In addition to hydroxylation in the liver, 2-hydroxyestradiol is also formed in the uterus and breast, where it can then be further metabolized by COMT to form 2-ME2 or to other products by conjugation enzymes [Mannisto and Kaakkola Citation1999].
Studies have shown that 2-ME2 is a potent inhibitor of proliferation of transformed and endothelial cells [Fotsis et al. Citation1994; Lottering et al. Citation1992], as well as angiogenesis in vivo [Fotsis et al. Citation1994]. There are indications that the anti-proliferative effects of 2-ME2 are due to the targeted disruption of cellular events associated with proliferation [Fotsis et al. Citation1994; Mueck and Seeger Citation2010]. The metabolite has been shown to affect cell cycle events in S-phase, arrest mitotic cells during metaphase by disrupting correct microtubule assembly, and induce cellular alterations that are indicative of apoptosis [Attalla et al. Citation1996; Cushman et al. Citation1995; D'Amato et al. Citation1994; Hamel et al. Citation1996; Lottering et al. Citation1992; Mueck and Seeger Citation2010; Seegers et al. Citation1989]. These observations suggest that 2-ME2 is selective for only actively proliferating cells [Fotsis et al. Citation1994; Mueck and Seeger Citation2010].
Though the anti-proliferative and anti-angiogenic effects of 2-ME2 are well established [Cushman et al. Citation1995; D'Amato et al. Citation1994; Fotsis et al. Citation1994; LaVallee et al. Citation2002; Lottering et al. Citation1992; Pribluda et al. Citation2000; Seegers et al. Citation1989], the mechanism(s) by which this molecule elicits its effects is poorly understood. Several mechanisms have been proposed for 2-ME2 actions, but there is a lack of evidence for a common pathway for all of the cell-types sensitive to this metabolite. One of the proposed mechanisms is the up-regulation of the tumor suppressor protein p53 [Mukhopadhyay and Roth Citation1997; Seegers et al. Citation1997; Shimada et al. Citation2003]. The p53 phosphoprotein is a nuclear transcription factor that functions, in part, by responding to DNA damage and inducing apoptosis [Riley et al. Citation2008]. The level of p53 protein is indicative of the cellular response to stressors [Vogelstein et al. Citation2000]. The transcriptional and translational activation of the p53 protein after exposure to genotoxic and nongenotoxic stressors induces the expression of proteins involved in redox regulation, cell-cycle arrest, DNA repair, protein degradation, and apoptosis [El-Deiry et al. Citation1993; Erster et al. Citation2004; Grover et al. Citation2009; Halaby and Yang Citation2007]. The p53 protein's apoptotic function is primarily, but not exclusively, mediated via activation of mitochondrial apoptotic machinery through the intrinsic pathway [Erster et al. Citation2004; Grover et al. Citation2009; Hamel et al. Citation1996; Miyashita and Reed Citation1995].
Mutations of the p53 gene contribute to approximately fifty percent of all human cancers and are seen in a wide variety of tumors such as breast, lung, esophageal, liver, bladder, and ovarian carcinomas, as well as brain tumors, sarcomas, lymphomas, and leukemias [Hollstein et al. Citation1991]. Although the exact mechanism by which normal tissue transforms to a malignant state is unclear, the primary events associated with carcinogenesis may involve mutations in the p53 gene [Moudgil et al. Citation2001]. Earlier studies have shown abnormally high levels of the p53 protein in human tumor cell lines and tissues [Donehower and Bradley Citation1993]. These results suggest an alteration in regulation or structure of the p53 gene, due to the known increase in cellular stability of the mutant protein product compared to the normal wild type (wt) protein [Donehower and Bradley Citation1993].
Previously, Lottering et al. [1992] showed that estrogen receptor (ER)-positive MCF-7 breast cancer cells, expressing wt p53, were susceptible to the anti-mitotic effects of 2-ME2.Despite being a natural metabolite of E2, the antiproliferative and cytotoxic effects induced by 2-ME2 are independent of ER status and are not considered to be ER mediated [Cushman et al. Citation1995; LaVallee et al. Citation2002]. There is a paucity of information regarding the influence of 2-ME2 on tumor suppressor function in hormone-responsive breast cancer cells and thus further studies are warranted. Our laboratory initially reported the hormonal regulation of the p53 tumor suppressor protein in T47D breast cancer cells [Hurd et al. Citation1995; Moudgil et al. Citation2001]. The T47D cell line is estrogen receptor (ER) and progesterone receptor (PR)-positive and expresses p53 protein with a missense mutation at codon 194 converting leucine to phenylalanine [Nigro et al. Citation1989]. In the present study, the hormone dependent T47D breast cancer cells were utilized to examine the effects of 2-ME2 on cell proliferation and on the expression and localization of p53 protein. Studies were also conducted to compare the observed effects of 2-ME2 with those of exogenous E2 as well as the extensively studied microtubule-stabilizing agent taxol. The physiological effects of E2 are mediated via ER, and microtubules are the only known biochemical target of taxol. Comparison of the observed effects of these compounds may aid in elucidating mechanisms or potential pathways involved in the actions of this metabolite. Understanding the mechanism of p53 accumulation may lead to further examination of the potential of 2-ME2 in new therapeutic modalities.
Results
Effects of 2-ME2 on p53 Protein: Concentration Dependency
Our laboratory has previously shown that factors present in growth serum appear to be required for maintaining high p53 levels and that depletion of factor(s) by charcoal treatment decreases p53 to basal levels in T47D cells [Moudgil et al. Citation2001]. Results in show that when T47D cells were cultured in 5% fetal bovine serum (FBS) stripped with Dextran-coated charcoal (DCC-FBS) for six days (labeled as Cs), the level of p53 was approximately one-half of that observed when cells were grown in 10% FBS (labeled as Cw) for the total duration of the study. We have monitored the alteration in p53 protein level in cells grown for six days in 5% DCC-FBS to allow for a more direct assessment of the effects of 2-ME2 in these studies. When T47D cells were treated with 1 nM – 10 µM 2-ME2 for 24 h, the E2 metabolite caused a consistent biphasic trend in the levels of p53. As compared to Cs, a significant increase in the p53 level was observed upon addition of 10 nM – 1 µM 2-ME2. The observed increase in p53 level was not selective to 2-ME2, as E2 has been shown to reverse the effect of charcoal treatment on p53 levels [Hurd et al. Citation1995; Moudgil et al. Citation2001]. This response is reflected in results seen in showing a 70% increase in the level of p53 upon addition of 10 nM E2. Interestingly, higher concentrations of 2-ME2 (2.5-10 µM) appear to be less effective in altering observed p53 levels.
Figure 1. Concentration-dependent effects of 2-ME2 on p53. T47D cells were plated for two d in medium (- phenol red) containing 10% fetal bovine serum (FBS) followed by culturing for six d in medium containing 5% DCC-FBS. Semi-confluent cells were treated with 1 nM – 10 µM 2-ME2 or 10 nM E2 for 24 h. Cellular extracts were prepared and subjected to protein quantitation, SDS-PAGE, and Western analyses as described in Materials and Methods. Lanes labeled Cw and Cs represent control lanes with cells grown in the absence of ligands in medium containing either 10% FBS or DCC-FBS, respectively. The relative intensities of p53 as compared to Cs are displayed as the mean ± SEM. The sample sizes ranged from 3 - 15 integrated density measurements per group. *indicates significant difference with the control at p < 0.05 (Kruskal-Wallis Test followed by post-hoc analysis using Mann-Whitney U-Test). Representative Western blot is shown.
Effects of 2-ME2 on T47D Cell Proliferation: Concentration Dependency
In order to determine a physiological function of 2-ME2, quantitative analysis of the effects of this metabolite on cell proliferation was performed. Results presented in show the growth response of T47D cells cultured in the presence of 1 nM – 10 µM 2-ME2 or 10 nM E2. Although the use of physiological steroid hormones in experimental studies employs steroid concentrations in the nanomolar range, the metabolite 2-ME2 is effective in cell free systems at higher concentrations. Previous studies have shown inhibition of cellular proliferation by use of 1 – 10 µM 2-ME2 [Azab et al. Citation2009; LaVallee et al. Citation2002; Mueck and Seeger Citation2010; Pribluda et al. Citation2000; Van Zijl et al. Citation2008]. Thus the use of 2-ME2 at the concentrations utilized in our studies is consistent with similar concentrations employed by other investigators in the literature. T47D cells were cultured for two days in 10% FBS followed by culturing for six days in 5% DCC-FBS growth medium containing the exogenous ligands as described in Materials and Methods. Culturing T47D cells in 5% DCC-FBS greatly reduces their growth rate suggesting that charcoal treatment removes factors that are required for maximal proliferation of this cell line [Hurd et al. Citation1995; Kodali et al. Citation1994]. The addition of 10 nM E2, induced a significant proliferative response in cells cultured in the absence of serum growth factors and reflects findings reported previously by this laboratory [Hurd et al. Citation1995]. When T47D cells were cultured in the presence of 1 – 100 nM 2-ME2, no significant effect on the cell population was observed. However, treatment with 1 – 10 µM 2-ME2 caused significant growth inhibition (50 – 90%) in this cell line.
Figure 2. Effects of 2-ME2 on T47D cell proliferation. T47D cells were seeded at 15,000 cells/well in 12 well growth plates for two d in medium (- phenol red) containing 10% FBS followed by culturing for six d in medium containing 5% DCC-FBS supplemented with 1 nM – 10 µM 2-ME2 or 10 nM E2. Control and treatment medium was changed every 48 h. Cells were trypsinized and counted by Coulter Counter (model # Z2) after six d of treatment. Mean cell populations ( ± SEM) were plotted as a percentage of Cs with 100% on the ordinate scale representing cells cultured in the absence of ligands (
= 2.1 × 10⁵ cells/well). The sample sizes ranged from 8-20 cell counts per group. *indicates significant difference with the control at p < 0.05 (Kruskal-Wallis Test followed by post-hoc analysis using Mann-Whitney U-Test).
Effects of 2-ME2, E2 and Taxol on p53
The use of microtubule-disrupting agents such as taxol in the treatment of neoplastic disease has long been established. Previous studies from our laboratory have demonstrated that 1 µM taxol was equally effective in blocking T47D cell proliferation when cultured in 5% FBS or DCC-FBS, indicating that taxol effects are not dependent on charcoal-sensitive heterocyclic compounds [Kodali et al. Citation1994]. In order to gain insight into possible similarities between 2-ME2 and other microtubule-disrupting agents, T47D cells cultured in 5% DCC-FBS were treated with 10 nM and 1 µM 2-ME2 and 1 µM taxol alone or in combination for 24 h (). For comparative purposes, 10 nM E2 alone and in combination with 1 µM taxol was also included in this study. Treatment with 1 µM taxol alone did not significantly affect p53 protein level. However, taxol was able to inhibit up-regulation of p53 induced by 10 nM E2. Interestingly, 1 µM taxol also had an inhibitory effect on the ability of 2-ME2 (10 nM and 1 µM) to increase p53 level.
Figure 3. The effects of 2-ME2, E2, and Taxol on p53 protein. Culture and treatment of T47D cells with 2-ME2, E2, and taxol was performed as described in Figure 1. Cellular extracts were prepared and subjected to protein quantitation, SDS-PAGE and Western analyses. The relative intensities of p53 as compared to control (Cs) are displayed as the mean ± SEM. The sample sizes ranged from 3 - 15 density measurements per group. *indicates significant difference with the control at p < 0.05 (Kruskal-Wallis Test followed by post-hoc analysis using Mann-Whitney U-Test). Representative Western blot is shown.
Effects of 2-ME2, E2, and Taxol on T47D Cell Proliferation
To determine whether an additional benefit exists when 2-ME2 is combined with taxol, a quantitative analysis of cell growth was performed. T47D cells were cultured for six days in 5% DCC-FBS and in the presence of 10 nM and 1 µM 2-ME2, 10 nM E2, or 1 µM taxol, either alone or in combination. Addition of 1 µM taxol caused a decrease in T47D cell number (), which was consistent with previously published results from our laboratory [Kodali et al. Citation1994]. When used in combination with E2, taxol significantly reversed the proliferative effects of E2, causing an 85% inhibition in cell growth as compared to the control. No additional effects were observed upon treatment of cells with 2-ME2 and taxol in combination.
Figure 4. The effects of 2-ME2, E2, and Taxol on T47D cell proliferation. Cells were seeded into 12 well growth plates in medium containing 10% FBS at a density of 20,000 cells/well followed by culturing for 6 d in media that contained 5% DCC-stripped FBS and 2-ME2, E2, or taxol, either alone or in combination. Control and treatment media was changed every 48 h. Cells were trypsinized and counted by Coulter Counter (model # Z2) after six d of treatment. Mean cell populations ( ± SEM, n = 6) were plotted as a percentage of control cells with 100% on the ordinate scale representing cells cultured in the absence of ligands (
= 3.2 x 10⁵ cells/well). *indicates significant difference between treatment and control at p < 0.05 (Kruskal-Wallis Test followed by post-hoc analysis using Mann-Whitney U-Test).
Immunolocalization of p53 in T47D Cells: the Effects of 2-ME2, E2, and Taxol
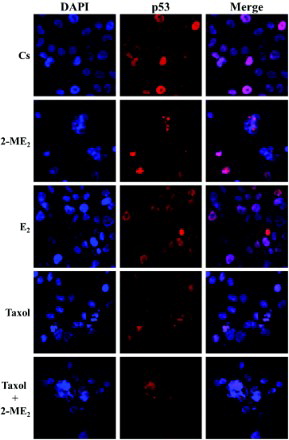
To determine if the effects of 2-ME2 on the level of p53 correlate with alterations in the cellular localization of the tumor suppressor, immunolabeling of p53 protein in T47D cells was performed followed by laser-scanning confocal microscopy. Consistent with the transcriptional function of this nuclear phosphoprotein, results in reveal p53 localized in the nuclei of T47D cells cultured in 5% DCC-FBS. This nuclear localization appears predominantly dispersed throughout the nuclear compartment which can be seen in the DAPI (nuclear counterstain) and p53 merged images. The addition of 2-ME2, E2, and/or taxol for 24 h, did not alter the cellular localization of this protein as it remained in the nucleus. However, treatment with 10 nM 2-ME2 for 24 h, induced an alteration in the subnuclear localization of p53. Distinct p53 foci are visible that appear to overlap negative region/s in DAPI stained nuclei in approximately 10-20% of T47D cells. This observation potentially suggests p53 accumulation within nucleolar regions of cells [Maggi and Weber Citation2005]. This effect is consistently observed upon exposure of T47D cells to 10 nM 2-ME2 for 24 h, and is also exhibited in cells treated with this concentration of the metabolite in combination with 1 µM taxol.
Figure 5. Immunolocalization of p53 in T47D cells: the effects of 2-ME2, E2, and Taxol. Cells were seeded at 15,000 cells/well on coverslips in 12 well growth plates for two d in medium containing 10% FBS, followed by culturing for six d in medium containing 5% DCC-stripped FBS. Cells were treated with 10 nM 2-ME2, 10 nM E2, and/or 1 µM taxol for 24 h. Localization of p53 was determined by immunolabeling and the distribution was analyzed using a Nikon Digital Eclipse C1 plus modular confocal microscope. DAPI (blue) and Cy3 were employed to detect the immunolocalization of p53 (red). The acquired images were processed using Nikon Elements AR software. The merged images illustrate localization of p53 relative to DAPI nuclear counterstain.
Discussion
The p53 tumor suppressor protein is a nuclear phosphoprotein, which functions as a transcription factor that indirectly regulates the cell cycle. The transcriptional activity of p53 is determined by its ability to bind to sequence-specific DNA response elements [Cho et al. Citation1994; Hupp et al. Citation1992], and is modulated by the intranuclear concentration of the protein. Thus, measured levels of p53 are an important determinant of its activity [Hurd et al. Citation1995]. An alteration in p53 protein expression may indicate a potential role for this protein in the cellular response to new therapeutic modalities.
Previous studies in this laboratory have demonstrated that supplementation with physiological concentrations of E2 (0.1 - 1 nM), induces an accumulation of the p53 protein in T47D breast cancer cells as well as an increase in cellular proliferation [Dinda et al. Citation2010; Hurd et al. Citation1995; Moudgil et al. Citation2001]. Among the steroid hormones known to significantly influence breast function, E2 plays a crucial role in the progression of hormone-dependent breast cancer. Recent reports indicate that metabolites of E2 may also have their own roles in the continuous growth or regression of cancer. It is possible that tumor progression may be regulated to some extent by estrogen metabolism, with some metabolites having mitogenic properties and others, such as 2-ME2, inducing inhibitory responses. It is important to assess the role of E2 metabolites in both normal and cancerous entities to distinguish the metabolic balance that may be required.
In the presence of 10 nM – 1 µM 2-ME2, there is an accumulation of the p53 protein in T47D cells (). One possible explanation for the observed increase in p53 protein expression may involve the c-Jun N-terminal kinase (JNK) signaling pathway [Fukui and Zhu Citation2009; Shimada et al. Citation2003]. It has been shown that activated JNK increases p53 stability by mediating p53 phosphorylation [Fuchs et al. Citation1998b; Fuchs et al. Citation1998c]. This induces conformational alterations in the protein inhibiting complex formation with inactive JNK and Mdm2 [Fuchs et al. Citation1998b; Fuchs et al. Citation1998c]. Thus, the level of p53 is found to be inversely correlated with its direct association with inactive JNK and Mdm2 due to targeted ubiquitination of the tumor suppressor protein [Fuchs et al. Citation1998a; Haupt et al. Citation1997; Milne et al. Citation1995]. It was recently reported that 2-ME2 induced phosphorylation/activation of JNK, ERK (extracellular signal-regulated kinase), and p38 in the ER-negative MDA-MB435s breast cancer cell line [Fukui and Zhu Citation2009]. It has also been shown in the LNCaP prostate cancer cell line, 2-ME2 up-regulated p53 through p38/JNK-dependent nuclear factor kappaB (NFkappaB)/activation protein-1 (AP-1) activation [Shimada et al. Citation2003]. Inhibition of JNK in LNCaP prostate cancer cells diminished induction of p53 protein by 2-ME2 [Shimada et al. Citation2003], and expression of a phosphorylation-deficient JNK mutant in ER-positive MCF-7 breast cancer cells inhibited the taxol-induced up-regulation of p53 protein levels [Fuchs et al. Citation1998b].
It is known that taxol-induced apoptosis requires JNK activation [Lee et al. Citation1998; Noguchi et al. Citation1999]. When 2-ME2 was used in concurrent combination with 1 µM taxol, the observed upregulation of p53 with 10 nM and 1 µM 2-ME2 alone was inhibited in T47D cells (). Differential effects on p53 have been reported upon treatment with taxol [Giannakakou et al. Citation2001] and p53 may or may not be inducible in various cell lines regardless of mutant or wt status. The presence of insulin has also been shown to modulate the taxol-induced response in MCF-7 cells inhibiting the upregulation of the tumor suppressor protein which is commonly found in this cell line [Miglietta et al. Citation2004]. This indicates that variations in p53 induction could be a result of the conditions by which these cell lines are cultured and reflects the high degree of sensitivity and complexity of these processes. Further studies are warranted to determine whether insulin or JNK activation play a role in the observed increase in p53 levels upon addition of 2-ME2 in T47D cells.
The decrease in p53 levels upon 24 h treatment with 2.5 – 10 µM 2-ME2 in T47D cells, may be due to a process reported to be shared with taxol. 2-ME2 is a known inhibitor of hypoxia-inducible factor-1 (HIF-1α) [Mabjeesh et al. Citation2003; Mueck and Seeger Citation2010]. This inhibition is reported to be a post-transcriptional process that occurs following microtubule disruption and is shared with other microtubule disrupting agents including taxol [Mabjeesh et al. Citation2003]. Inhibition of specific protein biosynthesis may be a common process among microtubule disrupting agents, as this effect has also been shown by taxol on ERα [Martin et al. Citation2004]. The underlying mechanism that mediates this post-transcriptional process is currently unknown.
The data presented above shows the anti-proliferative effects of 2-ME2. Other laboratories have previously shown that treatment with nanomolar concentrations of 2-ME2 induced a mitogenic response in T47D cells that they believe is mediated by ER when cultured in the absence of exogenous E2 [Han et al. Citation2005; Liu et al. Citation2005; Liu and Zhu Citation2004; Vijayanathan et al. Citation2006]. This study has consistently found an anti-proliferative effect of 2-ME2 at concentrations of 1-100 nM in T47D cells, however, these results are not significant when compared to the control. Lottering et al. [1992] also reported antiproliferative effects in MCF-7 cells when treated with 10 nM 2-ME2. Differences in these observations may be based on the culturing conditions or confluency of cultures during treatment. Fotsis et al. [1994] found that treatment with 2-ME2 did not induce an inhibitory effect on cell proliferation in confluent monolayer endothelial and fibroblast cultures, but inhibition was apparent in cultures with lower cell densities. However, when confluent cultures were treated with 2-ME2 in the presence of exogenous basic fibroblast growth factor, an inhibitory effect on proliferation that reflected non-confluent cultures was observed [Fotsis et al. Citation1994]. This indicates that 2-ME2-induced cytostatic effects occur only in actively cycling cells. It is possible that when lacking specific growth factor stimulation, physiological concentrations of 2-ME2 act as a weak ER agonist inducing a mild mitogenic effect in quiescent cultures of ER-positive breast cancer cells. When cells are treated in the presence of exogenous E2, the stimulatory effect induced by E2 in these confluent cultures may then promote the anti-mitotic effects of 2-ME2 leading to inhibition of proliferation and cell death.
The level of p53 protein is indicative of the cellular response to stressors [Vogelstein et al. Citation2000], and the localization of p53 is also a crucial factor in this response. In these studies, p53 localization remained nuclear upon 24 h treatment with 2-ME2, E2 and taxol. It is possible, that the protocol or antibody utilized may dictate this observation. Regardless, an interesting observation of the subnuclear localization of p53 was made in T47D cells that were treated with 10 nM 2-ME2 for 24 h. It appears that this protein may be accumulating, possibly through sequestration, in regions that overlap those of the nucleoli. Further studies are needed in order to confirm if p53 is indeed localizing to nucleolar compartments or intranucleolar cavities. It has been reported that p53 localizes and/or accumulates in the nucleolus or within intranucleolar cavities in several cell lines under specific experimental conditions [Benninghoff et al. Citation1999; Horky et al. Citation2001; Karni-Schmidt et al. Citation2007; Karni-Schmidt et al. Citation2008; Klibanov et al. Citation2001; Latonen et al. Citation2003; Pokrovskaja et al. Citation2001; Rubbi and Milner Citation2000; Wesierska-Gadek et al. Citation2002]. The physiological relevance to this process and how p53 is targeted to nucleolar regions remains to be elucidated. Efforts are now underway to examine 2-ME2 effects in MCF-7 cell line with wt expression of p53. We are also attempting to investigate mechanism of induction of p53 by 2-ME2 in T47D cells. Results of these initial studies will form the basis of comparing effects of 2-ME2 on p53 levels in its wt and mutated form.
In summary, these results presented above suggest that 2-ME2 regulates p53 at the molecular level. Whether 2-ME2 regulates p53 transcription, or whether the mechanism is indirect or post-transcriptional calls for future investigation. The observation that 2-ME2 increased p53 levels in breast cancer cells, as well as blocking cellular proliferation, has implications in understanding the role of estrogen metabolite(s) in the regulation of tumor progression. Additional studies are warranted to determine the mechanism of 2-ME2 action to provide more insight into the role of 2-ME2 in p53 expression as well as its implication in hormone responsive breast cancer.
Materials and Methods
Cell Culture and Treatment with Ligands
T47D human breast cancer cells (HTB-133) were obtained from ATCC (Manassas, VA, USA). Cells were routinely cultured in RPMI-1640 with phenol red (Hyclone, Logan, UT, USA), containing 2 mM L-glutamine, 25 mM Hepes, antibiotic antimycotic solution (100 units/ml penicillin, 0.1 mg/ml streptomycin, and 0.25 mg/ml amphotericin B) (Hyclone), and 0.14 IU/ml insulin (Sigma, St. Louis, MO, USA) supplemented with 10% (v/v) FBS (Hyclone) and incubated at 37°C in the presence of 5% CO2.
In all studies, T47D cells were subcultivated into phenol red-free RPMI-1640 media (Hyclone) containing the above components with alterations in the type and percentage of FBS utilized. Cells were plated in 10% FBS media and allowed to attach and grow for 48 h. To ensure steroid-free treatment conditions, the cell culture medium was changed to contain 5% DCC-FBS as described [Kodali et al. Citation1994], which depletes the serum of small heterocyclic molecules including serum growth factors. To ensure that the protein of interest was expressed only at basal levels prior to treatment with ligands [Hurd et al. Citation1995; Moudgil et al. Citation2001] the cells were cultured in 5% DCC-FBS for a total of six d, with fresh medium added every 48 h. On the 6th day, semi-confluent cells were treated with various ligands for 24 h. Ligands were dissolved in ethanol (2-ME2, E2) or methanol (taxol) and stock solutions were prepared to a 1,000-fold higher concentration. Aliquots (10 µl) of ligands were added directly to 10 ml of the culture medium (< 0.1% ethanol or methanol vehicle) and incubated for 24 h.
Protein Extraction of Cells
The culture medium was removed by aspiration, and the cells were washed with 10 ml ice cold Hank's balanced salt solution (HBSS). Cells were lysed in 500 µl of RIPA lysis buffer (50 mM Tris-HCl, 150 mM NaCl, 1.0% Triton X-100, 0.25% sodium deoxycholate, 5.0 mM EDTA) in the presence of 1 mM leupeptin, 30 µg/ml pepstatin-A, 30 µg/ml chymostatin, and 0.3 mM PMSF [Dinda et al. Citation1997; Dinda et al. Citation2010; Hurd et al. Citation1999; Moudgil et al. Citation2001], or 10 µl/ml Halt protease inhibitor cocktail (Thermo Fisher Scientific, Hanover Park, IL, USA) and cells were removed from the culture dish using disposable cell scrapers. A high speed supernatant of the extracts was prepared via centrifugation at 15,000 × g for 15 min at 4°C, and sample aliquots were frozen in liquid nitrogen and stored at -20°C until further use.
Quantification of Proteins
The protein concentration in individual samples was determined by using a standard protein assay (Bio-Rad, Hercules, CA, USA) based on the method of Bradford [1976]. The linear regression method was used to calculate the protein concentration of the individual samples, which was equalized prior to loading.
SDS-PAGE and Western Analyses
The supernatant was denatured (3 min, 100°C) and 25 µg aliquots of total protein/lane were loaded on a 4-20% polyacrylamide gel under denaturing conditions and electrophoresed for the separation of proteins. Proteins were wet transferred to Immobilon-P polyvinylidene fluoride (PVDF) membrane (Millipore, Bedford, MA, USA) by using a Bio-Rad trans blot cell in a tris-glycine buffer system containing 0.025% SDS and 15% methanol. Membranes were blocked for 1 h in Tris-buffered saline (TBS)-tween (0.1%) plus 5% Carnation instant non-fat dry milk, then probed for 1 h in the same solution containing a 1:1000 dilution of anti-p53 monoclonal antibody (80/p53, BD Transduction Laboratories, San Jose, CA, USA) [Dinda et al. Citation2002; Citation2010; Hurd et al. Citation1995; Moudgil et al. Citation2001]. The membrane was washed for 30 min with three changes of TBS-tween, re-blocked for 15 min with TBS-tween plus 5% Carnation instant non-fat dry milk and then incubated in the same solution plus a 1:1000 dilution of horse radish peroxidase (HRP)-conjugated goat anti-mouse IgG2a secondary antibody (Santa Cruz Biotechnology Inc., Santa Cruz, CA, USA). After a final wash, p53-specific bands were visualized using autoradiography by the enhanced chemiluminescence (ECL) method according to instructions from Amersham. After immunoblotting, the PVDF membranes were then stained with coomassie blue to ensure the correct normalization against total protein levels and full transfer of the protein. The Western blots were subjected to quantitation of the protein band density using the ImageJ program (NIH, Bethesda, MD, USA).
Cell Proliferation Assays
All growth studies were conducted in 12-well culture plates. To ensure active, non-confluent cell populations during treatment duration, wells were initially seeded with 1.5 × 10⁴ or 2.0 × 10⁴ cells per well in 1 ml culture medium containing 10% FBS. The ligands were suspended in 5% DCC-FBS media and added to the wells 48 h later. Control wells received only 5% DCC-FBS culture medium. The culture medium in the absence or presence of ligands, was changed every 48 h. The proliferation studies were limited to eight d total duration to correlate with results of Western analyses. On the 8th day, the cells were washed with HBSS, trypsinized, and removed from individual wells of the culture plate. The resulting cell suspension was quantified by the Coulter counter model Z2 (Coulter Electronics Inc., Hialeah, FL, USA).
Immunofluorescence and Confocal Microscopy
T47D cells were plated on cover slips in 12-well plates (15,000 cells/well) and cultured for 48 h in 10% FBS. The cell culture medium was then changed to 5% DCC-FBS and fresh medium was added at 2-d intervals. The cells were cultured in 5% DCC-FBS for a total of six d. On day six, the ligands were suspended in 5% DCC-FBS media, and semi-confluent cells were treated for 24 h.
Immunolabeling was performed as previously described for p53 [Dinda et al. Citation2002; Citation2010]. Briefly, the cells were fixed on cover slips for 10 min with 1% formalin in phosphate buffered saline (PBS), permeabilized with ice cold acetone and methanol (50:50) and washed three times with PBS. Staining procedures were performed in a humidified chamber at 25oC. Cells were incubated in 10% goat serum (Sigma) to suppress nonspecific binding of IgG, followed by 2 h incubation with 1:200 dilution anti-p53 (80/p53) monoclonal antibody. After washing with PBS, cells were incubated for 3 h with 1:200 dilution anti-mouse IgG conjugated with Cy3 (Jackson ImmunoResearch Laboratories, West Grove, PA, USA). Cover slips were washed in PBS, and incubated for 2 min in 1 µg/ml 4',6-diamidino-2-phenylindole (DAPI) dissolved in PBS. Cells were washed three times in PBS, mounted with Fluoromunt-G (Electron Microscopy Sciences, Hatfield, PA, USA) and stored in the dark at 4oC.
The distribution of three-dimensional fluorescent structures was analyzed using a Nikon Digital Eclipse C1 plus confocal microscope. NIS elements software (Nikon Instruments, Melville, NY, USA) was used for noise reduction and three-dimensional reconstruction of the images.
Statistical Analyses
The results are expressed as mean ± SEM. Statistical significance was determined by Kruskal-Wallis test followed by post-hoc analysis using Mann-Whitney U-test. Differences were considered significant at p < 0.05. Statistical analyses were carried out using SPSS for Windows version 11.5 (SPSS Inc., Chicago, IL, USA).
Abbreviations
| 2-ME2: | = | 2-methoxyestradiol |
| ATCC: | = | American type culture collection |
| COMT: | = | catechol-o-methyltransferase |
| Cs: | = | control cells cultured in 5% fetal bovine serum (FBS) treated with Dextran-coated charcoal (DCC) |
| Cw: | = | control cells cultured in 10% FBS |
| DAPI: | = | 4′,6-diamidino-2-phenylindole |
| E2: | = | 17β-estradiol |
| ECL: | = | enhanced chemiluminescence |
| ER: | = | estrogen receptor |
| HBSS: | = | Hanks' balanced salt solution |
| p53: | = | 53-kDa tumor suppressor protein |
| PBS: | = | phosphate buffered saline |
| PMSF: | = | phenylmethylsulfonyl fluoride |
| PR: | = | progesterone receptor |
| PVDF: | = | polyvinylidene fluoride |
| RIPA: | = | radio-immunoprecipitation assay |
| SDS-PAGE: | = | sodium dodecyl sulfate polyacrylamide gel electrophoresis |
| TBS: | = | tris-buffered saline |
Acknowledgments
This research was made possible by support from Oakland University Cancer Research Program and Provost's Graduate Student Research Awards to AES and ALS. SD acknowledges support from Center for Biomedical Research, Oakland University.
Declaration of interest: The authors report no conflicts of interest. The authors alone are responsible for the content and writing of the paper.
References
- Agrawal, S.S. and Alvin Jose, M. (2010) Roxatidine, an H(2) receptor blocker, is an estrogenic compound–experimental evidence. Syst Biol Reprod Med 56:286–291.
- Attalla, H., Makela, T.P., Adlercreutz, H. and Andersson, L.C. (1996) 2-Methoxyestradiol arrests cells in mitosis without depolymerizing tubulin. Biochem Biophys Res Commun 228:467–473.
- Azab, S.S., Salama, S.A., Abdel-Naim, A.B., Khalifa, A.E., El-Demerdash, E. and Al-Hendy, A. (2009) 2-Methoxyestradiol and multidrug resistance: can 2-methoxyestradiol chemosensitize resistant breast cancer cells? Breast Cancer Res Treat 113:9–19.
- Benninghoff, J., Kartarius, S., Teleb, Z., Selter, H., Unteregger, G., Zwergel, T., (1999) Two different forms of p53 localized differently within cells of urogenital tumours. Cancer Lett 144:55–64.
- Bradford, M.M. (1976) A rapid and sensitive method for the quantitation of microgram quantities of protein utilizing the principle of protein-dye binding. Anal Biochem 72:248–254.
- Cho, Y., Gorina, S., Jeffrey, P.D. and Pavletich, N.P. (1994) Crystal structure of a p53 tumor suppressor-DNA complex: understanding tumorigenic mutations. Science 265:346–355.
- Cushman, M., He, H.M., Katzenellenbogen, J.A., Lin, C.M. and Hamel, E. (1995) Synthesis, antitubulin and antimitotic activity, and cytotoxicity of analogs of 2-methoxyestradiol, an endogenous mammalian metabolite of estradiol that inhibits tubulin polymerization by binding to the colchicine binding site. J Med Chem 38:2041–2049.
- D'Amato, R.J., Lin, C.M., Flynn, E., Folkman, J. and Hamel, E. (1994) 2-Methoxyestradiol, an endogenous mammalian metabolite, inhibits tubulin polymerization by interacting at the colchicine site. Proc Natl Acad Sci USA 91:3964–3968.
- Depalo, R., Lorusso, F., Bettocchi, S., Selvaggi, L., Cavallini, A., Valentini, A.M., (2009) Assessment of estrogen receptors and apoptotic factors in cryopreserved human ovarian cortex. Syst Biol Reprod Med 55:236–243.
- Dinda, S., Kodali-Gali, S., Sevilla, L., Burkley, M., Hurd, C. and Moudgil, V.K. (1997) Inhibition of proliferation of T47D human breast cancer cells: alterations in progesterone receptor and p53 tumor suppressor protein. Mol Cell Biochem 175:81–89.
- Dinda, S., Sanchez, A. and Moudgil, V. (2002) Estrogen-like effects of thyroid hormone on the regulation of tumor suppressor proteins, p53 and retinoblastoma, in breast cancer cells. Oncogene 21:761–768.
- Dinda, S., Sanchez, A. and Moudgil, V.K. (2010) Effects of LY117018 (a SERM analog of raloxifene) on tumor suppressor proteins and proliferation of breast cancer cells. Horm Mol Biol Clin Investig 2:211–217.
- Donehower, L.A. and Bradley, A. (1993) The tumor suppressor p53. Biochim Biophys Acta 1155:181–205.
- El-Deiry, W.S., Tokino, T., Velculescu, V.E., Levy, D.B., Parsons, R., Trent, J.M., (1993) WAF1, a potential mediator of p53 tumor suppression. Cell 75:817–825.
- Erster, S., Mihara, M., Kim, R.H., Petrenko, O. and Moll, U.M. (2004) In vivo mitochondrial p53 translocation triggers a rapid first wave of cell death in response to DNA damage that can precede p53 target gene activation. Mol Cell Biol 24:6728–6741.
- Fotsis, T., Zhang, Y., Pepper, M.S., Adlercreutz, H., Montesano, R., Nawroth, P.P., (1994) The endogenous oestrogen metabolite 2-methoxyoestradiol inhibits angiogenesis and suppresses tumour growth. Nature 368:237–239.
- Fuchs, S.Y., Adler, V., Buschmann, T., Wu, X. and Ronai, Z. (1998a) Mdm2 association with p53 targets its ubiquitination. Oncogene 17:2543–2547.
- Fuchs, S.Y., Adler, V., Buschmann, T., Yin, Z., Wu, X., Jones, S.N., (1998b) JNK targets p53 ubiquitination and degradation in nonstressed cells. Genes Dev 12:2658–2663.
- Fuchs, S.Y., Adler, V., Pincus, M.R., and Ronai, Z. (1998c) MEKK1/JNK signaling stabilizes and activates p53. Proc Natl Acad Sci USA 95:10541–10546.
- Fukui, M. and Zhu, B.T. (2009) Mechanism of 2-methoxyestradiol-induced apoptosis and growth arrest in human breast cancer cells. Mol Carcinog 48:66–78.
- Giannakakou, P., Robey, R., Fojo, T. and Blagosklonny, M.V. (2001) Low concentrations of paclitaxel induce cell type-dependent p53, p21 and G1/G2 arrest instead of mitotic arrest: molecular determinants of paclitaxel-induced cytotoxicity. Oncogene 20:3806–3813.
- Grover, R., Candeias, M.M., Fahraeus, R. and Das, S. (2009) p53 and little brother p53/47: linking IRES activities with protein functions. Oncogene 28:2766–2772.
- Halaby, M.J. and Yang, D.Q. (2007) p53 translational control: a new facet of p53 regulation and its implication for tumorigenesis and cancer therapeutics. Gene 395:1–7.
- Hamel, E., Lin, C.M., Flynn, E. and D'Amato, R.J. (1996) Interactions of 2-methoxyestradiol, an endogenous mammalian metabolite, with unpolymerized tubulin and with tubulin polymers. Biochemistry 35:1304–1310.
- Han, G.Z., Liu, Z.J., Shimoi, K. and Zhu, B.T. (2005) Synergism between the anticancer actions of 2-methoxyestradiol and microtubule-disrupting agents in human breast cancer. Cancer Res 65:387–393.
- Haupt, Y., Maya, R., Kazaz, A. and Oren, M. (1997) Mdm2 promotes the rapid degradation of p53. Nature 387:296–299.
- Hollstein, M., Sidransky, D., Vogelstein, B. and Harris, C.C. (1991) p53 mutations in human cancers. Science 253:49–53.
- Horky, M., Wurzer, G., Kotala, V., Anton, M., Vojtesek, B., Vacha, J., (2001) Segregation of nucleolar components coincides with caspase-3 activation in cisplatin-treated HeLa cells. J Cell Sci 114:663–670.
- Hupp, T.R., Meek, D.W., Midgley, C.A. and Lane, D.P. (1992) Regulation of the specific DNA binding function of p53. Cell 71:875–886.
- Hurd, C., Khattree, N., Alban, P., Nag, K., Jhanwar, S.C., Dinda, S., (1995) Hormonal regulation of the p53 tumor suppressor protein in T47D human breast carcinoma cell line. J Biol Chem 270:28507–28510.
- Hurd, C., Nag, K., Khattree, N., Alban, P., Dinda, S. and Moudgil, V.K. (1999) Agonist and antagonist-induced qualitative and quantitative alterations of progesterone receptor from breast cancer cells. Mol Cell Biochem 199:49–56.
- Karni-Schmidt, O., Friedler, A., Zupnick, A., McKinney, K., Mattia, M., Beckerman, R., (2007) Energy-dependent nucleolar localization of p53 in vitro requires two discrete regions within the p53 carboxyl terminus. Oncogene 26:3878–3891.
- Karni-Schmidt, O., Zupnick, A., Castillo, M., Ahmed, A., Matos, T., Bouvet, P., (2008) p53 is localized to a sub-nucleolar compartment after proteasomal inhibition in an energy-dependent manner. J Cell Sci 121:4098–4105.
- Klibanov, S.A., O'Hagan, H.M. and Ljungman, M. (2001) Accumulation of soluble and nucleolar-associated p53 proteins following cellular stress. J Cell Sci 114:1867–1873.
- Kodali, S., Burkley, M., Nag, K., Taylor, R.C. and Moudgil, V.K. (1994) Taxol and cisplatin inhibit proliferation of T47D human breast cancer cells. Biochem Biophys Res Commun 202:1413–1419.
- Latonen, L., Kurki, S., Pitkanen, K. and Laiho, M. (2003) p53 and MDM2 are regulated by PI-3-kinases on multiple levels under stress induced by UV radiation and proteasome dysfunction. Cell Signal 15:95–102.
- LaVallee, T.M., Zhan, X.H., Herbstritt, C.J., Kough, E.C., Green, S.J. and Pribluda, V.S. (2002) 2-Methoxyestradiol inhibits proliferation and induces apoptosis independently of estrogen receptors alpha and beta. Cancer Res 62:3691–3697.
- Lee, L.F., Li, G., Templeton, D.J. and Ting, J.P. (1998) Paclitaxel (Taxol)-induced gene expression and cell death are both mediated by the activation of c-Jun NH2-terminal kinase (JNK/SAPK). J Biol Chem 273:28253–28260.
- Liu, Z.J., Lee, W.J. and Zhu, B.T. (2005) Selective insensitivity of ZR-75-1 human breast cancer cells to 2-methoxyestradiol: evidence for type II 17beta-hydroxysteroid dehydrogenase as the underlying cause. Cancer Res 65:5802–5811.
- Liu, Z.J. and Zhu, B.T. (2004) Concentration-dependent mitogenic and antiproliferative actions of 2-methoxyestradiol in estrogen receptor-positive human breast cancer cells. J Steroid Biochem Mol Biol 88:265–275.
- Lottering, M.L., Haag, M. and Seegers, J.C. (1992) Effects of 17 beta-estradiol metabolites on cell cycle events in MCF-7 cells. Cancer Res 52:5926–5932.
- Mabjeesh, N.J., Escuin, D., LaVallee, T.M., Pribluda, V.S., Swartz, G.M., Johnson, M.S., (2003) 2ME2 inhibits tumor growth and angiogenesis by disrupting microtubules and dysregulating HIF. Cancer Cell 3:363–375.
- Maggi, L.B. Jr. and Weber, J.D. (2005) Nucleolar adaptation in human cancer. Cancer investigation 23:599–608.
- Mannisto, P.T. and Kaakkola, S. (1999) Catechol-O-methyltransferase (COMT): biochemistry, molecular biology, pharmacology, and clinical efficacy of the new selective COMT inhibitors. Pharmacol Rev 51:593–628.
- Martin, M.B., Angeloni, S.V., Garcia-Morales, P., Sholler, P.F., Castro-Galache, M.D., Ferragut, J.A., (2004) Regulation of estrogen receptor-alpha expression in MCF-7 cells by taxol. J Endocrinol 180:487–496.
- Miglietta, A., Panno, M.L., Bozzo, F., Gabriel, L. and Bocca, C. (2004) Insulin can modulate MCF-7 cell response to paclitaxel. Cancer Lett 209:139–145.
- Milne, D.M., Campbell, L.E., Campbell, D.G. and Meek, D.W. (1995) p53 is phosphorylated in vitro and in vivo by an ultraviolet radiation-induced protein kinase characteristic of the c-Jun kinase, JNK1. J Biol Chem 270:5511–5518.
- Miyashita, T. and Reed, J.C. (1995) Tumor suppressor p53 is a direct transcriptional activator of the human bax gene. Cell 80:293–299.
- Moudgil, V.K., Dinda, S., Khattree, N., Jhanwar, S., Alban, P. and Hurd, C. (2001) Hormonal regulation of tumor suppressor proteins in breast cancer cells. J Steroid Biochem Mol Biol 76:105–117.
- Mueck, A.O. and Seeger, H. (2010) 2-Methoxyestradiol–Biology and mechanism of action. Steroids 75:625–631.
- Mukhopadhyay, T. and Roth, J.A. (1997) Induction of apoptosis in human lung cancer cells after wild-type p53 activation by methoxyestradiol. Oncogene 14:379–384.
- Nandi, S., Guzman, R.C. and Yang, J. (1995) Hormones and mammary carcinogenesis in mice, rats, and humans: a unifying hypothesis. Proc Natl Acad Sci USA 92:3650–3657.
- Nigro, J.M., Baker, S.J., Preisinger, A.C., Jessup, J.M., Hostetter, R., Cleary, K., (1989) Mutations in the p53 gene occur in diverse human tumour types. Nature 342:705–708.
- Noguchi, K., Kitanaka, C., Yamana, H., Kokubu, A., Mochizuki, T. and Kuchino, Y. (1999) Regulation of c-Myc through phosphorylation at Ser-62 and Ser-71 by c-Jun N-terminal kinase. J Biol Chem 274:32580–32587.
- Pokrovskaja, K., Mattsson, K., Kashuba, E., Klein, G., and Szekely, L. (2001) Proteasome inhibitor induces nucleolar translocation of Epstein-Barr virus-encoded EBNA-5. J Gen Virol 82:345–358.
- Pribluda, V.S., Gubish, E.R., Jr., Lavallee, T.M., Treston, A., Swartz, G.M. and Green, S.J. (2000) 2-Methoxyestradiol: an endogenous antiangiogenic and antiproliferative drug candidate. Cancer Metastasis Rev 19:173–179.
- Riley, T., Sontag, E., Chen, P. and Levine, A. (2008) Transcriptional control of human pp53–regulated genes. Nat Rev Mol Cell Biol 9:402–412.
- Rubbi, C.P. and Milner, J. (2000) Non-activated p53 co-localizes with sites of transcription within both the nucleoplasm and the nucleolus. Oncogene 19:85–96.
- Seegers, J.C., Aveling, M.L., Van Aswegen, C.H., Cross, M., Koch, F. and Joubert, W.S. (1989) The cytotoxic effects of estradiol-17 beta, catecholestradiols and methoxyestradiols on dividing MCF-7 and HeLa cells. J Steroid Biochem 32:797–809.
- Seegers, J.C., Lottering, M.L., Grobler, C.J., van Papendorp, D.H., Habbersett, R.C., Shou, Y., (1997) The mammalian metabolite, 2-methoxyestradiol, affects P53 levels and apoptosis induction in transformed cells but not in normal cells. J Steroid Biochem Mol Biol 62:253–267.
- Shimada, K., Nakamura, M., Ishida, E., Kishi, M. and Konishi, N. (2003) Roles of p38- and c-jun NH2-terminal kinase-mediated pathways in 2-methoxyestradiol-induced p53 induction and apoptosis. Carcinogenesis 24:1067–1075.
- Van Zijl, C., Lottering, M.L., Steffens, F. and Joubert, A. (2008) In vitro effects of 2-methoxyestradiol on MCF-12A and MCF-7 cell growth, morphology and mitotic spindle formation. Cell Biochem Funct 26:632–642.
- Vijayanathan, V., Venkiteswaran, S., Nair, S.K., Verma, A., Thomas, T.J., Zhu, B.T., (2006) Physiologic levels of 2-methoxyestradiol interfere with nongenomic signaling of 17beta-estradiol in human breast cancer cells. Clin Cancer Res 12:2038–2048.
- Vogelstein, B., Lane, D. and Levine, A.J. (2000) Surfing the p53 network. Nature 408:307–310.
- Wesierska-Gadek, J., Schloffer, D., Kotala, V. and Horky, M. (2002) Escape of p53 protein from E6-mediated degradation in HeLa cells after cisplatin therapy. Int J Cancer 101:128–136.