Abstract
Different semen storage and sperm purification methods may affect the integrity of isolated spermatozoal RNA. RNA-Seq was applied to determine whether semen storage methods (pelleted vs. liquefied) and somatic cell lysis buffer (SCLB) vs. PureSperm (PS) purification methods affect the quantity and quality of sperm RNA. The results indicate that the method of semen storage does not markedly impact RNA profiling whereas the choice of purification can yield significant differences. RNA-Seq showed that the majority of mitochondrial and mid-piece associated transcripts were lost after SCLB purification, which indicated that the mid-piece of spermatozoa may have been compromised. In addition, the number of stable transcript pairs from SCLB-samples was less than that from the PS samples. This study supports the view that PS purification better maintains the integrity of spermatozoal RNAs.
Introduction
Over the past decade, several groups have independently provided compelling evidence that the transcriptionally and translationally inert mature spermatozoon contain a complex population of RNAs [Carreau et al. Citation2007; Dadoune Citation2009; Fischer et al. Citation2012; Galeraud-Denis et al. Citation2007; Hamatani Citation2012; Krawetz Citation2005; Ostermeier et al. Citation2002; Ostermeier et al. Citation2005a; Ostermeier et al. Citation2005b; Pessot et al. Citation1989]. The functions of the majority of sperm RNAs remain enigmatic although their use in early embryonic development has been proposed [Krawetz Citation2005]. Many approaches (microarrays, RNA-Seq, RT-PCR) have been applied to identify the potential functions of transcripts retained in sperm [Card et al. Citation2013; Carreau, et al. Citation2007; Jodar et al. Citation2012; Lima-Souza et al. Citation2012; Platts et al. Citation2007; Yang et al. Citation2009]. Success using these technologies is dependent on the quality of the RNA obtained. Each step from ejaculation to sperm RNA isolation may affect the quality of isolated RNA.
After ejaculation, the semen sample is allowed to liquefy at room temperature. Once liquefied, the sample is typically processed in one of two ways: simply frozen in a Tyrodes buffer or pelleted through a gradient then frozen in Tyrodes buffer. In some species, either storage method can be applied. But in many species, centrifugation is necessary to concentrate the spermatozoa, to remove the seminal plasma or other contaminants. The effectiveness of three different centrifugation methods has been tested using brown bear sperm [Nicolas et al. Citation2012]. Compared with the use of dense isotonic cushion solutions, a density gradient prepared with PureSperm, a clinical-grade reagent used for separating/purifying sperm, improves the quality of spermatozoa.
The removal of somatic cells must be considered to ensure the purity of the sperm RNA as somatic cells could contribute a substantial proportion to the isolated RNAs. Somatic cell lysis buffer (SCLB) which contains both SDS and Triton (x-100) has been widely used for sperm cell purification [Aronesty 2011; Goodrich et al. Citation2007; Ostermeier et al. Citation2005a; Ostermeier et al. Citation2005b; Platts et al. Citation2007]. This method has proven effective in leaving the most robust sperm cells intact but also tends to solubilize sperm-membrane structures. Another broadly accepted method used to purify sperm cells away from other contaminants is by gradient centrifugation using Percoll or clinical-grade reagents like PureSperm, an isotonic salt solution containing silane-coated silica particles [Fourie et al. Citation2012; Johnson et al. Citation2011; Nicolas, et al. Citation2012; Ostermeier, et al. Citation2002]. In this case, a density gradient is used to separate the sperm cells from the larger and less dense somatic cells during centrifugation.
These semen storage and sperm purification methods may damage spermatozoa which could affect the integrity of isolated RNA. The damage may accumulate at each step, such that a series of small effects may radically alter the ensuing transcript profile. However, purification and storage protocols have never been directly assessed together for their ability to provide a suitable template for RNA-Seq.
In the present study, mature human spermatozoa samples from fertile males were used to investigate the qualitative and quantitative effects of the various semen storage methods and sperm cell purification methods on sperm transcript profiling. It should be pointed out that the semen preparation and storage methods used in the study are strictly for research purposes only. They do not comply with current WHO recommendations as set out in the 2010 manual [WHO 2010].
Results and Discussion
The sample processing and analysis workflow from initial sample storage to the final data analysis and comparison is summarized in . A total of eight sperm samples collected from four subjects were classified as either pelleted storage (P) or liquefied storage (L). P denotes that the sample was liquefied and pelleted by centrifugation before it was frozen in Tyrodes buffer. Cells from each sample were counted prior to purification and the initial cell counts are summarized in Supplemental . Each sample was then divided into two equal aliquots. To compare two purification methods the first aliquot was subjected to PureSperm gradient centrifugation (PS) while the second was subjected to somatic cell lysis buffer (SCLB) purification. Cell recovery following PS or SCLB is summarized in .
Figure 1. Flow diagram of sperm sample processing. Semen samples were classified as liquefied storage (L) or pelleted storage (P); for each storage, the samples were divided into two aliquots after initial cell counting and purified by either PureSperm (PS) or somatic cell lysis buffer (SCLB) methods. Final cell count determined the cell loss after purification; equal amount of cells were used as cell input for RNA isolation. Next, equal amount isolated RNA from each sample was applied as input for RNA-Seq library preparation; the libraries were deep sequenced for 50 cycles paired-end; the sequencing reads were demultiplexed, and short reads were aligned to human reference genome. Finally the alignment results were analyzed. The effect of sample storage and sperm purification methods to RNA profiling was evaluated.
Table 1. Cell recovery and yield of RNA from PS and SCLB purification methods.
Table S1. The number of sperm from each sample (in million cells)
Cell loss is expected following any storage or purification procedure. We observed that the average recovery rate in PS purified samples was 63.2%, whereas in SCLB samples, the average recovery rate was 89.4%. This result indicates that SCLB purification recovered more sperm cells than PS centrifugation (P(cell recovery rate) = 0.003, paired student's t-test). Comparing the two storage methods (L vs. P), it showed that on average both the PS and SCLB purification methods yielded a higher recovery rate from liquefied fraction (L) than that from pelleted sperm fraction (P), but the difference was not statistically significant (P = 0.08).
The yield of RNA (ng / 106 cells) cells is summarized in . Although cell recovery is higher using SCLB, the yield of RNA from one million of sperm is statistically less than that obtained using PS purification(P(yield of RNA) = 0.023 paired student's t-test). The average yield from the SCLB purified samples was 20.3 ± 9.1 ng / 106 cells and in the PS group, was 51.6 ± 27.8 ng / 106 cells. The total yield of RNA in the PS samples was 4,089.8 ± 2,285.8 ng on average, and in SCLB samples, was 2,289.3 ± 1,041.0 ng. Though the total yielded RNA was higher in the PS group than in the SCLB group, it was not significant (P = 0.09). In comparison, the different semen storage methods (liquefied vs. pelleted) did not influence the average yield of RNA (ng / 106 cells) (P = 0.31), nor the total yield of RNA (ng) (P = 0.44).
RNA purification and quality assessment
A real time-PCR assay was employed to assess DNA contamination using the primer pair spanning the PRM1 intron (Forward 5'-CAGAGCCGGAGCAGATATTAC-3', Reverse 5'-ATTTATTGACAGGCGGCATTGTT-3'). The results are shown in Supplemental . As indicated in panel A, only the positive controls (human genomic DNA templates) could be amplified, indicative of the lack of DNA in the isolated RNA samples. To assess RNA integrity, all RNA samples were subjected to cDNA synthesis by reverse transcription followed by real time-PCR analysis using the intron spanning PRM1 primers as above. As summarized in Supplemental , panel B, PRM1 mRNA was recovered and the samples were of sufficient quality to warrant sequencing.
RNA-seq
Sixteen sequencing libraries were prepared using a NuGEN Ovation/Encore library preparation kit as described [Sendler et al. Citation2013] and RNAs were deep sequenced using HiSeq 2000. The short sequencing reads for each set of four samples were aligned to the human reference genome, build hg19 using novoalign. The RNA-Seq statistics are summarized in Supplemental . The average number of sequence reads from each storage/purification method is: P-SCLB, 15.9 ± 1.5M; L-SCLB, 25.1 ± 11.4M; P-PS, 28.3 ± 3.3M and L-PS, 29.1 ± 4.6M. A greater number of sequence reads were obtained from the samples prepared using PureSperm compared with SCLB though the difference is not significant (P = 0.07, paired student's t-test). The average number of aligned SCLB sequence reads was 18 million whereas 27 million sequence reads were aligned from the PS samples (P = 0.04, paired student's t-test). The majority of sequence reads that did not map back to the genome were of low quality (fail of QC) or no alignment match (NM). The size of each RNA fragment was inferred based on the separation of each paired end sequence read. The distribution of RNA fragments did not differ between the sample storage methods (P vs. L). However, between SCLB and PS, the difference was significant (P = 0.002, paired student's t-test). The fragment size was 85 ∼ 96 bp for samples prepared using SCLB; whereas in PS, the fragment size was 103 ∼ 111 bp. The distribution of the fragments within each library from 16 samples is shown in .
Figure 2. Distribution of RNA-seq fragment sizes of 16 samples. Fragment sizes for each paired-end sequencing library were inferred from the separation of read pairs, which were mapped to the human reference genome using novoalign. It is clear that the average RNA fragments from samples purified by Pure Sperm (Blue and Green) is longer than that from SCLB (Red and Orange). P: pelleted storage; L: liquefied storage; PS: PureSperm purification; SCLB: somatic cell lysis buffer purification.
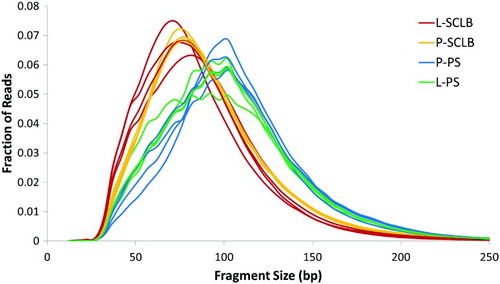
Table S2. RNA-seq statistics summary
Sequence reads mapping to ribosomal RNA (rRNA)
In human sperm approximately 80% of short sequence reads from a total RNA library map to ribosomal RNA [Johnson et al. Citation2011]. The NuGEN library preparation method efficiently removed the majority of the rRNA with only a small fraction of rRNA remaining. This has reduced the level of ribosomal RNA by approximately 3-fold compared with the results presented in Johnson et al. [2011]. Using SCLB approximately 25.4 ± 12.8% of the sequence reads mapped to rRNA compared with an average of 9.8 ± 4.0% from the PS prepared samples. The difference was significant (P = 0.004, paired student's t-test) between them.
Mitochondria provide the energy generator to propel the sperm to the oocyte [Sousa et al. Citation2011]. The number of sequence reads and the percentage of sequence reads that mapped to mitochondria were dramatically different between the PS and SCLB methods (). On average, 2% of the total sequence reads prepared from the SCLB samples, i.e., 0.4 million, mapped to the mitochondrial genome. In comparison, nearly 60% of the sequence reads from the PS samples, i.e., 13.9 million, mapped to mitochondria. This represents a ∼30-fold difference in the number of mitochondrial sequence reads. This is consistent with the preferential loss of mtRNAs as compared to that prepared by PS even though mitochondria provide energy for the sperm's movement. Although the cell yields were higher using SCLB, the yield of RNA was lower. The number of short sequence reads mapping to mitochondrial RNA in the SCLB samples was dramatically less and the size distribution of the corresponding sequencing libraries was shorter (; Supplemental ) than that in the PS samples. The distribution of sequence reads on the mitochondrial genome is shown in Supplemental . Among the sequence reads that mapped to mitochondria, more than 89% belong to 12S or 16S rRNA. The distribution of mitochondrial sequence reads within the mitochondrial genome did not differ significantly between the different methods of semen storage or purification.
Table 2. Reads mapped to mitochondria genome and 12S, 16S rRNA.
If the sequence reads that aligned to the mitochondrial genome were excluded, there is no marked difference between the number of reads from PS samples and SCLB samples (). That is, the number of sequence reads that uniquely mapped to human chromosomes is similar between PS samples and SCLB samples. This indicates that the sequencing depth in terms of human chromosomes is similar between PS samples and SCLB samples.
The SCLB method employs 0.1% SDS, 0.5% Triton (x-100) to lyse somatic cells. However, effective, SCLB may damage the sperm cell membrane (lack of tail movement) or remove other constituents attached to the membrane affecting membrane permeability. Together with the above this suggests that during SCLB purification, the mid-piece may be compromised and the majority of mitochondria lost yet their sequence was content preserved.
Transcript levels as a function of semen storage and sperm purification methods
Unsupervised hierarchical clustering of all transcripts was used to assess the consistency of the four storage/purification combination methods. The transcript profile of sperm is characterized by a few high abundance genes e.g., PRM1, PRM2, that have a greater number of fragments per kilobase of exon per million fragments mapped (FPKM) value than the majority. This small group can skew the correlation coefficient. To minimize this effect the FPKM values were log2– transformed after a value of 1 was added to each of the FPKM values to avoid log 0. The results are summarized in . It is clear that the methods of semen storage and sperm purification affect the transcript profile. In all four subjects, methods L-PS and P-PS have a relatively higher correlation coefficient. It is notable that there is a lack of consistency between L-SCLB compared to the other methods. Sample variation also affects the transcript profile. Unsupervised hierarchical clustering of all transcripts is shown in Supplemental . In all four storage/purification methods, the samples from subject 2 and 4 have a relatively higher correlation coefficient. This is consistent with the results summarized in , in which the Pearson correlation coefficient (Pcc) of four methods in subjects 2 and 4 (S2 and S4) is higher (cc > 80%) than that in subjects 1 and 3 (cc < 80%).
Figure 3. Unsupervised clustering of the four storage / purifcation methods. In each sample, the transcript profile generated from four methods were clustered. The Y-axis is the 1 - Pearson correlation coefficient. S1 ∼ S4: samples from four subjects; P: pelleted storage; L: liquefied storage; PS: PureSperm purification; SCLB: somatic cell lysis buffer purification.
Stable transcript pairs
The four normal fertile donor sperm samples provided a suite of biological replicates. For any transcript, its expression value may vary across these samples due to environmental factors. However, for any two transcripts, their expression levels may change in a coherent manner across these individuals. That is, the expression values of the two transcripts may be different in biological replicates, but the ratio of the expression value between these two transcripts in each sample is consistent. We define such two transcripts as a stable transcript pair. Different criteria have been applied to identify stable transcript pairs based on how consistent their expression ratio is. These have included the Pearson correlation coefficient (Pcc) [Sousa et al. Citation2011] and the coefficient of variation (CofV) [Platts et al. Citation2010]. Stable transcript pairs may show a consistent response to one specific biological process and function. Ideally the number of stable transcript pairs from the same set of samples, different storage/purification combination methods should be equal. If any method modifies the transcript profile, the number of stable transcript pairs from that method should change.
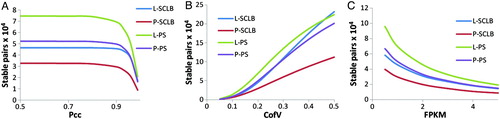
The number of stable transcript pairs from each storage/purification method was calculated. To determine whether two transcripts are stable, we have extended the defining concept of the stable transcript pair by expanding the criteria to include Pcc, Scc, CofV, and FPKM. The FPKM values were calculated by excluding the short reads that mapped to mitochondrial sequences. Every criterion was calculated based on the pairwise FPKM at every biological replicate. shows the number of stable transcript pairs defined as a function of stringency. As shown in A, as Pcc increases, i.e., the criterion becomes more stringent, the number of stable pairs deceases. Comparing the four storage/purification methods, the number of stable pairs in PS is greater than that in the SCLB method. Similarly, the number of stable pairs in the L sample is greater than in the P sample under each Pcc value (from 0.5 to 1) as observed for the CofV and FPKM (B and C). The number of stable pairs contained within the PS group is larger than that in SCLB group no matter which combinations of criteria were applied. Independent of the criterion used to identify stable pairs, we can obtain more stable pairs from the L-PS purified samples. This also indicates L-PS method may be the best method to ensure the integrity of sperm transcript profile (). As summarized in Supplemental , it is interesting to note that similar results were obtained when investigating the reads that aligned to the human mitochondrial genomes.
Figure 4. Number of stable transcript pairs as a function of different criteria combination. The Y-axis is the number of stable transcript pairs obtained. In Panel A, the X-axis is Pearson correlation coefficient (Pcc); in Panel B, the X-axis is Coefficient of Variation (CofV); in Panel C, the X-axis is FPKM (fragments per kilobase of exon per million fragments mapped) values. A stable pair also needs to satisfy the following criteria: In panel A, CofV ≤ 0.2, FPKM ≥ 1; in panel B, Pcc ≥ 0.9, FPKM ≥ 1; and in panel C, Pcc ≥ 0.9, CofV ≤ 0.2. The Spearman correlation coefficient = 1 for the stable pairs in all three panels.
Preferentially isolated transcripts
The question then arose: did the different storage/purification methods significantly affect the relative FPKM values? Because of the variations in biological replicates, we compared the FPKM values within the samples from the same donor but prepared using the different methods. Only the FPKM values from the same donor sample, but different storage/purification methods were compared. If the fold change for any gene, between the two methods was larger than or equal to 2, that gene was noted as significantly preferentially isolated and if replicated in all samples then it was a method-specific preferentially isolated transcript. By comparing PS and SCLB methods, we detected a total of 19 significant preferentially isolated transcripts. The gene symbol, gene name, and their average log2 (fold change) values are summarized in . Interestingly, these transcripts were more abundant in the sperm samples prepared by PS than prepared by SCLB. Among these 19 transcripts, many were identified as nuclear encoded ribosomal (5 transcripts), mitochondrial encoded ribosomal (6 transcripts), or LocusLink locations (LOCs; 3 transcripts). The high number of PS sample sequence reads from the seven exon RPS4X gene transcript were distributed at almost each exon. Comparatively, the total number of SCLB sequence reads was far less and void in many exons (). No transcripts were preferentially isolated when the profiles from the L and P storage methods were compared.
Figure 5. The distribution of reads mapping to gene RPS4X, which was generated from UCSC genome browser by uploading the corresponding short read positions. The blue arrow indicates the transcript 5' to 3' orientation. In Gene RPS4X, the thicker rectangles indicate the exons, the thinner rectangles at two ends indicate 5' UTR and 3' UTR. The number of reads corresponding to each base position is represented on the vertical axis. S1 ∼ S4: samples from four subjects; P: pelleted storage; L: liquefied storage; PS: PureSperm purification; SCLB: somatic cell lysis buffer purification
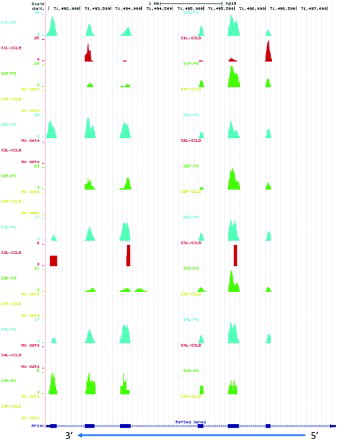
Figure S1. PCR assessment of DNA contamination and RNA integrity. A. Isolated RNAs and two human genomic cDNA samples were used as template. B. The synthesized cDNAs were used as template. The primer pair spans the PRM1 intron. S1∼S4 are the samples from four subjects; ‘P’ denotes pelleted storage. ‘L’ denotes liquefied storage; PS denotes PureSperm purification and SCLB is somatic cell lysis buffer purification; HG denotes human genome DNA; Ctrl denotes negative control.
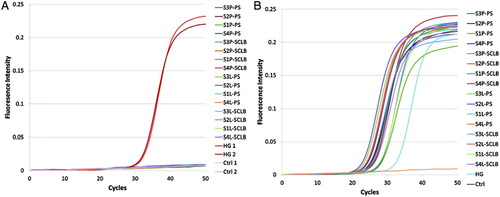
Figure S2. Distribution of reads mapped to mitochondrial genome. The scale for each sample is based on the maximum read count with the displayed region. In the mitochondrial genome, the coordinate of 12S rRNA is 648 – 1,601 and 16S rRNA is 1,671 – 3,229. S1∼S4 are the samples from four subjects; ‘P’ denotes pelleted storage. ‘L’ denotes liquefied storage; PS denotes PureSperm purification and SCLB is somatic cell lysis buffer purification.
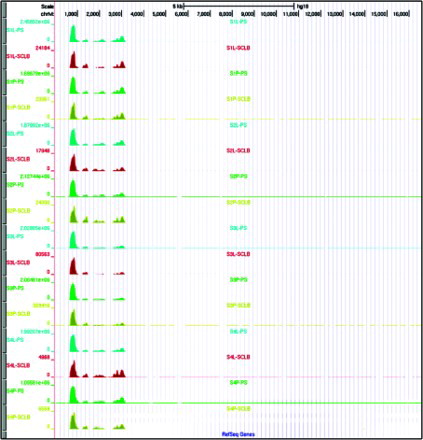
Figure S3. Unsupervised clustering by subjects. In each method, the transcript profile generated from four subjects were clustered. The Y-axis is the 1 - Pearson correlation coefficient. Panel A indicates SCLB purification from liquefied storage (L) samples; Panel B indicates SCLB purification from pelleted storage (P) samples; Panel C indicates PureSperm purification from liquefied storage (L) samples; and Panel D indicate PureSperm purification from pelleted storage (P) samples.
Figure S4. Number of stable transcript pairs as a function of different criteria. The short reads uniquely aligned to reference genome without mitochondrial sequence were used as input to calculate each gene's FPKM values. The Y-axis is the number of stable transcript pairs. The X-axis is: Pcc in panel A, Cofv in panel B; and FPKM in panel C. The other criteria are also required for stable transcripts identification: In panel A, CofV≤0.2, FPKM≥1; in panel B, Pcc≥0.9, FPKM≥1; in panel C, Pcc≥0.9, CofV≤0.2. The Spearman correlation coefficient=1 for the stable pairs in all three panels.
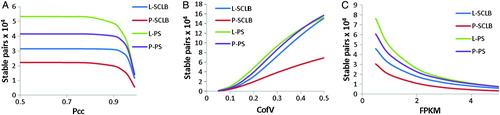
Table 3. Preferentially isolated genes in PS groups over SCLB groups.
Cellular RNA purity by PureSperm and somatic cell lysis buffer
It is critical not to compromise the preparation of RNA from sperm cells with other cell types since contaminating cells may contain a far greater proportion of RNA [Ostermeier et al. Citation2002]. Previous data has shown that SCLB effectively minimizes somatic cell contamination [Ostermeier et al. Citation2002]. The SCLB and PS purification methods were assessed using the following markers: SEMG1, SEMG2, MSMB, PIP (transcripts encoding proteins secreted by the epididymis and the prostate/seminal vesicles), CD34, CD45 (white blood cell marker transcripts), CDH1 (epithelial cells transcript), and KIT (immature germ cell transcript). The FPKM values for each of these transcripts are summarized in . Using the threshold criterion of FPKM ≥ 5, only SEMG2 was present in all samples while SEMG1 was present in all PS samples. Relaxing the criterion to an FPKM ≥ 1 [Mao et al. Citation2012] suggests that SEMG1 is present in each PS sample; SEMG2 is present in every PS and SCLB samples and KIT is present in each SCLB sample and several PS samples. Interestingly, CD45 was also present in 10 of the 16 samples tested. The remaining genes were absent in most of the samples. The white blood cell marker transcripts (CD34), epithelial cell transcript (CDH1), and PIP were absent in most of the samples. This indicates that both purification methods have successfully removed the majority of these somatic cells. Interestingly the SEMG1, SEMG2, PIP, and CD45 transcripts were present in PS and/or SCLB samples. A total of 19 transcripts were preferentially isolated in the PS group, suggesting that these transcripts were removed or partially removed during SCLB purification. For example, perhaps the SEMG1 transcript is attached to the sperm membrane but efficiently removed during SCLB treatment and thus only measured in the PS samples. As suggested, perhaps sperm can also act as a carrier of exogenous RNAs [Spadafora Citation2008].
Table 4. FPKM values of markers in each sperm sample.
In this study, four sperm samples from normal fertile males were examined as biological replicates to investigate the effects of the combination of two different semen storage methods (P vs. L) and two purification methods (PS vs. SCLB). The effectiveness of each method was compared as a function of sperm cell recovery, the yield of isolated RNA, the average length of RNA fragments, the percentage sequence reads that mapped to the mitochondrial genome, the number of stable transcript pairs, and the number of preferentially isolated transcripts obtained from PS or SCLB. The results indicate that the method of semen storage does not markedly impact RNA profiling whereas the choice of purification can yield significant differences with PS proving more effective in providing a profile of spermatozoal RNAs.
Materials and Methods
Sample storage, purification, and RNA extraction
This study was approved by both Wayne State University and NIH. The semen samples were collected for LIFE study by National Institute of Health (NIH). A total of eight samples were collected from four subjects. Study subjects provided two semen samples approximately one month apart. The specimens were collected by masturbation directly into a glass jar. The men then placed the jar into a shipping container with an ice pack. The sample was sent to the National Institute for Occupational Safety and Health (NIOSH) laboratory where semen analyses were conducted. After aliquots were removed for semen analysis the remaining portion of the first sample was centrifuged (100 x g). The seminal plasma was poured into a cytotube, the sperm was re-suspended in 1.0 ml of Tyrode's buffer (Sigma Chemical, St. Louis, MO, USA), and both were frozen (-75oC) for future analyses. The remaining portion of the second sample was frozen as neat semen (-75oC) for future analyses. After initial cell counting, each semen sample was equally divided and yielded a total of eight samples from the pellet fraction, and eight samples from the liquefied fraction. To remove the majority of contaminating cells samples were then subjected to enrichment by either PS gradient centrifugation through a 50% PS cushion (Nidacon International, MöIndal, Sweden) or SCLB composed of 0.1% SDS with 0.5% Triton (x-100) [Goodrich et al. Citation2007]. RNA was isolated using the sperm RNA isolation protocol as previously described [Goodrich 2013]. In brief, total RNA were isolated from each sample using a bead-based homogenization Qiazol protocol that we have specifically developed to release cellular contents of sperm. RNA was subsequently purified from the resulting homogenate using an automated QiaCube extraction protocol specifically developed for the isolation of sperm RNAs [Goodrich et al. Citation2013]. Total RNA samples were treated with turbo-DNA Free (Ambion Inc., Austin, TX, USA) to remove residual DNA. The quality of isolated RNA is assessed by RT PCR using primer pair spanning the PRM1 intron as we have previously detailed [Goodrich et al. Citation2007].
RNA library preparation and sequencing
The RNA-Seq libraries for each sperm sample were prepared in two stages using the NuGEN Ovation kit (NuGEN Inc., San Carlos, CA) for cDNA synthesis and amplification plus the NuGEN Encore system for library preparation. First, the cDNA samples were subject to single primer isothermal amplification (SPIA) prior to sequencing library preparation. In brief, 20ng of total RNA was subject to reverse-transcription. The cDNA synthesis used oligo dT and random hexamer primers followed by isothermal amplification (SPIA). Next, a total of 200ng of amplified cDNA was used as input for library preparation. The cDNA was then fragmented by covaris sonicator and the fragment ends were repaired. The Illumina compatible PE adaptors with inline barcodes were ligated onto the cDNA products followed by 15 cycles of PCR enrichment.
All samples were subjected to paired-end sequencing using the Illumina HiSeq 2000 for 50 cycles. Image analysis, base calling, and FASTQ generation were performed using the genome analyzer pipeline software CASAVA (version 1.8.2). Inline demultiplexing was performed using software fastq_multx [Aronesty 2011].
Short read mapping and transcript abundance estimating
Sequencing reads were mapped to hg19 of the human reference genome plus human ribosomal 5S, 18S, and 28S sequences using Novoalign (Novocraft Technologies v.2.08, Selangor, Malaysia) paired-end base default parameters. Alignment results were confirmed independently using Genomatix Mining Station (Sesame 2.1) (Genomatix, Munich, Germany).The relative abundance of each transcript was calculated using Genomatix software (www.genomatix.de) and presented as FPKM. The RNA-Seq data have been deposited in the National Center for Biotechnology Information's (NCBI) Gene Expression Omnibus (GEO) (GSE43586).
Abbreviations
| PS: | = | PureSperm |
| SCLB: | = | somatic cell lysis buffer |
| L: | = | liquefied |
| P: | = | pelleted |
| M: | = | million |
| Pcc: | = | Pearson correlation coefficient |
| Scc: | = | Spearman correlation coefficient |
| CofV: | = | coefficient of variation |
| FPKM: | = | fragments per kilobase of exon per million fragments mapped |
| P: | = | p-value. |
Supplementary Material
Download PDF (298.7 KB)Acknowledgments
We are grateful to Meritxell Jodar and Selvaraju Sellappan for their review of the manuscript.
Declaration of interest: The authors declare no conflicts of interest. This work was supported in part by the Charlotte B. Failing Professorship to SAK, a GENI pilot grant to SAK and RH from Harvard School of Public Health; National Institute of Environmental Health Sciences (Grant Number ES017285) to RH and SAK and in part by the Intramural Research Program of the Eunice Kennedy Shriver National Institute of Child Health and Human Development Contract 25PM6 in collaboration with the LIFE Study Working Group, Division of Epidemiology, Statistics, and Prevention Research who provided semen samples for analysis.
Disclaimers: Mention of company names and/or products does not constitute endorsement by the National Institute for Occupational Safety and Health. The findings and conclusions in this report are those of the authors and do not necessarily represent the views of the National Institute for Occupational Safety and Health.
Author contributions: Analyzed the data and wrote the manuscript: SM; Prepared libraries for RNA-Seq and reviewed the manuscript: RJG; Reviewed and edited the manuscript: RH; Collected samples and designed the experiment: SS; Reviewed the manuscript and accomplished the statistical analysis of the data and: ZC; Oversaw the project and edited the manuscript: SAK.
References
- Aronesty, E. (2011) ea-utils : “Command-line tools for processing biological sequencing data”. http://code.google.com/p/ea-utils
- Card, C., Anderson, E.J., Zamberlan, S., Krieger, K.B., Kaproth, M. and Sartini, B.L. (2013) Cryopreserved Bovine Spermatozoal Transcript Profile as Revealed by High-Throughput Ribonucleic Acid Sequencing. Biol Reprod 88:49.
- Carreau, S., Lambard, S., Said, L., Saad, A. and Galeraud-Denis, I. (2007) RNA dynamics of fertile and infertile spermatozoa. Biochem Soc Trans 35:634–636.
- Dadoune, J.P. (2009) Spermatozoal RNAs: what about their functions? Microsc Res Tech 72:536–551.
- Fischer, B.E., Wasbrough, E., Meadows, L.A., Randlet, O., Dorus, S., Karr, T.L., (2012) Conserved properties of Drosophila and human spermatozoal mRNA repertoires. Proc Biol Sci 279:2636–2644.
- Fourie, J., Loskutoff, N. and Huyser, C. (2012) Treatment of human sperm with serine protease during density gradient centrifugation. J Assist Reprod Genet 29:1273–1279.
- Galeraud-Denis, I., Lambard, S. and Carreau, S. (2007) Relationship between chromatin organization, mRNAs profile and human male gamete quality. Asian J Androl 9:587–592.
- Goodrich, R., Johnson, G. and Krawetz, S.A. (2007) The preparation of human spermatozoal RNA for clinical analysis. Arch Androl 53:161–167.
- Goodrich, R.J., Anton, E. and Krawetz, S.A. (2013) Isolating mRNA and small noncoding RNAs from human sperm. Methods Mol Biol 927:385–396.
- Hamatani, T. (2012) Human spermatozoal RNAs. Fertil Steril 97:275–281.
- Jodar, M., Kalko, S., Castillo, J., Ballesca, J.L. and Oliva, R. (2012) Differential RNAs in the sperm cells of asthenozoospermic patients. Hum Reprod 27:1431–1438.
- Johnson, G.D., Sendler, E., Lalancette, C., Hauser, R., Diamond, M.P. and Krawetz, S.A. (2011) Cleavage of rRNA ensures translational cessation in sperm at fertilization. Mol Hum Reprod 17:721–726.
- Krawetz, S.A. (2005) Paternal contribution: new insights and future challenges. Nat Rev Genet 6:633–642.
- Lima-Souza, A., Anton, E., Mao, S., Ho, W.J. and Krawetz, S.A. (2012) A platform for evaluating sperm RNA biomarkers: dysplasia of the fibrous sheath–testing the concept. Fertil Steril 97:1061–1066 e1061–1063.
- Mao, S., Souza, A.L., Goodrich, R.J. and Krawetz, S.A. (2012) Identification of artifactual microarray probe signals constantly present in multiple sample types. Biotechniques 53:91–98.
- Nicolas, M., Alvarez, M., Borragan, S., Martinez-Pastor, F., Chamorro, C.A., Alvarez-Rodriguez, M., (2012) Evaluation of the qualitative and quantitative effectiveness of three media of centrifugation (Maxifreeze, Cushion Fluid Equine, and PureSperm 100) in preparation of fresh or frozen-thawed brown bear spermatozoa. Theriogenology 77:1119–1128.
- Ostermeier, G.C., Dix, D.J., Miller, D., Khatri, P. and Krawetz, S.A. (2002) Spermatozoal RNA profiles of normal fertile men. Lancet 360:772–777.
- Ostermeier, G.C., Goodrich, R.J., Diamond, M.P., Dix, D.J. and Krawetz, S.A. (2005a) Toward using stable spermatozoal RNAs for prognostic assessment of male factor fertility. Fertil Steril 83:1687–1694.
- Ostermeier, G.C., Goodrich, R.J., Moldenhauer, J.S., Diamond, M.P. and Krawetz, S.A. (2005b) A suite of novel human spermatozoal RNAs. J Androl 26:70–74.
- Pessot, C.A., Brito, M., Figueroa, J., Concha, II, Yanez, A. and Burzio, L.O. (1989) Presence of RNA in the sperm nucleus. Biochem Biophys Res Commun 158:272–278.
- Platts, A.E., Dix, D.J., Chemes, H.E., Thompson, K.E., Goodrich, R., Rockett, J.C., (2007) Success and failure in human spermatogenesis as revealed by teratozoospermic RNAs. Hum Mol Genet 16:763–773.
- Platts, A.E., Lalancette, C., Emery, B.R., Carrell, D.T. and Krawetz, S.A. (2010) Disease progression and solid tumor survival: a transcriptome decoherence model. Mol Cell Probes 24:53–60.
- Sendler, E., Johnson, G.D., Mao, S., Goodrich, R.J., Diamond, M.P., Hauser, R., (2013) Stability, delivery and functions of human sperm RNAs at fertilization. Nucleic Acids Res 41:4104–4117.
- Sousa, A.P., Amaral, A., Baptista, M., Tavares, R., Caballero Campo, P., Caballero Peregrin, P., (2011) Not all sperm are equal: functional mitochondria characterize a subpopulation of human sperm with better fertilization potential. PLoS One 6:e18112.
- Spadafora, C. (2008) A reverse transcriptase-dependent mechanism plays central roles in fundamental biological processes. Syst Biol Reprod Med 54:11–21.
- WHO (2010) WHO Laboratory Manual for the Examination and Processing of Human Semen. 5th edition, World Health Organization, Switzerland.
- Yang, C.C., Lin, Y.S., Hsu, C.C., Wu, S.C., Lin, E.C. and Cheng, W.T. (2009) Identification and sequencing of remnant messenger RNAs found in domestic swine (Sus scrofa) fresh ejaculated spermatozoa. Anim Reprod Sci 113:143–155