Abstract
The objective of this study was to develop an oral formulation that would improve the solubility and oral absorption of sirolimus using a TPGS micellar solution. The effect of TPGS on the solubility and stability of sirolimus was evaluated. The sirolimus-loaded TPGS micelles were prepared using the thin-film hydration method. The average size of the sirolimus-loaded TPGS micelles was 11 nm. The concentration of sirolimus in a 50 mg/mL TPGS micellar solution was 0.97 ± 0.12 mg/mL, which demonstrates an enhancement of approximately 400-fold from the solubility of sirolimus in water. Furthermore, pharmacokinetic studies in rats indicated that the TPGS micellar solution significantly improved the oral absorption of sirolimus. Therefore, the preliminary results from this study suggest that a TPGS micellar solution has great potential for clinical applications.
Keywords::
Introduction
Rapamycin is a carboxylic lactone-lactam macrolide derived from Streptomyces hygroscopicus that has been shown to have potent immunosuppressive activity and to inhibit T-cell activation and proliferation (Vézina et al. Citation1975). Sirolimus is practically insoluble in water (2.6 μg/mL), has a high molecular weight (MW = 914 Da), and contains no functional groups that are ionizable within the pH range of 1–10 (Simamora et al. Citation2001). In addition, sirolimus is extremely hydrophobic. Among the many different formulations of sirolimus that have been examined, it has been reported that an oral solution, nanocrystals and a solid dispersion formulation are the most potent for the enhancement of the oral bioavailability of sirolimus (Strickley Citation2004, Junghanns and Muller Citation2008, Kim et al. Citation2011).
The inclusion of highly hydrophobic drugs into the hydrophilic core of polymeric micelles represents a very versatile nanotechnology approach that can be used to enhance the aqueous solubility of these drugs (Sosnik et al. Citation2008). Due to their nano-size and core-shell structure, polymeric micelles have also been developed as drug delivery systems for various agents in therapeutic and diagnostic applications (van Vlerken and Amiji Citation2006, Gaucher et al. Citation2010). The commercially used polymeric micelle-forming material is d-α-tocopheryl polyethylene glycol 1000 succinate (TPGS), which is synthesized through the grafting of the lipid-soluble antioxidant α-tocopherol (vitamin E) to a polyethylene glycol (PEG) oligomer via a succinate diester linker. Several studies have demonstrated that TPGS improves the oral absorption of vitamin E, cyclosporine, amprenavir and paclitaxel due to enhanced solubility, improved permeability, and reduced intestinal metabolism (Ismailos et al. Citation1994, Yu et al. Citation1999, Varma and Panchagnula Citation2005). Recently, it has been discovered that TPGS is a P-glycoprotein inhibitory excipient (Dintaman and Silverman Citation1999, Zhang et al. Citation2012). A remarkable advantage of TPGS over other experimental polymeric amphiphiles is the approval of the excipient by the FDA as a drug solubilizer in oral, parenteral, topical, nasal, and rectal/vaginal therapies (Varma and Panchagnula Citation2005, Constantinides et al. Citation2006).
One aim of this study was the development of an oral formulation with a 1 mg/mL concentration of sirolimus using a TPGS micellar solution. The effect of TPGS on the solubility and stability of sirolimus was therefore evaluated. The physicochemical properties and absorption properties of sirolimus-loaded TPGS micelles were also investigated.
Materials and methods
Materials
Sirolimus was obtained from Beijing Everbright Science & Trading Co. (Beijing, China; purity = 99.4%). D-α- Tocopheryl polyethylene glycol 1000 succinate (TPGS) was purchased from Eastman Co. (USA). Everolimus (purity = 95.9%) and zinc sulfate were purchased from Sigma-Aldrich (St. Louis, MO, USA). All of the organic solvents were of HPLC grade. All other chemicals were of reagent grade.
Effect of TPGS on the solubility of sirolimus
The effect of the TPGS concentration on the solubility of sirolimus was evaluated. The phase solubility analysis was performed by adding excess amounts (10 mg) of sirolimus to capped glass vials containing 2 mL of degassed water with different concentrations of TPGS. The samples were sonicated for 30 min at room temperature and then placed on a shaking water bath (60 rpm) at two different temperatures (25 and 37°C) for 3 days, which was previously determined to be an adequate time for the equilibration. At the end of this period, the entire volume (approximately 2 mL) of each sample was transferred to a clean tube and centrifuged at 15,000 rpm and 37°C for 20 min. The supernatant was filtered through a 0.45-μm glass fiber syringe filter (GMF, Whatman, USA) using a glass syringe. After the filtrate was diluted with methanol, the sirolimus concentration in the filtrate was determined using an HPLC method. The HPLC analyses of the in vitro samples of sirolimus were performed on a WatersTM HPLC system that consisted of a pump (Model 600), an auto-sampler (Model 717 plus), and a UV detector (Model 486 Tunable Absorbance Detector). A C18 analytic column (ZORBAX Eclipse XDB-C18, 5 μm, 4.6 mm × 250 mm, Agilent, USA) at 60°C was used with a mobile phase of 84% methanol and 16% water. The injection volume was either 20 μL or 50 μL, and the eluent flow rate was 1.0 mL/min. The signal was monitored at 278 nm.
Effect of TPGS on the stability of sirolimus
To evaluate the effect of TPGS on the stability of sirolimus, a stability test was performed by adding a stock solution of sirolimus in DMSO to capped glass volumetric flasks containing different concentrations of TPGS dissolved in a dissolution medium with a pH of 1.2. The initial concentration of sirolimus was 1 μg/mL, and the DMSO concentration in the final solution was 0.11%. The samples were placed in a water bath at 37°C in the dark. Suitable aliquots were withdrawn at various time intervals, and the concentration of the drug in each aliquot was assayed by HPLC.
Preparation of sirolimus-loaded micelles
The sirolimus-loaded micelles were prepared using the thin-film hydration method. Briefly, 100 mg of sirolimus and 5 g of TPGS were dissolved in ethanol. The solution was subsequently evaporated under reduced pressure by rotary vacuum evaporation. The obtained residual was hydrated in degassed water under magnetic stirring at room temperature to form a micellar suspension (total volume = 100 mL). The non-incorporated drug was separated by filtration through a 0.22-μm filter membrane, and a clear solution of sirolimus-loaded micelles was obtained. The empty micelles were prepared using the same procedure.
Particle size distribution and zeta potential
The particle size distribution and the mean diameters of the micelles were determined by dynamic light scattering techniques using an ELSZ-2plus apparatus (Otsuka Electronics Co. Ltd. Japan) at a scattering angle of 90° and room temperature. Each freshly prepared sample was placed into a quartz cuvette without additional treatment. The zeta potential of the micelles was also determined by electrophoretic light scattering techniques (laser Doppler) using the same apparatus. The measurements were repeated five times for each sample.
Drug-loading percentage and entrapment efficiency
The concentration of sirolimus in the micelles was determined through HPLC after the micellar solution was suitably diluted with ethanol. The drug-loading percentage and the entrapment efficiency of sirolimus in the TPGS micelles were calculated using the following equations:

In vivo study
Male Sprague–Dawley rats weighing 200–220 g were obtained from Samtaco Bio Korea Inc. (Korea). The study was conducted in compliance with the Good Laboratory Practice Regulations delineated by the Korea Food and Drug Administration (KFDA2005-79). The study protocol was approved by the ethics committee of Chungnam National University.
After the rats were anesthetized with diethyl ether, their femoral arteries were cannulated with a 23-gauge polyethylene cannula. The rats in the first group were orally administered 1 mL of a 0.2% methylcellulose aqueous suspension containing sirolimus powder, whereas the rats in the second group received sirolimus-loaded micelles at a dose of 5 mg/kg. Blood samples (approximately 500 μL each) were collected from the femoral artery 0.5, 1, 1.5, 2, 4, 8, and 12 h after oral administration.
The whole-blood samples (400 μL) were mixed with 400 μL of methanol, 400 μL of 6.25% (w/v) zinc sulfate, and 40 μL of an internal standard solution (1 μg/mL everolimus in 50% methanol). After centrifugation at 13,000 rpm and 1°C for 10 min, the supernatants were mixed with NaOH (100 μL, 0.1 M) and 1-chlorobutane and vortexed. After centrifugation at 13,000 rpm and 1°C for 10 min, the organic phase was transferred to another tube and evaporated under a light stream of nitrogen until the sample was dried. The residual was dissolved in 100 μL of 70% methanol, and 10 μL of the dissolved sample was used for LC/MS analysis.
The sirolimus levels in the blood were determined by LC/MS, as previously described (Kim et al. Citation2011). Briefly, the amount of sirolimus (molecular weight = 914.17) was analyzed with a LCMS-2010A mass spectrometer (Shimadzu, Japan) by chromatography using a Supelcosil LC-18 column (150 × 4.6 mm, 3 μm) that was maintained at 60°C and a Supelguard LC-18 column that was used as a pre-column. The mobile phase consisted of acetonitrile- water (70:30, v/v) at a flow rate of 1.0 mL/min. The [M–Na+] m/z of 936.00 and 980.00 for sirolimus and everolimus, respectively, were selected as the detecting ions.
The AUC0→12h was calculated through non- compartmental analysis (WinNonlin 2.1, Pharsight Corp., Mountain View, CA, USA). The values of Cmax and Tmax were obtained directly from the blood data. The levels of statistical significance (P < 0.05) in the differences of the means of the unpaired data were assessed using the Students t-test.
Results and discussion
The effect of the TPGS concentration on the solubility of sirolimus was evaluated using phase solubility techniques. At TPGS concentrations that are higher than the critical micelle concentration (CMC), free and micelle-bound forms of solute exist in the solution. The total sirolimus concentration (Stotal) in a concentration of TPGS that is above the CMC is the sum of the free (Sfree) and micelle-bound (Sbound) sirolimus molecules.
Stotal = Sfree + Sbound(1)
The following equilibrium between the free and micelle-bound solutes is assumed to hold (Amidon et al. Citation1982):
where Ka is the equilibrium distribution coefficient and (SAA)m is the concentration of TPGS in micelle form and is equal to the difference between the total TPGS concentration and the CMC (Yu et al. Citation1999, Sheu et al. Citation2003). The relationship between Stotal and (SAA)m is deduced as follows:

Based on the above equation, a linear plot of Stotal as a function of the TPGSt (total concentration of surfactant added to the solution) above the CMC was constructed. The value of Sfree was obtained by adding the intercept of the linear plot to the product of the slope and the CMC value (estimated from the plot). The equilibrium distribution coefficient (Ka) was then calculated by dividing the slope by the value of Sfree (Sheu et al. Citation2003).
As shown in , the solubility of sirolimus increased with increasing TPGS concentration at both temperatures that were tested (25 and 37°C). In particular, the apparent solubility at 25°C linearly increased from approximately 11-fold (compared with water) at 1 mg/mL to approximately 70-fold at 10 mg/mL. The improvement in the solubility of sirolimus with increasing TPGS concentrations above the CMC was the result of an increase in the amount of micelle-bound solutes. By plotting the solubility of sirolimus as a function of the concentration of TPGS, the total concentration of free sirolimus in the medium (Sfree) and the equilibrium distribution coefficient (Ka) were calculated from the intercept (Sfree(12KaCMC)) and the slope (KaSfree) using the estimated CMC of the corresponding medium. As shown in , the value of Sfree increased with increasing temperature, whereas the value of Ka decreased. In fact, the degree of TPGS solubilization decreased as the temperature increased. From the solubility measurements, the CMC of TPGS in water at 37°C was determined to be approximately 0.1 mg/mL, which is slightly lower than the literature values of 0.1 mg/mL (Sheu et al. Citation2003), 0.2 mg/mL (Yu et al. Citation1999), and 0.2–0.4 mg/mL (Ismailos et al. Citation1994) that were obtained from surface tension measurements. In this study, the CMC of TPGS was estimated to be 0.1 mg/mL at both 25 and 37°C.
Figure 1. Effect of TPGS on the solubility of sirolimus.
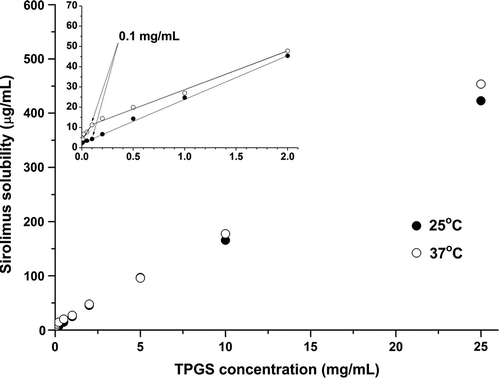
Table I. TPGS CMC and sirolimus Sfree and Ka in the TPGS-sirolimus system.
A rapid degradation of sirolimus was observed in a dissolution medium with a pH of 1.2 compared to dissolution mediums with pH 4.0 and 6.8 (Kim et al. Citation2011). Therefore, the effects of TPGS on the stability of sirolimus in the dissolution medium at pH 1.2 were investigated. As shown in , the degradation of sirolimus decreased with increasing TPGS concentration. In addition, an increase in the TPGS concentration in the dissolution medium at pH 1.2 decreases the degradation rate of sirolimus. Furthermore, a non-linear relationship was obtained between the pseudo-first-order rate constants that were calculated from the slopes and the TPGS concentration ( and ). The rate decreased rapidly when the TPGS concentration was increased from 0 to 10 mg/mL, but leveled off at higher TPGS concentrations. These results are consistent with a kinetic system in which a drug degrades at a higher rate outside the complex than inside the complex.
Figure 2. Effect of TPGS on the stability of sirolimus.
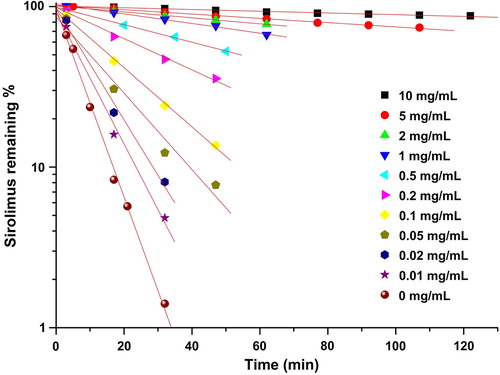
Figure 3. The pseudo-first-order degradation constant of sirolimus in a dissolution medium with a pH of 1.2.
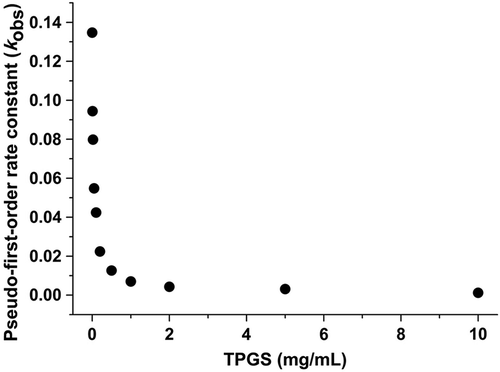
Table II. The effect of the TPGS concentration on the stability of sirolimus in a dissolution medium with a pH of 1.2.
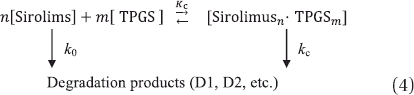
In Eq. (4), k0 represents the pseudo-first-order rate constant for the degradation of free sirolimus, kc is the pseudo- first-order constant for the degradation of the drug in complex and Kc corresponds to the stability constant of the complex assuming n:m complexation. In the sirolimus-TPGS system, the degradation of sirolimus was decreased even at TPGS concentrations that were lower than the CMC. The data were analyzed assuming that a 1:1 complex could be formed and considering the interaction between sirolimus and vitamin E and their molecular sizes.
The general rate equation for the change in the total sirolimus concentration ([Sirolimus]T) is
The rearrangement of Eq (5) and its substitution into Eq (6) gives Eq (7):

where Kobs is the pseudo-first-order rate constant for the degradation of sirolimus:
The rearrangement of Eq. (8) yields Eq. (9):
If k0 is known, the values of kc and Kc can be calculated after the construction of Lineweaver-Burk plots using Eq. (9) () (Loftsson et al. Citation1989). The value of kc is obtained from the ordinate intercept and k0 and Kc are obtained by dividing the slope into the ordinate intercept.
Figure 4. Representative Lineweaver–Burk plots for the degradation of sirolimus in a dissolution medium with a pH of 1.2.
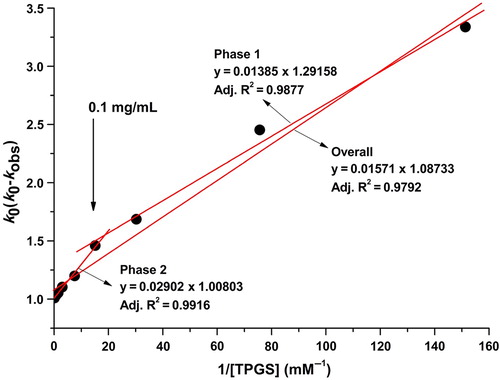
As shown in , the slope decreases at concentrations of TPGS below 0.1 mg/mL. In addition, the model fits this phase better than the totality of the points. An increase in the slope was observed at TPGS concentrations above 0.1 mg/mL. The corresponding slope was calculated from the straight lines that were fit to the data obtained at TGPS concentrations above 0.1 mg/mL concentration. The calculated slope at concentrations higher than 0.1 mg/mL was approximately 2-fold higher compared to the slopes obtained at concentrations below 0.1 mg/mL (). This 0.1 mg/mL concentration is the CMC of TPGS in the TPGS-sirolimus system. In fact, it was suggested that TPGS stabilizes sirolimus through different mechanisms below and above the CMC. Below the CMC, it was suggested that the stabilization of sirolimus by TPGS is dominated by specific interactions between the TPGS and sirolimus molecules, such as hydrogen bonding π–π interactions, electrostatic forces, induction forces, hydrogen bonding and hydrophobic interactions (Suzuki and Sunada Citation1998). Above the CMC, it has been suggested that the stabilization of sirolimus by TPGS is dominated by the formation of micelles. The kinetic rate of the degradation of sirolimus from the micelle was approximately 125-fold slower compared with the raw material.
Table III. The k0, kc and Kc values calculated using the Lineweaver–Burk plots for the TPGS-sirolimus system.
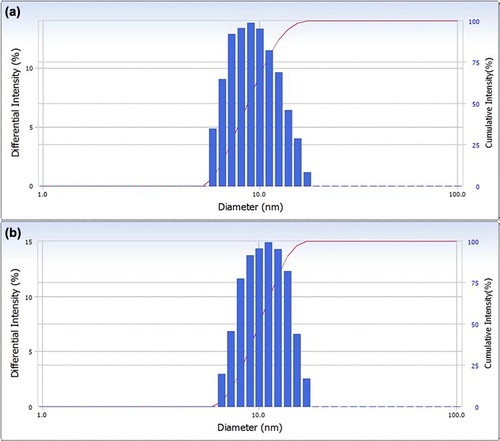
In this study, the sirolimus-loaded TPGS micelles were prepared using the thin-film hydration method. The percentage of drug loading in the sirolimus-loaded TPGS micelles was approximately 1.09% ± 0.02% and the entrapment efficiency was 97.1% ± 1.2%. The encapsulation of sirolimus in the TPGS micelles was high at this drug-loading percentage. The particle size distributions for the empty TPGS micelles and the sirolimus-loaded TPGS micelles are presented in . Dynamic light scattering experiments show monodisperse nanoparticles with a hydrodynamic size of 11 ± 0.5 nm (polydispersity index = 0.014), which are believed to be sirolimus-loaded TPGS micelles. The empty TPGS micelles were measured using the same technique and were found to have a mean size of 10.5 ± 0.5 nm. The zeta potential of the sirolimus-loaded TPGS micelles was −4.1 ± 1.2 mV, whereas the empty TPGS micelles did not have a measurable zeta potential (Yan et al. Citation2007). The concentration of sirolimus in the TPGS micellar solution was 0.97 ± 0.12 mg/mL, whereas a concentration of only 2.43 ± 0.06 μg/mL was found for sirolimus in water. Consequently, the solubility of sirolimus in the TPGS micelles was approximately 400-fold higher than that of crude sirolimus in water.
Figure 5. Particle size distributions of empty TPGS micelles (a) and sirolimus-loaded TPGS micelles (b).
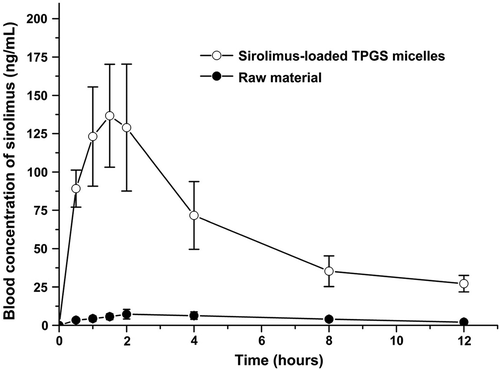
The oral absorption of sirolimus-loaded TPGS micelles was evaluated in rats. presents the blood concentration-time profile of sirolimus in rats after the oral administration of the raw material and the sirolimus-loaded TPGS micelles at a dose equivalent to 5 mg/kg sirolimus. lists the pharmacokinetic parameters calculated from the time profiles. The oral drug absorption of the sirolimus-loaded TPGS micelles was significantly higher than that of the raw material. The AUC0→12h, Cmax, and Tmax of the raw material were 55.0 ± 9.2 ng 3 h/mL, 7.9 ± 2.8 ng/mL, and 2.5 ± 1.3 h, respectively. Similarly, the AUC0→12h, Cmax, and Tmax of the sirolimus-loaded TPGS micelles were 745.9 ± 159.1 ng·± h/mL, 150.9 ± 33.5 ng/mL, and 1.4 ± 0.5 h, respectively. Thus, the sirolimus-loaded TPGS micelles exhibited a higher bioavailability than the raw material with approximately 13.6- and 19.0-fold increases in the AUC0→12h and Cmax.
Table IV. Pharmacokinetic parameters of sirolimus in rats after the oral administration of raw sirolimus and sirolimus-loaded TPGS micelles.
Figure 6. Blood concentration–time profile of sirolimus in rats after the oral administration of raw sirolimus and sirolimus-loaded TPGS micelles.
Polymeric micelles may positively influence drug absorption in a number of ways, including improving the drug solubilization and the membrane permeability in the gastrointestinal tract and inhibiting efflux transporters, such as P-glycoprotein (P-gp) (Gaucher et al. Citation2010). It is well known that TPGS acts as a P-glycoprotein inhibitor. However, it has been previously reported that the co-administration of TPGS with a commercial sirolimus oral solution (1 mg/mL) does not change the bioavailability of sirolimus in rats (Wacher et al. Citation2002). In this study, the enhancement in the absorption of sirolimus that was observed with the sirolimus-loaded TPGS micelles could be attributed to the increased solubility of sirolimus, which is typically considered a BCS class II drug (i.e., low solubility-high permeability). According to the BCS guidelines, this solubility is enhanced in TPGS and the nano-scale size of the micelles would make the micelles adhere to the intestinal mucosal epithelial, which would result in a longer absorption time (Zhang et al. Citation2010).
Conclusion
TPGS significantly improved the solubility and stability of sirolimus through micelle solubilization. The concentration of sirolimus in a 50 mg/mL TPGS micellar solution was 0.97 ± 0.12 mg/mL, which shows an approximately 400-fold enhancement over its solubility in water. Furthermore, pharmacokinetic studies in rats indicated that the TPGS micellar solution significantly improved the oral absorption of sirolimus. Therefore, the preliminary results from this study suggest that sirolimus-loaded TPGS micellar solutions have great potential for clinical application.
Declaration of interest
The authors report no conflicts of interest. The authors alone are responsible for the content and writing of the paper.
This work was supported by the Priority Research Centers Program of the National Research Foundation of Korea (NRF), which is funded by the Ministry of Education, Science and Technology (2009-0093815), and by a grant from the Korea Healthcare Technology R&D Project of the Ministry for Health, Welfare and Family Affairs in the Republic of Korea (A080470).
References
- Amidon GE, Higuchi WI, Ho NF. 1982. Theoretical and experimental studies of transport of micelle-solubilized solutes. J Pharm Sci. 71:77–84.
- Constantinides PP, Han J, Davis SS. 2006. Advances in the use of tocols as drug delivery vehicles. Pharm Res. 23:243–255.
- Dintaman JM, Silverman JA. 1999. Inhibition of P-glycoprotein by D-alpha-tocopheryl polyethylene glycol 1000 succinate (TPGS). Pharm Res. 16:1550–1556.
- Gaucher G, Satturwar P, Jones MC, Furtos A, Leroux JC. 2010. Polymeric micelles for oral drug delivery. Eur J Pharm Biopharm. 76:147–158.
- Ismailos G, Reppas C, Macheras P. 1994. Enhancement of cyclosporin A solubility by d-alphatocopheryl-polyethylene-glycol-1000 succinate (TPGS). Eur J Pharm Sci. 1:269–271.
- Junghanns JU, Muller RH. 2008. Nanocrystal technology, drug delivery and clinical applications. Int J Nanomedicine. 3:295–310.
- Kim MS, Kim JS, Park HJ, Cho WK, Cha KH, Hwang SJ. 2011. Enhanced bioavailability of sirolimus via preparation of solid dispersion nanoparticles using a supercritical antisolvent process. Int J Nanomedicine. 6:2997–3009.
- Loftsson T, Björnsdóttir S, Pálsdóttir G, Bodor N. 1989. The effects of 2-hydroxypropyl-β-cyclodextrin on the solubility and stability of chlorambucil and melphalan in aqueous solution. Int J Pharm. 57:63–72.
- Sheu MT, Chen SY, Chen LC, Ho HO. 2003. Influence of micelle solubilization by tocopheryl polyethylene glycol succinate (TPGS) on solubility enhancement and percutaneous penetration of estradiol. J Control Release. 88:355–368.
- Simamora P, Alvarez JM, Yalkowsky SH. 2001. Solubilization of rapamycin. Int J Pharm. 213:25–29.
- Sosnik A, Carcaboso AM, Chiappetta DA. 2008. Polymeric nanocarriers: new endeavors for the optimization of the technological aspects of drugs. Recent Pat Biomed Eng. 1:43–59.
- Strickley RG. 2004. Solubilizing excipients in oral and injectable formulations. Pharm Res. 21:201–230.
- Suzuki H, Sunada H. 1998. Mechanistic studies on hydrotropic solubilization of nifedipine in nicotinamide solution. Chem Pharm Bull. 46:125–130.
- van Vlerken LE, Amiji MM. 2006. Multi-funtional polymeric nanoparticles for tumor-targeted drug delivery. Expert Opin Drug Deliv. 3:205–216.
- Varma MV, Panchagnula R. 2005. Enhanced oral paclitaxel absorption with vitamin E-TPGS: effect on solubility and permeability in vitro, in situ and in vivo. Eur J Pharm Sci. 25:445–543.
- Vézina C, Kudelski A, Sehgal SN. 1975. Rapamycin (AY-22,989), a new antifungal antibiotic. I. Taxonomy of the producing streptomycete and isolation of the active principle. J Antibiot. 28:721–726.
- Wacher VJ, Silverman JA, Wong S, Tran-Tau P, Chan AO, Chai A, . 2002. Sirolimus oral absorption in rats is increased by ketoconazole but is not affected by D-alpha-tocopheryl poly(ethylene glycol 1000) succinate. J Pharmacol Exp Ther. 303: 308–313.
- Yan A, Von Dem Bussche A, Kane AB, Hurt RH. 2007. Tocopheryl polyethylene glycol succinate as a safe, antioxidant surfactant for processing carbon nanotubes and fullerenes. Carbon N Y. 45: 2463–2470.
- Yu L, Bridgers A, Polli J, Vickers A, Long S, Roy A, . 1999. Vitamin E-TPGS increases absorption flux of an HIV protease inhibitor by enhancing its solubility and permeability. Pharm Res. 16:1812–1817.
- Zhang Y, Li X, Zhou Y, Wang X, Fan Y, Huang Y, Liu Y. 2010. Preparation and evaluation of poly(ethylene glycol)-poly(lactide) micelles as nanocarriers for oral delivery of cyclosporine A. Nanoscale Res Lett. 5:917–925.
- Zhang Z, Tan S, Feng SS. 2012. Vitamin E TPGS as a molecular biomaterial for drug delivery. Biomaterials. 33:4889–4906.