
Abstract
We report the development of Layer-by-Layer (LbL) polyelectrolyte self-assembled nanocrystalline drug-delivery platform using two experimental factors, namely the number of coatings and temperature during deposition with three varying levels. The optimized formulation (Fopt) was assessed for zeta potential and particle size using Fourier Transform Infrared Spectroscopy (FT-IR), Differential Scanning Calorimetry (DSC), and Scanning Electron Microscopy (SEM). Charge reversal along with an increase in particle size confirmed coating of polyelectrolyte on drug nanocrystals. The FT-IR study revealed no signs of incompatibility or change in formulation property during preformulation and stability study. This fact was further supported by DSC results.
Introduction
Layer-by-Layer (LbL) self-assembly system is a technical approach towards the construction of 3-dimensional multilayer films with tailored properties (CitationDong et al. 2005). The LbL assembly has been a popular method for constructing a multilayered structure on surfaces; it is a simple method allowing the design of multilayer architectures with nanometer precision (CitationMiryam et al. 2010, CitationFrank et al. 1999). This method includes simple alternative adsorption of oppositely charged polyelectrolyte on core material. The LbL films are assembled by the repetitive direct adsorption of components with opposite functionality like polycations and polyanions (polyelectrolytes). Multilayer self-assembly formation by electrostatic attraction gained considerable attention (CitationCheung et al. 1997); the alternating films can be stabilized by hydrogen bonding (CitationKim et al. 2008), hydrophobic interaction (CitationKotov 1999), covalent bonding (CitationJinyu et al. 1999), Van der Waals forces (CitationSato and Sano 2005), supramolecular inclusion (CitationIkeda et al. 2001), biospecific recognition (CitationHoshi et al. 2002), charge transfer complex formation (CitationShimazaki et al. 1998), and stereo-complex formation (CitationSerizawa et al. 2000).
It was firstly Iller in 1965, who proposed LbL technique, where alternate layers of positively and negatively charged colloidal particles were deposited from sols against a smooth surface of glass (CitationIller 1996) followed by the introduction of electrostatic polyelectrolyte self-assembly in LbL fashion onto a charged planer substrate (CitationDecher et al. 1992, CitationDecher 1997). It was confirmed that electrostatic attractions can be used to construct multilayer films that can be described as surface analogs of intercalation compounds (CitationKeller et al. 1994).
Utilization of LbL technology for drug delivery holds good prospect for modified surface-mediated drug-delivery and drug-reservoir approach. The release of drug from LbL system can be improved by the use of various polymeric properties (CitationRenee et al. 2009). This technology has been proven promising for coating different types of microparticles (CitationArys et al. 2000, CitationBertrand et al. 2001) and other colloidal systems (CitationSukhorukov et al. 1998, CitationCaruso et al. 1998, CitationAntipov et al. 2001, CitationCaruso et al. 2000, CitationBalabushevitch et al. 2001, CitationJiafu et al. 2011, CitationZhang et al. 2004, CitationSandeep et al. 2009). Incorporation of hydrophilic and hydrophobic domains within a single layer developed great potential for drug and other therapeutics delivery (CitationWolh and Enqbersen 2012).
Sustained- and controlled-release mechanisms offer greater effectiveness, lower toxicity, and improved patient convenience (CitationUhrich et al. 1999). The release rate from encapsulated systems generally depends on the thickness of the encapsulating shell and the material used in the coating (CitationAdi and Moawia 2007). The LbL fabrication procedure offers potential advantages over conventional drug and therapeutic encapsulation strategies, including the ability to control the order and location of multiple polymer layers with nanometer-scale precision and the capability to define the concentrations of incorporated materials simply by varying the number of polymer layers (CitationBertrand et al. 2001). Researchers demonstrated sustained release of plasmid DNA for a period of up to 30 h through LbL approach (CitationSandeep et al. 2009); furthermore the release of drugs from polyelectrolyte microcapsules can also be tuned (CitationBingning et al. 2009). Recent literature highlights the use of LbL technology for drug targeting and biosensing (CitationDeshmukh et al. 2013). This promising concept has been recently applied for preparation of multilayered nanoparticle using PLGA nanoparticle as core material for improved biodistribution and controlled drug release, which demonstrated that LbL coating retards the degradation of core (PLGA) and lead to enhanced blood circulation time (CitationMorton et al. 2013). The use of LbL technology for enhancing drug-loading capacity of magnetic nanoparticles is also reported recently (CitationManju and Sreenivasan 2011), even though very less work has been done using LbL technology for direct coating of water insoluble drugs. Currently, this approach has been reported for tumor targeting, protein delivery, multidrug resistance, increased stability, sustained release of chemicals, surface modification, enhanced oral absorption, and controlled drug release to name a few (CitationBazylinska et al. 2012a, Citation2012b CitationShu et al. 2010, CitationVergara et al. 2012, CitationRodriguez et al. 2011, CitationHirsjärvi et al. 2010, CitationPark et al. 2013). There is very less in the literature which deals with the use of statistical tool for optimizing the performance of the LbL system. In order to plan the best formulation, it is of course possible to apply a trial-and-error approach but this is not an effectual means. Systematic optimization techniques are always preferable (De et al. 1998). Recently published literatures highlight the advantages of layer-by-layer coating of nanoparticles for drug delivery (CitationRamaswamy et al. 2014, CitationSun et al. 2014, CitationKim et al. 2013).
Lornoxicam (LXM), also known as Chlortenoxicam, belongs to a new non-steroidal anti-inflammatory drug (NSAID), which is a thienothiazine derivative of the oxicam class (CitationRawal et al. 2010, CitationRiad and Moussa 2008). It is a potent inhibitor of both COX-1 and COX-2 enzymes used for the symptomatic treatment of pain and inflammation in patients with rheumatoid arthritis and osteoarthritis (CitationHomdrum et al. 2006, CitationKidd and Frenzel 1996). Its usefulness is limited due to its short half-life that ranges from 3 to 5 h (CitationBalfour et al. 1996, CitationSkjodt and Davies 1998). This characteristic makes it a suitable candidate for formulating LbL self-assembled drug-delivery platform.
In the present study, sonication-assisted LbL self- assembly process was used to prepare LXM nanocrystals, encapsulated by alternate adsorption of positively charged Gelatin A and negatively charged sodium poly (styrenesulfonate) (PSS) on the surface of the negatively charged LXM nano-crystals. Design-of-Experiment (DoE) approach was employed in the development of LbL self-assembled LXM nanocrystals as an effective and functional drug-delivery platform. Deposition temperature and number of coating were selected as the two experimental factors with three varying levels. To the best of our knowledge we are the first to report the application of DoE in the fabrication of LbL self-assembled drug-delivery platform.
Experimental
Materials
The LXM was received as a generous gift from Glenmark Pharmaceutical Ltd., Nasik, India. Gelatin A and PSS were purchased from Sigma-Aldrich, St. Louis, USA. All other chemicals used for the study were of HPLC grade. Water used in all the studies was distilled and filtered through 0.22 μm nylon filter before use.
Method
Initially, accurately weighed quantity (20 mg) of LXM was sonicated in 20 mL of pH 5.8 phosphate buffer solution (PBS) for 5 min with the assistance of probe sonicator so as to get LXM nanocrystalline suspension. This suspension was added to 25 mL (2 mg/mL) of positively charged Gelatin-A solution prepared in the pH 5.8 PBS. The resultant dispersion was further sonicated for 30 min under varying conditions of temperature, as suggested by DoE, followed by gentle stirring (250 rpm). The dispersion was centrifuged at 5000 rpm for 15 min, the supernatant was discarded and sediment was washed twice with centrifugation washing protocol in pH 5.8 PBS to remove any unbound polyelectrolyte. The sediment was dried at 45°C and immersed in 25 mL (2 mg/mL) of negatively charged PSS solution for second polyelectrolyte layering. The remaining process was the same as coating with gelatin-A solution. This entire process concluded with the first bilayer formation. The same procedure was repeated again and again till the desired number of bilayered coatings was achieved, and finally dried at 45°C (CitationHua et al. 2003, CitationPatil et al. 2013).
Experimental design
The LbL self-assembled LXM-delivery platform was optimized by using 32 full factorial design to study the effect of two independent variables namely temperature during deposition (X1) and number of bilayer coatings (X2), on dependent variables which include percentage drug release (Y1) and percentage drug loading (Y2). A statistical model incorporating interactive and polynomial terms was used to evaluate the responses.
Where, Y1 is the dependent variable (percentage drug release)
b0 is the arithmetic mean response of the nine runs
b1 is the estimated coefficient for the factor X1
The main effects (X1 and X2) represent the average result of changing one factor at a time from its low to high value. The interaction terms (X1X2) show how the percentage drug release response changes when two factors are simultaneously changed.
Similarly
Where, Y2 is the dependent variable (percentage drug loading)
b0 is the arithmetic mean response of the nine runs
b1 is the estimated coefficient for the factor X1
Characterization and evaluation
Percentage drug loading (%DL)
The %DL (w/w) was calculated by determining the amount of LXM in nanocapsules (LbL self-assembled LXM nanocrystals). Initially, 10 mg of dry formulation was added to 100 mL of 0.1N NaOH solution. The resultant solution was agitated on magnetic stirrer for 6 h at 40°C for complete dissolution of the drug. The aliquots were centrifuged at 5,000 rpm for 15 min and diluted further for spectrophotometric determination (CitationPark et al. 2013). The values of drug loading were calculated using Equation (3).
Percentage entrapment efficiency (%EE)
By considering the loss of drug during coating and washing, the %EE of the optimized formulation (Fopt) was calculated, where the LXM weight was estimated in the final formulation. The ratio of weight of LXM in prepared nanocapsules to the initial weight of LXM taken for formulation was calculated (CitationYan et al. 2011). The values of %EE were calculated using Equation (4).
In-vitro diffusion study
Drug release by diffusion was measured using vertical Franz-type diffusion cell (Borosilicate) with 1.4 cm orifice diameter. The receptor cell was filled with pH 7.4 PBS with a small magnetic stirrer placed in it. A 0.22 μ cellulose acetate membrane was used as semi-permeable membrane (Millipore, Billerica, Massachusetts). Donor compartment of similar orifice was placed on receptor compartment separated by semi-permeable membrane. The weighed amount of formulation equivalent to 8 mg of LXM was suspended in 1 mL of pH 7.4 PBS and placed in donor compartment. Samples were removed from the receptor cell at pre-determined times, filtered, and diluted suitably for spectrophotometric analysis at 377 nm (CitationHirsjärvi et al. 2010). Flux and permeability constant was calculated for both pure LXM and LXM nanocapsules.
In-vitro dissolution study
The USP dissolution apparatus II (Dissolution test TDT-08Lx, Electrolab, India) was used to perform LXM release study of LbL self-assembled LXM-delivery platform. The paddle was rotated at 50 rpm and the temperature was maintained at 37.0 ± 0.5°C. The in-vitro dissolution study was carried out in 900 mL of 7.4 pH PBS using 16 mg equivalent quantity of LXM. Aliquots were withdrawn, filtered through 0.22 μ filter disc, and diluted suitably for further analysis. The withdrawn volume of the sample was replaced with an equal volume of fresh medium at regular time interval to maintain a sink condition. The amount of drug release was analyzed spectrophotometrically at 377 nm.
Optimization and effect of experimental factors on responses
The optimization module in Design-Expert® searches for a combination of factor levels that simultaneously meet the requirements placed on each of the responses and factors. Analysis of each response is required to establish the appropriate model prior to optimization. The optimization of one response or the simultaneous optimization of multiple responses can be performed graphically or numerically. The annotation comments by annotated analysis of variance (ANOVA) are designed to determine a suitable model for the experiment. For optimization of formulation, the value of drug loading was kept at a maximum level and value of drug diffusion was kept at a minimum level.
Validation of model
The validation of the model was done by comparing the predicted and obtained results. In brief, the Fopt was formulated as per the suggested value of independent variables. The obtained value of response was compared with software-generated predicted value of the response. A graph was plotted between predicted and observed value to calculate the value of R2, which gives the correlation between the two values. A high correlation nearer to 1 shows the suitability of the model.
Fourier transform infrared spectroscopy (FT-IR)
As a part of preformulation assessment, the FT-IR spectrum of pure LXM and physical mixture of LXM, PSS, and Gelatin A (freshly prepared and after 3 months of accelerated stability condition) were obtained using a FT-IR spectrometer-430 (Shimadzu 8400S, Japan). Samples were previously ground and mixed thoroughly with potassium bromide to form a matrix at 1:100 (sample: KBr) ratio and analyzed by FT-IR spectroscopy.
As a part of short-term stability testing, the Fopt was also processed in the same manner as mentioned above and assessed for any signs of instability.
Differential scanning calorimetry (DSC)
The DSC study of LXM, physical mixture of LXM and polyelectrolytes, and Fopt was performed for determination of LXM melting point, compatibility of LXM with the polyelectrolytes, and stability of LXM in Fopt, respectively. The thermogram was obtained by a differential scanning calorimeter (DSC-60, Shimadzu Corporation, Japan). The sample was placed in an aluminum pan and crimped with an aluminum cover. The heating and cooling rate were 10°C/min and all measurements were performed over temperature range 30–500°C.
Scanning electron microscopy
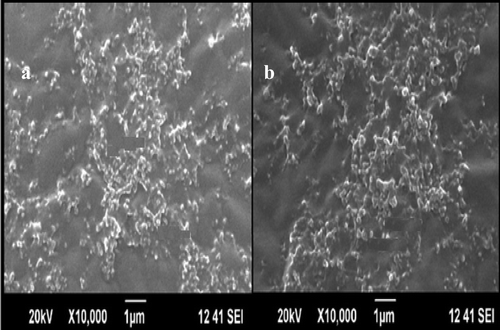
The morphology and surface description of Fopt and bare LXM were studied using scanning electron microscope (SEM) (JEOL 5400, Tokyo, Japan). The LXM nanocrystals were sputtered with gold or platinum and maintained at room temperature for complete dryness before the observation. Pure LXM nanocrystals and Fopt were used for the study to compare morphological changes in nanocrystals.
Zeta potential and particle size measurement
The zeta potential of LXM and Fopt after three successive coatings was studied to assess the reversal change of charge from negative to positive and vice-versa. This study provided assurance of step-wise alternative deposition of oppositely charged coatings. The zeta potential of pure nanosized drug particles followed by subsequent coating was examined using the Malvern Zeta analyzer (Nano-ZS 90, Malvern Instrument, UK) with pH 5.8 PBS prepared in ultrapure water as a dispersion medium (25°C). These measurements were run at least three times with independent particle batches.
The particle size of LXM nanocrystals and Fopt was determined using the Zetasizer (Nano ZS 90, Malvern Instruments Ltd., Malvern, UK) equipped with a 4.0 mW internal laser and based on the Dynamic Light Scattering phenomenon. Prior to the measurement, all samples were diluted with double-distilled water to obtain a uniform dispersion with concentration below 0.5 mg/mL, in a disposable polystyrene cell. All measurements were performed at 25°C, at a scattering angle of 90°. The intensity weighed mean diameter of the bulk population of particles was given by z-average diameter value of the particles. Each sample was measured in triplicate in the analysis.
Results and discussion
Percentage drug loading
The %DL of different formulation batches is reported in . The %DL decreases with increase in number of coating but surprisingly maximum drug loading was found in formulation F8 which contains 20 bilayer coating compared with other formulation containing lesser bilayer coatings. This finding indicates that the processing temperature, which was regarded as another independent variable plays a key role in percentage drug loading. The reason for the decrease in drug loading with increase in temperature may be correlated with the change in structure of self-assembled polyelectrolyte layer due to increase in temperature which has been reported previously (CitationDelcea et al. 2011). It has been also reported that the increase in temperature leads to shrinkage of polyelectrolyte layer and in some cases complete rupturing of structure (CitationMak et al. 2008). These reasons might have been responsible for the decrease in drug loading with increase in temperature.
Table I. Layout of design actual.
Percentage drug entrapment
The %EE of Fopt was calculated from the readings of %DL and found to be 57% for Fopt. The %EE considers the drug loss occurred at various experimental steps. The washing– centrifugation protocol provides large amount of solvent to come in contact with formulation and drug particles, resulting in drug loss.
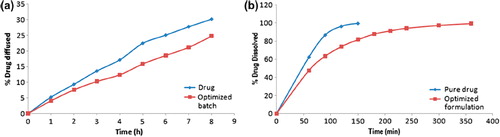
In-vitro diffusion study
The diffusion study of batches suggested by the Design Expert® software was carried out (). Almost every formulation showed sustained release compared with pure drug which depict 30.20% drug diffusion at 8 h. Formulation F2 showed least release (19.14%) which was a suitable pattern of diffusion for sustained release formulation, while the maximum drug release was observed in formulation F7 (25.86%). The formulation F2 was formulated with 50°C deposition temperature and 20 bilayer coatings, while F7 was formulated with 35°C deposition temperature and 10 bilayer coatings.
Flux of pure drug was found to be 215.714 μg/cm2/h, which was higher than that of polyelectrolyte-coated drug nanocrystals, which showed flux of 172.85 μg/cm2/h. The permeability constant (Kp) of pure drug (0.0386 cm/h) was also higher than that of polyelectrolyte-coated drug nanocrystals (0.0285 cm/h). From the above result, we can conclude that polyelectrolyte coating decreased the flux of LXM which will help in sustaining release of LXM.
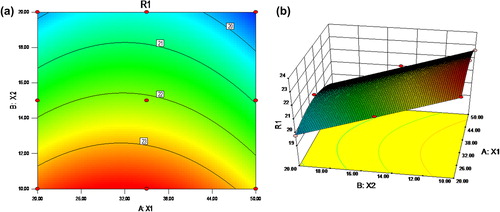
In-vitro dissolution study
The In-vitro dissolution study of pure LXM and Fopt was performed in pH 7.4 phosphate buffer. The study results were compared with the pure LXM crystals and Fopt (). The LXM crystals were dissolved within 120 min as compared with Fopt, which released the LXM in a sustained manner up to 270 min. Hence, sustained release was achieved through LbL encapsulation of LXM nanocrystals.
Experimental design
A total of nine experimental runs were generated using 32 full factorial designs (). Temperature (X1) and number of coating layer (X2) were selected to study their effect on percentage drug diffused and percentage drug loading. The formulation was done according to the suggested batches. The results obtained from the experiments were statistically analyzed for response variables by using DoE.
Table II. Composition of factorial batches using 32 full factorial design.
Effect analysis
Effect of formulation variables on percentage drug diffused in 8 h
Final Equation in Terms of coded Factors:
Where, Y1 = % Drug Release in 8 h,
A = Deposition temperature,
B = Number of bilayers
depicts the effect of deposition temperature and number of bilayer coating on percentage drug release in 8 h; it can be observed that with an increase in the deposition temperature and an increase in the number of bilayer coatings from + 1 through 0 to + 1, the percentage drug diffused at 8 h decreases substantially. From the above equation it is evident that, both temperature and number of coating layer have a negative effect on percentage drug release. With increase in both the independent variables, that is X1 and X2, there is a diminution in response Y1. The decrease in drug release with increase in temperature may be related to the increase in thickness of the polyelectrolyte layer to increase in temperature as reported earlier (CitationBuscher et al. 2002). Due to increase in the thickness of the layer, the net path length, which drug needs to travel in order to diffuse out of nanocapsule increases. So, the total quantity of drug diffusing out at a particular time interval decreases.
Effect of formulation variables on percentage drug loading
Final Equation in Terms of Actual Factors:
Where, Y2 = % DL(w/w),
A = Deposition temperature,
B = Number of bilayers
Here, in the above formula we can see that both temperature and number of coating layers have negative effect on the final quality attribute, that is drug loading. It means increasing both the factors will lead to decrease in drug loading.
Contour plots and surface response plots for drug loading are shown in . It was observed that with an increase in the deposition temperature and an increase in the number of bilayer coating from −1 level through 0 to + 1 level, the percentage drug loading decreases substantially.
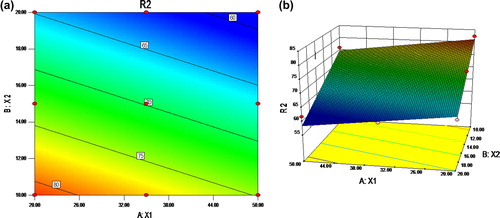
The points in the plot are the means of the response variable at various levels of each factor. The Model F-value of 46.88 implies that the model is significant. There is only a 0.02% chance that a “Model F-Value” this large could occur due to noise. Values of “Prob > F” less than 0.0500 indicate that model terms are significant. In this case A and B are significant model terms. Values greater than 0.1000 indicate that the model terms are not significant. If there are many insignificant model terms (not counting those required to support hierarchy), model reduction may improve this model.
Optimization of batches
The various computations for the current optimization study were performed using Design Expert® software (Design Expert 8.0.7.1; State-Ease Inc., Minneapolis, MN, USA). A general factorial design was used for the systemic study of combinations of deposition temperature and number of bilayer. A general factorial design was constructed where the deposition temperature (X1) and number of bilayer (X2) were selected as the independent factors. The levels of these factors were selected on the basis of initial studies and observations. Entire response variables were studied using multiple-linear-regression-analysis approach. The general form of the equation is as stated earlier (Eqs. 1 and 2).
Optimization was based on response surface methodology, which is a widely practiced approach in the development and optimization of drug-delivery devices. Based on the principle of design of experiments (DoE), the methodology encompasses the use of various types of experimental designs, generation of polynomial equations, and mapping of the response over the experimental domain to determine the optimum formulation(s). The technique requires minimum experimentation and time, thus proving to be far more effective and cost-effective than the conventional methods of formulating dosage forms. Here, the criteria for response were set as the minimum percentage drug release and maximum percentage drug loading for optimization. The polynomial equations (Eqs. 1 and 2) can be used to draw a conclusion after considering the magnitude coefficient and the mathematical sign that the coefficient carries. A high positive or negative value in the equation indicates that by making a minor change in the setting of that factor one may obtain a significant change in the dependent variable. The statistical validity of the polynomials was established on the basis of ANOVA provision in the DoE software ( and ). Level of significance was considered at p < 0.05. The best-fitting mathematical model was selected based on the comparison of several statistical parameters, including the coefficient of variation, the multiple correlation coefficient (R2), the adjusted multiple correlation coefficient (adjusted R2), and the predicted residual sum of squares (PRESS), provided by the software. PRESS indicates how well the model fits the data, and for the chosen model, it should be small relative to the other models under consideration. The 3-D response surface graphs and the 2-D contour plots were also generated by the Design Expert® software. These plots are very useful to interpret interaction effects of the factors on responses.
Table III. The ANOVA for percentage drug diffusion at 8 h.
Table IV. The ANOVA for percentage drug loading.
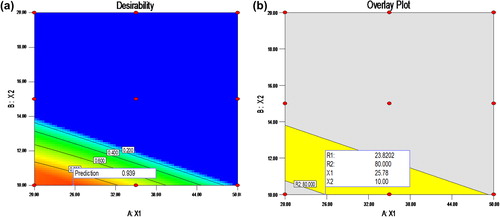
Solution for optimization
For optimization of formulation batch, value of percentage drug release was kept at a minimum and value of percentage drug loading was kept at a maximum. The software suggested the following conditions for Fopt along with predicted results of percentage drug diffused at 8 h and percentage drug loading. As first two batches have maximum desirability, we selected the second batch as Fopt, where the deposition temperature was 25.78°C and number of bilayer coating was ten. The desirability () for achieving the predicted value was 0.939 which is very close to one. This means there is a 93.9% chance of getting the results in accordance with predicted responses. Design space provides us the freedom of varying the dependent variables within given limits so as to get the desired response. In the present work, the design space is shown with the help of overlay plot (). The colored portion of the plot represents the space in which there is a 93.9% chance of getting the desired response even if we vary the factors within the design space. This plot proves quite beneficial in cases where one or more factors need to be kept at a minimum or maximum levels and the desirability of final response is important. In such cases we can vary one factor within given design space, keeping other factor at one extreme of highest or lowest value within the given design space.
Validity of the model
The process was optimized for the response Y1 and Y2, and the Fopt was derived by minimizing the percentage drug diffused at 8 h and maximizing the percentage drug loading of Fopt. To validate the model, formulation of optimized batch was done and the response was compared with that of predicted response. The percentage prediction error was calculated for responses to show the deviation of observed response from the predicted response (). The percentage drug diffused at 8 h was 24.20% by experimented work and predicted value was 23.82%. The percentage drug loading was 78.85% by experimented work and predicted value was 80%. The plotted graph between predicted and observed values () shows existence of good relationship between the experimented and predicted values, confirming the practicability and validity of the model.
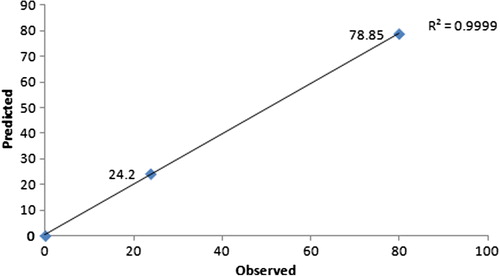
Table V. Predicted and observed value of response of Fopt and prediction error.
Fourier transform infrared spectroscopy
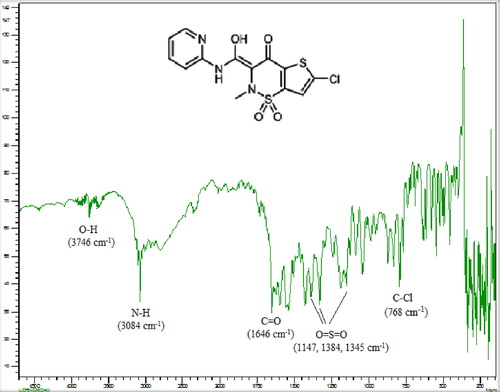
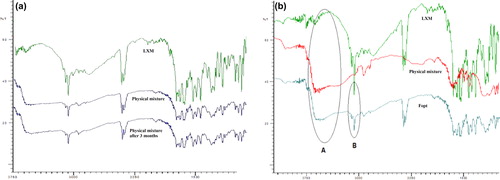
The FT-IR spectrum was measured in the solid state as a potassium bromide mixture. The spectra of pure LXM and its physical mixture with polyelectrolytes (freshly prepared and subjected to a stability study condition of 40 ± 2°C, 75 ± 5% RH for 3 months) is shown in and along with ‘Fopt’ which was kept for short-term stability assessment (). The peak in the range of 3082–3084 cm1 was observed due to N-H stretching vibration and the two peaks of medium strength around 1592–1560 cm−1 were observed due to N-H bond bending vibration. The peak observed at 1642–1647 cm−1 was due to C = O stretching vibration, 762–772 cm−1 assigned to C-Cl bending vibration, and 3800–3100 cm−1 due to OH stretching vibration. There was an occurrence of three peaks in the range of 1140–1380 cm−1 due to O = S = O bond (). All the above characteristic peaks of LXM appeared in the spectra of the physical mixture at the same wave number indicating no modification or interaction between the drug and polyelectrolytes at accelerated conditions. The Fopt, subjected to stability assessment at 40 ± 2°C, and 75 ± 5% RH for 3 months, also showed peaks at same wave number depicting stability of Fopt without any significant interaction. The intensity of characteristic peaks of the drug was found to be reduced in case of Fopt, which indicated the molecular dispersion of the drug. These results demonstrated no significant effect or change in the key functional groups, which conferred structural integrity and stability of LXM in Fopt. FTIR spectra of Fopt was compared with shown spectra of pure drug and physical mixture (); all the characteristic peaks of the drug were present in the spectrum of Fopt. The sharp characteristic peak of N-H stretching was observed at 3080 cm−1 in the spectra of pure LXM as well as in formulation denoted by circle “B”. Also, the broad peak at 3500–3550 cm−1 may be due to –OH of PSS denoted by the circle “A” which was not observed in pure drug. This finding confirms presence of LXM in the polyelectrolyte layering of Fopt indicating the encapsulation of drug nanocrystals by polyelectrolytes.
Differential scanning calorimetry
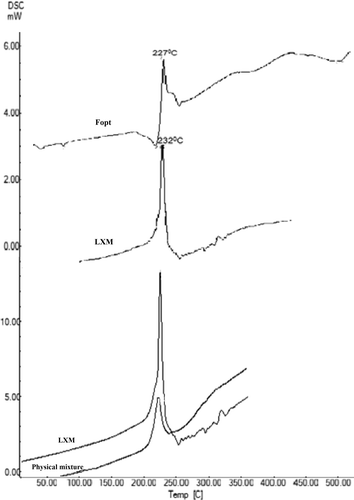
The DSC spectrum of pure LXM in comparison with physical mixture and Fopt was taken with scanning rate of 10°C/min (). Pure LXM exhibited sharp exothermic peak at 232°C, which was found in accordance with a reported value (CitationHamza and Aburahma 2009). The sharp exothermic peak at 231°C confirmed unaltered structure and presence of LXM in physical mixture as well as in Fopt. The DSC curve of physical mixture and Fopt declines any possibility of interaction between LXM and polyelectrolytes (); this fact was also supported by FT–IR study. Presence of sharp peak at 227°C in spectrum of Fopt marked the existence of LXM in Fopt as shown in .
Scanning electron microscopy
Comparison between SEM photomicrograph of pure nanocrystalline LXM particles (A) with Fopt (B) is shown in . In case of pure LXM particles (), small particles of less than 1 μ in size at 10,000X magnification were observed; while in case of 10 bilayered Fopt (), size of particles observed was somewhat larger but less than 1 μ at same magnification. This might be due to aggregation of coated nanocrystals in dry form as well as due to LbL encapsulation of nanocrystalline particles. To support this fact and to get more precise results about particle size, the particle size analysis using laser diffraction technique was commenced, which is discussed in subsequent paragraphs. Apart from size, the surface morphology of pure LXM particle and 10 layered Fopt LXM nanocapsules showed significant difference. The surface morphology of LXM nanocapsules was more spherical and smooth. Moreover, SEM also revealed that the encapsulated particles seem to be with much dull surface compared with bare LXM particles.
Zeta potential measurement and particle size analysis
Zeta potential measurement was performed to confirm coating of Gelatin A and PSS over LXM particles. In , layer zero demonstrates bare LXM particle with highly negative zeta potential. After depositing first layer of gelatin-A solution zeta potential shifted to positive. There was a further reversal change in zeta potential as PSS solution coating proceeds. represents the charge reversal in zeta potential after different coating. As gelatin A is weak polyelectrolyte, the charge shift to positive side was at lesser extent compared with PSS which is considered as a strong polyelectrolyte. The average size of LXM nanocrystals was 230.8 nm and after polyelectrolyte coating (Fopt) it changed from 230.8 nm to 265.1 nm ().
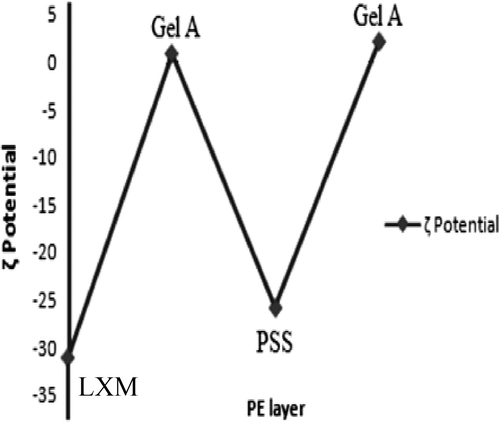
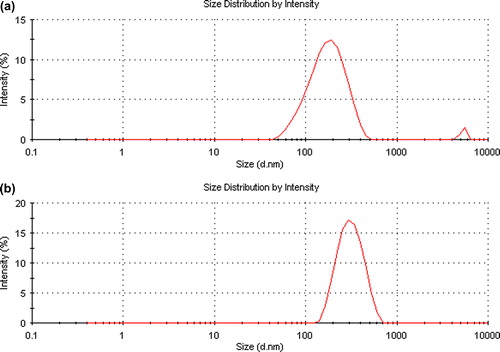
Table VI. Zeta potential of LXM nanocrystals at various experimental steps.
Conclusion
The study reports the sustained release of LXM from LbL polyelectrolyte-coated LXM nano-crystals. Probe sonication-assisted LbL self-assembly process was used to produce nano-crystals, which were further encapsulated by alternate adsorption of positively charged Gelatin A and negatively charged PSS onto the surface of the negatively charged LXM nano-crystals. Probe sonication of a suspension of negatively charged LXM in a solution of Gelatin A reduced aggregation as well as size up to 230 nm which was further encapsulated by LbL.
The drug loading of polyelectrolyte nanocapsules was efficient and could be controlled by varying the number of polyelectrolyte coatings. Polyelectrolyte coating provides the advantage of sustaining the drug release in a tunable manner using DoE concept. The use of DoE decreases the wastage, the time, as well as material by providing Fopt in the minimum number of experimental runs depending on the number of factors selected. With emerging future prospects of application of DoE in LbL self assembly, the effect of various critical processing parameters such as sonication time, porosity of multilayer, pH, and temperature on critical quality attributes like drug loading and release can be correlated and this might prove beneficial in tailoring the final product quality according to the requirement of drug and diseased condition. Further the use of design space can provide useful information related to scale up of process which is of uttermost importance. The incorporation of targeting ligands in multilayer can be used for developing site-directed and stimuli-responsive drug-delivery systems.
Acknowledgments
The authors are thankful to Glenmark Pharmaceutical Ltd., Nasik, India, for providing Lornoxicam. The facilities provided by the Management and Principal of H. R. Patel Institute of Pharmaceutical Education and Research cannot be left unacknowledged.
Declaration of interest
The authors report no declarations of interest. The authors alone are responsible for the content and writing of the paper.
References
- Adi A, Moawia A. 2007. Encapsulation of ketoprofen for controlled drug release. Eur J Pharm Biopharm. 66:48–54.
- Antipov A, Sukhorukov G, Donath E, Mohwald H. 2001. Sustained release properties of polyelectrolyte multilayer capsules. J Phys Chem. 105:2281–2284.
- Arys X, Jonas A, Laschewsky A, Legras R. 2000. Supramolecular polyelectrolyte assemblies. Ciferri A, Ed. New York: Marcel Dekker;505–563.
- Balabushevitch N, Sukhorukov G, Moroz N. 2001. Encapsulation of proteins by layer-by-layer adsorption of polyelectrolytes onto protein aggregates: factors regulating the protein lease. Biotech and Bioeng. 76:207–213.
- Balfour J, Fitton A, Barradell L. Lornoxicam . 1996. A review of its pharmacology and therapeutic potential in the management of and inflammatory conditions. Drugs. 51: 639–657.
- Bazylinska U, Pietkiewicz J, Saczko J, Nattich-Rak M, Rossowska J, Garbiec A, et al. 2012a. Nanoemulsion-templated multilayer nanocapsules for cyanine-type photosensitizer delivery to human breast carcinoma cells. Euro J Pharm Sci. 47:406–420.
- Bazylinska U, Warszynski P, Wilk KA. 2012b. Influence of pH upon in vitro sustained dye-release from oil-core nanocapsules with multilayer shells. Bioelectrochemistry. 413:266–272.
- Bingbing J, John B, Bingyun L. 2009. Advances in polyelectrolyte multilayer nanofilms as tunable drug delivery systems. Nanotechol Sci Appl. 2:21–27.
- Bertrand P, Jonas A, Laschewsky A, Legras R. 2001. Ultrathin polymer coatings by complexation of polyelectrolytes at interfaces: suitable materials, structure and properties. Macromol Rapid Comm. 21:319–348.
- Buscher K, Graf K, Ahrens H, Helm CA. 2002. Influence of adsorption conditions on the structure of polyelectrolyte multilayers. Langmuir. 18:3585–3591.
- Caruso F, Caruso R, Mohwald H. 1998. Nano engineering of inorganic and hybrid hollow spheres by colloidal templating. Science. 282:1111–1114.
- Caruso F, Yang W, Trau D, Renneberg R. 2000. Microencapsulation of uncharged low molecular weight organic materials by polyelectrolyte multilayer self-assembly. Langmuir. 16:8932–8936.
- Cheung J, Stockton W, Rubner M. 1997. Molecular-level processing of conjugated polymers. 3 layer-by-layer manipulation of polyaniline via electrostatic interactions. Macromolecules. 30:2712–2716.
- De BJ, Smilde A, Doornbos D. 1988. Introduction of multi-criteria decision making in optimization procedures for pharmaceutical formulations. Acta Pharmaceutica Technologica. 34:34–37.
- Decher G. 1997Fuzzy nanoassemblies: toward layered polymeric multicomposites. Science. 277:1232–1237.
- Decher G, Hong J, Schmitt J. 1992. Build-up of ultrathin multilayer films by a self-assembly process: III. Consecutively alternating adsorption of anionic and cationic polyelectrolytes on charged surfaces. Thin Solid Films. 210–211:831–835.
- Delcea M, Möhwald H, Skirtach AG. 2011. Stimuli-responsive LbL capsules and nanoshells for drug delivery. Adv Drug Deliv Rev. 63:730–747.
- Deshmukh P, Ramani K, Singh S, Tekade A, Chatap V, Patil G, et al. 2013. Stimuli-sensitive layer-by-layer (LbL) self-assembly systems; Targeting and biosensory applications. J Control Release. 166: 294–306.
- Dong H, Lui HJ, Jianyun L. 2005. Multilayer films fabricated from oppositely charged polyphenylene dendrimers by electrostatic layer-by-layer assembly. Macromo Chem Phys. 206:52–58.
- Frank C, Corinna S, Dirk G. 1999. Core-shell particles and hollow shells containing metallo-supramolecular components. Chem Mater. 11:3394–3399.
- Hamza YE, Aburahma MH. 2009. Design and in vitro evaluation of novel sustained-release double-layer tablets of lornoxicam: utility of cyclodextrin and xanthan gum combination. AAPS Pharm Sci Tech. 10:1357–1367.
- Hirsjärvi S, Qiao Y, Royere A, Bibette J, Benoit JP. 2010. Layer-by-layer surface modification of lipid nanocapsules. Eur J Pharm Biopharm. 76:200–207.
- Homdrum E, Likar R, Nell GX. 2006. Rapid: a novel effective tool for pain treatment. Euro Surg. 38:342–352.
- Hoshi T, Akase S, Anzai J. 2002Preparation of multilayer thin films containing avidin through sugar-lectin interactions and their binding properties. Langmuir. 18:7024–7028.
- Hua H, Steven A, Jonesa S, De VM, Lvov Y. 2003. Nano-encapsulation of furosemide microcrystals for controlled drug release. J Control Release. 86:59–68.
- Ikeda A, Hatano T, Shinkai S, Akiyama T, Yamada S. 2001. Efficient photocurrent generation in novel self-assembled multilayers comprised of [60] fullerene-cationic homooxacalix[3]arene inclusion complex and anionic porphyrin polymer. J Am Chem Soc. 123:4855–4856.
- Iller R. 1996. Multilayers of colloidal particles. J Colloid and Interface Sci. 21:569–594.
- Jiafu S, Lei Z, Zhongyi J. 2011. Facile construction of multicompartment multienzyme system through layer-by-layer self-assembly and biomimetic mineralization. ACS Appl Mater Inter. 3:881–889.
- Jinyu C, Lan H, Liming Y, Guobin L, Zhao X, Cao W. 1999. Self-Assembly Ultrathin Films Based on Diazoresins. Langmuir. 15:7208–7212.
- Keller S, Kim H, Mallouk T. 1994. Layer-by-layer assembly of intercalation compounds and hetero structures on surfaces: Toward molecular “beaker” epitaxy. J Am Chem Soc. 116:8817–8818.
- Kidd B, Frenzel WA. 1996. Multicenter, randomized, double blind study comparing lornoxicam with diclofenac in osteoarthritis. J Rheumatol. 1605–1611.
- Kim B, Park S, Hammond P. 2008. Hydrogen-bonding layer-by- layer-assembled biodegradable polymeric micelles as drug delivery vehicles from surfaces. ACS Nano. 2:386–392.
- Kim JY, et al. 2013. Multilayer nanoparticles for sustained delivery of exenatide to treat type 2 diabetes mellitus. Biomaterials.34: 8444–8449.
- Kotov N. 1999. Layer-by-layer self-assembly: the contribution of hydrophobic interactions. Nanostruct Mater. 12:789–796.
- Mak WC, Cheung KY, Trau D. 2008. Influence of Different Polyelectrolytes on Layer-by-Layer Microcapsule Properties: Encapsulation Efficiency and Colloidal and Temperature Stability. Chemi Mater. 20:5475–5484.
- Manju S, Sreenivasan K. 2011. Enhanced drug loading on magnetic nanoparticles by layer-by-layer assembly using drug conjugates: blood compatibility evaluation and targeted drug delivery in cancer cells. Langmuir. 27:14489–14496.
- Miryam G, Rivka B, Ben M, Haim L, Alexander V, et al. 2010. Rapid formation of coordination multilayers using accelerated self- assembly procedure. Langmuir. 26:7277–7284.
- Morton SW, Poon Z, Hammond PT. 2013. The architecture and biological performance of drug-loaded LbL nanoparticles. Biomaterials. 34:5328–5335.
- Park MJ, Balakrishnan P, Yang SG. 2013. Polymeric nanocapsules with SEDDS oil-core for the controlled and enhanced oral absorption of cyclosporine. Int J Pharm. 441:757–764.
- Patil GB, Ramani KP, Pandey AP, More MP, Patil PO, Deshmukh PK. 2013. Fabrication of Layer-By-Layer Self-Assembled Drug Delivery Platform for Prednisolone. Polymer Plastic Tech Engg. 52:1637–1644.
- Ramasamy T, Tran TH, Choi JY, Cho HJ, Kim JH, Yong CS, et al. 2014. Layer-by-layer coated lipid–polymer hybrid nanoparticles designed for use in anticancer drug delivery. Carbohydr Polym.102:653–661.
- Rawal N, Kroner K, Simin GM, Hejl C, Likar R. 2010. Safety of lornoxicam in the treatment of postoperative pain: a postmarketing study of analgesic regimens containing lornoxicam compared with standard analgesic treatment in 3752 day-case surgery patients. Clin Drug Investig. 30:687–697.
- Renee C, Amy L, Byeong-Su K, Hammond P. 2009. Hydrophobic effects in the critical destabilization and release dynamics of degradable multilayer films. Chem Mater. 21:1108–1115.
- Riad W, Moussa A. 2008. Lornoxicam attenuates the hemodynamic responses to laryngoscopy and tracheal intubation in the elderly. Eur J Anaesthesiol. 25:732–736.
- Rodriguez EC, Jager A, Jager E, Stepanek P, Bologna AA, Guterres SS, et al. 2011. Polymeric nanocapsules ultra stable in complex biological media. Colloids Surf B Biointerfaces. 83:376–381.
- Sandeep R, Prabir K, Swastik K. 2009. Ionically self-assembled polyelectrolyte-based carbon nanotube fibers. Chem of Mater. 21:3062–3071.
- Sato M, Sano M. 2005. Vander Waals layer-by-layer construction of a carbon nanotube 2-D network. Langmuir. 21:11490–11494.
- Serizawa T, Hamada K, Kitayama T, Fujimoto N, Hatada K, Akashi M. 2000. Stepwise stereo complex assembly of stereo regular poly (methylmethacrylate) on a substrate. J Am Chem Soc. 122: 1891–1899.
- Shimazaki Y, Mitsuishi M, Ito S, Yamamoto M. 1998. Preparation and characterization of the layer-by-layer deposited ultrathin film based on the charge-transfer interaction in organic solvents. Langmuir. 14:2768–2773.
- Shu S, Zhang X, Wu Z, Wang Z, Li C. 2010. Gradient cross-linked biodegradable polyelectrolyte nanocapsules for intracellular protein drug delivery. Biomaterials. 31:6039–6049.
- Skjodt N, Davies N. 1998. Clinical pharmacokinetics of lornoxicam. A short half-life oxicam. Clin Pharmacokinetics. 34:421–428.
- Sukhorukov G, Donath E, Lichtenfeld H. 1998. Layer-by-layer self assembly of polyelectrolytes on colloidal particles. Colloids Surf A Interf. 137:253–266.
- Sun Y, Sun YL, Wang L, Ma J, Yang YW, Gao H. 2014. Nanoassembles constructed from mesoporous silica nanoparticles and surface-coated multilayer polyelectrolytes for controlled drug delivery. Microporous Mesoporous Mater. 185:245–253.
- Uhrich K, Cannizzaro S, Langer R, Shakesheff K. 1999. Polymeric systems for controlled drug release. Chem Rev. 99:3181–3198.
- Vergara D, Bellomo C, Zhang X, Vergaro V, Tinelli A, Lorusso V, et al. 2012. Lapatinib/Paclitaxel polyelectrolyte nanocapsules for overcoming multidrug resistance in ovarian cancer. Nanomedicine. 8:891–899.
- Wolh B, Enqbersen J. 2012. Responsive layer-by-layer materials for drug delivery. J Control Release. 158:2–14.
- Yan S, Zhu J, Wang Z, Yin J, Zheng Y, Chen X. 2011. Layer-by-layer assembly of poly (L-glutamic acid)/chitosan microcapsules for high loading and sustained release of 5-fluorouracil. Eur J Pharm Biopharm. 78:336–345.
- Zhang J, Chua L, Lynn D. 2004. Multilayered thin films that sustain the release of functional DNA under physiological conditions. Langmuir. 20:8015–8021.