
Abstract
The development of intestinal polyps in an orthotopic colorectal mouse model, receiving a probiotic yogurt formulation containing microencapsulated live Lactobacillus acidophilus cells was investigated. The expression of various immunohistochemical markers namely CD8, Mac-1, Ki-67, and cleaved caspase-3, was evaluated. Results suggest that the probiotic formulation decreases overall intestinal inflammation. Mice receiving the probiotic formulation were found to develop almost two-fold fewer tumors in the small intestines. In the large intestine, however, there was no significant difference observed among polyp numbers. The formulation appears to have potential application in the prevention of various GI pathological conditions.
Introduction
Colorectal cancer (CRC) leads to significant cancer-related morbidity and mortality in most industrialized countries (CitationHaggar and Boushey 2009). CRC includes hereditary, sporadic, and colitis-associated CRC. In addition to somatic mutations and epigenetic changes, epidemiologic and experimental evidence strongly suggests chronic inflammation as a risk factor for developing CRC (CitationKatoh et al. 2013). During tumor development, immunological interactions between cancer cells and host immune cells are believed to play an important role in regulating tumor cell growth (CitationCoussens and Werb 2002, CitationStrober et al. 2007). There are a large number of biomarkers, for instance cyclooxygenase 2 (COX-2) enzyme and COX-2 derived prostaglandin E2 (PGE2) (CitationLauritsen et al. 1986, CitationSinger et al. 1998) IL-6 and Stat3 (CitationGrivennikov et al. 2009), IL-23 and IL17 (CitationGrivennikov et al. 2012) that can be used to detect the immune cell activation of the host which when quantified, can serve as a tool to track the progress of the disease. The generation of inflammatory changes is largely dependent upon the activation of T cells, release of various cytokines and a massive infiltration of neutrophils, lymphocytes, and monocytes into the inflamed intestinal tissue (CitationKatoh et al. 2013). In addition, TNFα and IL-1β are essential in the initiation of chronic inflammation, and their role via the activation of NFκB pathways has provided a strong link to cancer (CitationTu et al. 2008). Human CRC was analyzed for expression of CD8 + T cells and Ki-67 and a double immunohistochemistry confirmed higher proliferative activity of CD8 + T cells within cancer cell nests (CitationNaito et al. 1998). Similarly, Buckley et al. observed tumor killing by activated CD8 + T cells and NK cells in 75% of patients with advanced CRC immunized with human anti-idiotypic antibody 105AD7 that mimics the CD55 antigen, present in 70–80% of colorectal tumors (CitationAustin et al. 1998).
While there is a strong association between chronic inflammation and CRC in inflammatory bowel disease (IBD) patients, studies evaluating this relationship still aim to improve our understanding and gain more insight into both physiological pathways and therapeutic strategies. For instance, the disruption of immune homeostasis in the intestine in response to the gut flora, which contains foreign luminal antigens from food and commensal bacteria, can result in the development of IBD (CitationKatoh et al. 2013). Furthermore, the importance of flora for IBD is evident by the observations that antibiotic treatment and/or probiotic therapy have been shown to be beneficial for, as least, some of IBD patients (CitationGionchetti et al. 2003, CitationSutherland et al. 1991, CitationIannitti and Palmieri 2010). While histology is considered the gold standard for evaluating the presence of various biomarkers, their quantification remains challenging due to the unavailability of relevant tools and unestablished methods. Moreover, a clinical diagnosis without histological examination of the tissue of interest may miss potentially serious conditions, including malignant lesions.
Growing evidence suggests that as the expression of COX-2 is increased in colorectal tumors, this elevation can protect intestinal epithelial cells from apoptosis (CitationTsujii and DuBois, 1995, CitationChan et al. 1998). Furthermore, a study demonstrated that the symbiotic combination of resistant starch and Bifidobacterium lactis has exerted a pro-apoptotic action in response to the carcinogen azoxymethane (CitationLe Leu et al. 2005, CitationLe Leu et al. 2010). Inflammation is a local, protective response to microbial invasion or injury. Direct evidence for the role of luminal flora came from animal studies showing that chronic colitis is dependent on their presence (CitationElson et al. 2005). The intestinal epithelium is a highly proliferative single-layer epithelium, inhabited by large and dynamic populations of bacterial species. With the advancement of metagenomic technology, our knowledge of the diversity of bacterial species has expanded rapidly beyond the list obtained from traditional microbiological methods, by which many gut bacteria are not culturable (CitationQin et al. 2010). Around 15 000 to 36 000 species of bacteria have now been identified in the human gastrointestinal tract using culture-independent rRNA sequence analysis (CitationFrank et al. 2007, CitationFrank and Pace 2008).
In an attempt to assess the relative immunomodulatory contribution of microencapsulated live Lactobacillus acidophilus cells, as described before (CitationBhathena et al. 2008, CitationUrbanska et al. 2007, CitationBhathena et al. 2007) in the prevention and/or suppression of intestinal polyps formation, various inflammatory biomarkers were quantified and their expression levels were correlated to disease progression. In the current study, we hypothesized that probiotic microorganisms interfere with the expression of the various immunological markers and we aimed to quantify their effects on the onset of polyp formation, using histochemical methods, in an orthotopic APC (Min/+) model of intestinal carcinogenesis. The ApcMin mouse is a well-established animal model to study intestinal tumorigenesis and is used to study the impact of various factors including genetics, diet or different chemical compounds on the incidence of polyp formation in the intestines (CitationAhn and Ohshima 2001).
ApcMin mice have a germ-line nonsense mutation at codon 850 of adenomatous polyposis coli (Apc) gene and spontaneously develop multiple polyps in the small and large intestines at the age of 10–12 weeks (CitationSu et al. 1992). In this study, biomarkers of apoptosis or apoptosis-related gene products consisted of antibodies recognizing single-stranded DNA (ssDNA), the Ki-67 antigen and cleaved (activated) caspase-3 in normal and neoplastic tissues was investigated (CitationDeckert-Schluter et al. 1998, CitationKonstantinidou et al. 2001). Furthermore, the host immune responses to the delivered therapeutics were evaluated by monitoring the immune cell infiltration to the tumor stroma; the expression of CD8, a marker for cytotoxic T-cells and natural killer (NK) cells was also studied. The expression of Mac-1, a complement receptor expressed on the surface of macrophages and polymorphonuclear leukocytes was quantified using a custom image processing algorithm. Investigating a set of biomarkers in response to the probiotics will contribute to the development of microencapsulated probiotics.
Materials and methods
Materials
Sodium alginate (low viscosity), poly-L-lysine hydrobromide (MW = 27,400) and calcium chloride (A.C.S. reagent) were purchased from Sigma-Aldrich, Canada. Difco TM Lactobacilli MRS AGAR and Difco TM Lactobacilli MRS BROTH were purchased from Becton, Dickinson and Company Sparks, USA. Liberty plain yogurt 2% M. F. was procured from a local grocery store.
Bacteria and culture condition
L. acidophilus cells were purchased from ATCC (314) (Manassas, VA) and were cultivated and serially propagated in the MRS medium. Incubations were performed at 37°C in a Professional Sanyo MCO-18M Multi-Gas Incubator under anaerobic conditions (1–2% CO2, Atmosphere Generation System AnaeroGenTM; Oxoid Ltd., Hampshire, England). Bacteria cells were harvested after 20 hours of the third passage for microencapsulation.
Microencapsulation method
The bacterial strains were microencapsulated into Alginate-Poly-L-Lysine-Alginate (APA) membranes. APA microcapsules were prepared aseptically using an Inotech Encapsulator® IER-20 (Inotech Biosystems Intl. Inc. Switzerland). Freshly prepared microcapsules were washed twice with 0.85% saline and stored at 4°C. Parameters for microencapsulation were as follows: gelation time in CaCl2—30 minutes, coating time—10 minutes, nozzle diameter—300 μm, vibrational frequency—918 Hz, voltage—above 1.00 kV and current—2 amp. APA microcapsules loaded with L. acidophilus bacterial cells were carefully mixed with Liberty plain yogurt 2% M.F. and 0.85% saline in the proportions of 3:1, respectively. They were stored at 4°C until further use.
Experimental animals
Male C57BL/6J-ApcMin/+, abbreviated ApcMin, mice 5 or 6 weeks old were obtained from The Jackson Laboratory (Bar Harbor, ME). Control (n = 24) animals were gavaged 0.3 mL of 0.85% saline solution and treatment (n = 24) animals were gavaged with APA microencapsulated L. acidophilus bacterial cells blended in 2% M.F. yogurt. Statistical significance was calculated using the unpaired Student's t-test assuming unequal variance, and a P-value less than 0.05 was considered to indicate significant difference. Animals were weighed individually every week and their food consumption was recorded. The animal use protocol was approved by the Animal Care Committee of McGill University and animals were cared for in accord with the Canadian Council on Animal Care (CCAC) guidelines.
Preparation of microscopic sections
In order to preserve the cell and tissue structures, specimens were fixed with 10% formaldehyde. The material was then incubated overnight in the refrigerator (4°C) for fixation. After fixation, the tissues were immersed in 15% sucrose/PBS (˜× 10 volume) at 4°C with gentle rocking for 4 hours. Overnight incubation in 30% sucrose/PBS (˜× 10 volume) at 4°C with gentle rocking followed. The samples were flash frozen and 4 μm sections were cut in the cryostat with a manual cryotome.
Polyp scoring
Polyp scoring was performed by a technician blinded to the treatment. The observed lesions were divided into two categories based on the size of the lesion: gastrointestinal intraepithelial neoplasia (GIN)(< 1 mm) and adenoma (> 1 mm). The standards for the histological assessment were established from the NCI Mouse Models of Human Cancers Consortium —sponsored symposium and are detailed on the MMHC web site: (http://emice.nci.nih.gov/). In addition, the counted polyps were graded as follows: (small intestines) no polyps: score 0; up to 5: score 1; up to 10: score 2; from 11 to 15: score 3 and above 15: score 4; (large intestines) no polyps: score 0; up to 1: score 1; up to 2: score 2; up to 3 score: 3; up to 4 score: 4 and above 5: score 5.
Immunohistochemistry
CD8, Mac-1 staining
Embedded tissue blocks were cut serially. Slides were stained for hematoxylin and eosin (H&E) for histopathological evaluation and the remaining were used for immunohistochemistry. A standard avidin–biotin complex (ABC) method was used for immunohistochemistry (Vector Laboratories, Burlingame, California, USA). Briefly, 4-μm thick cryostat sections were fixed in ice-cold acetone and rehydrated in 10 mM of sodium phosphate, pH 7.5, 0.9% saline (PBS). The slices were incubated with the biotinylated antimouse CD8a monoclonal antibody or the biotinylated antimouse Mac-1 monoclonal antibody, both from Cedarlane (Hornby, Ontario, Canada). The slices were washed in Tris Buffered Saline (TBS) and incubated with Vectastain Elite ABC kit (Vector Laboratories, Burlingame, CA). The slides were again washed in TBS, and developed with 3,3’- diaminobenzidine peroxidase (DAB) substrate kits of Vector Laboratories or Zymed Laboratories (South San Francisco, CA) for CD8 and Mac-1 analysis, respectively. All kits were used according to the manufacturers’ instructions. The slides were counterstained with hematoxylin and methyl green for CD8 and Mac-1 analysis, respectively. They were mounted with VectaMount AQ mounting medium and VectaMount mounting medium (VectaMount AQ, Vector Laboratories, Inc.) for CD8 and Mac-1 analysis, respectively. Negative control samples were produced by incubating the samples in TBS plus 1% BSA without either of the biotinylated primary antibodies.
Ki-67 and cleaved-caspase-3 staining
De-paraffinization of tissues was performed using xylene solution twice for 10 minutes, (× 3 changes 10 mins), followed by rehydration in ethanol baths of descending ethanol concentrations; 100% EtOH (5 mins), 90% EtOH (2 mins), 80% EtOH (2 mins), 70% EtOH (2 mins) and 30% (2 mins) followed by dH2O. Next, the slides were washed in TBS with 0.05% Tween 20. Slides were placed in a hot target retrieval solution (95°C) and incubated for 20 minutes. They were allowed to cool down and rinsed with distilled water. Diluted (1:100) in 2% BSA in PBS Ki-67 was applied to tissue and incubated overnight at 4°C. Further, slides were washed in Tween-PBS and biotinylated rabbit anti-rat antibody (Dako, Canada Inc.) (1:200) was applied to the slides and incubated for 1 hour at room temperature. Slides were incubated in Streptavidin/HRP (Dako, Canada Inc.) (1:300) for 30 minutes. After washing in Tween-PBS, slides were incubated with DAB+ chromogen for 30 minutes at room temperature. Slides were counterstained with Hematoxylin for 5 minutes. Slides were mounted with a permanent mount. Proliferative cells were identified by staining with antibodies against Ki-67 (Dako Canada Inc.). Apoptotic cells were stained with an antibody against cleaved- caspase 3 (Cell Signalling Technology, Inc., Danvers, MA). Negative controls were performed by omitting the primary antibody.
In Situ TUNEL method
De-paraffinization of tissues was performed as described above. The slides were washed in PBS buffer for 30 mins at RT. Subsequently, tissues were digested for 30 minutes with Proteinase K (Roche). The TUNEL method was carried out according to manufacturer's instructions (Roche). Briefly, 450 μL of label solution was added to 50 μL enzyme solution and mixed to equilibrate components. Fifty microliters of reaction mixture was added onto each slide and the sections were incubated for 60 mins at RT in a humidified atmosphere chamber in the dark. Lack of TdT in the TUNEL mix completely abolished labeling under all working conditions and therefore served as TUNEL negative control. Tissue sections were analyzed in a drop of PBS buffer under a fluorescence microscopy at an excitation wavelength of 450 nm and detection range of 515–565 nm. Further, signal conversion was performed using converter-POD included in the kit. Fifty microliters of it was added onto each slide and incubated for 30 mins at RT in a humidified atmosphere chamber in the dark at RT. Slides were rinsed twice with PBS and 50 μL of 0.05% DAB substrate was added onto each slide and incubated for 10 mins at RT. Next, slides were washed with PBS buffer twice and counterstained with H&E for 45–50 seconds each. The samples were mounted in an aqueous solution (VectaMount AQ, Vector Laboratories, Inc.) and covered with a coverslip to analyze under a light microscope.
Matlab analysis of immunohistochemical images
For all specimens, control and treatment tissues for each biomarker were processed identically and at the same time. All specimens were evaluated using a ScanScope XT from Aperio. Images of four randomly selected animals (from each group) for each set of biomarkers with same resolution and magnification were compared. The processed image resolution was 1072 × 910 pixels. The quantification of was performed by using custom made algorithm in Matlab (The MathWorks, Inc., Natick, MA). The algorithm consisted of converting the RGB-colored images into a gray scale images. Thresholds were set based on the intensity of picture's pixels such that the darker cells of interest were separated from the rest of the tissue. Our procedure was to reduce the threshold until extracellular noise became excessive and then raise the threshold enough to clearly isolate the segment. A ratio of the stained versus unstained segments was calculated by dividing the number of pixels above threshold divided by the total number of pixels in the image minus background pixels.
Results
Alginate-based cell microcapsules coated with poly-L-lysine (PLL) and sodium alginate, forming protective membranes, were prepared using optimized methods described before. The bacterial concentration was verified by serial dilutions using plate spread count methods. The microencapsulation yielded spherical microcapsules which were able to retain bacterial cells, and were able to grow normally when the collected supernatant was plated after manually disrupting the microcapsule membrane as described previously (CitationLe Leu et al. 2005).
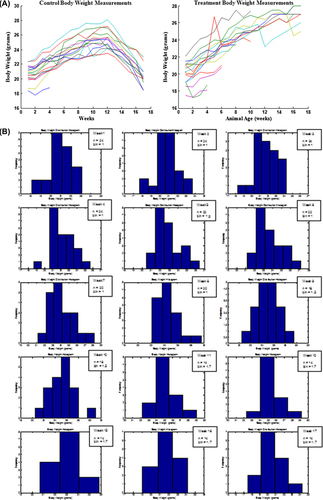
Results show that all animals in the control group (25 ± 0.5 g) and in the treatment group (25 ± 1.4 g) gained weight steadily up to the 16th week of age. The animals maintained a constant weight until 17 weeks of age, after which the weight of animals in the in control group decreased to 20 ± 0.4 g whereas treatment group animals continued to increase their weight up to 27 ± 0.3 g at the time of sacrifice (17th week of treatment) (p < 0.05). Food consumption was consistent with body weight gain and loss. In every week after the 14th week of age, mice in the control group had lower consumption than treatment group animals (p < 0.05). The normal distribution of animal body weights further confirms the weight loss in control animals versus in the treatment group (). MatLab analysis revealed that the population weight histogram was unimodal and near Gaussian, which proves that ANOVA tests were applicable (). This difference between groups in their food intake and body weights demonstrates that the probiotic containing formulation may have had a beneficial effect on the animals, especially in their last 6 weeks of life.
Figure 1. The effect of daily gavage of microencapsulated live L. acidophilus cells in 2% (milk fat) M.F. yogurt to ApcMin mice on animal body weights: normal distribution of body weights for each animal (A); Histograms representing weekly animal body weight distribution (weeks:1–12,15–17, n = sample size, b = bin (g)); size selected so the histogram of the simulated Gaussian function exhibits the expected normal distribution (B). Data represent the mean ± SEM per group; n = 24.
Further, we assessed the efficacy of the microencapsulated live L. acidophilus cells on animal tumorigenesis using histochemical analysis. Using H&E-stained intestine tissue samples, the actual number of adenomas were scored and classified according to their size. The oral administration of the probiotic yogurt formulation significantly reduced the total number of intestinal tumors when compared to animals receiving saline (p < 0.05). There were, on average, 4.5 ± 1.46 tumors found per animal in the control group and 2.5 ± 1.60 tumors in the treatment group (). Most polyps were small GINs (GIN): a total of 66 in the small intestines of the control group animals and 42 in the large intestines of treatment-receiving animals. In general, adenomas found in the colons of control group (4) and treatment group animals (2) were less frequent. This is a 44% decrease in the total number of adenomas in probiotic formulation receiving animals when compared to control group animals. The number of tumors was scored according to 0–5 scale, and the final scores are presented in .
Table I. Enumeration, classification (A) and scoring (B) of tumors in ApcMin mice.
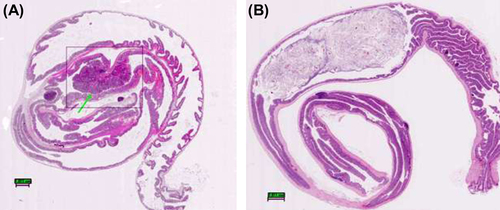
The tumors in the small intestine were in general smaller than 1 mm in diameter. The control group animals had a significantly higher polyp count. shows photomicrographs of longitudinal sections of the small intestine of representative control and treatment group animals along with their magnified areas of interest. depicts large intestines obtained from the representative animals from control and treatment groups. The occurrence of adenomas found in the large intestine is significantly lower than that found in the small intestine. From a thorough analysis of intestinal polyp morphology of all 48 animals, only one lesion resembling a malignant tumor was observed in an animal from the control group. It was characterized by a cribriform, sieve-like pattern with nuclear pleomorphism and loss of cell polarity. Additional pathology was also observed in a form of intraglandular papillary projections and the presence of flat destructed villi. The remaining animals, on average, had sessile/broad-based adenomas with either low or high grade of dysplasia. They were primarily composed of papillary projections of lamina propria covered by an epithelium.
Figure 2. Histological evaluation: intestinal changes in the small intestines of ApcMin mice; (A) Multiple lesions found in control group animal, arrows point to high- (control group) and low-grade (treatment group) adenomas; note: magnified tumor shows features resembling adenocarcinoma, with the initiation of cribriform pattern features (top arrow); Diagnosis of possible adenocarcinoma was based on cellular and nuclear pleiomorphism and loss of cell polarity. Architectural abnormalities such as the presence of intraglandular papillary projections and cribriform and solid areas were also present; the presence of flat destructed villi and intestinal glands was also observed throughout analysis of individual samples of animals from control group. (B) Microadenomas found in treatment group animal; note: the unobstructed intestinal lumen and well-defined, healthy microvilli composed of columnar epithelial cells. Magnification: 4× (left), 20× (right). All tissues were stained with hematoxylin and eosin.
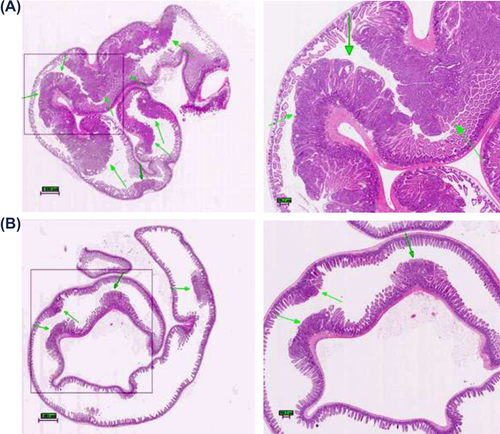
Figure 3. Histological evaluation: pathological changes in the large intestines of ApcMin mice; (A) a representative tumor found in an animal from the control group displaying features of an invasive adenoma protruding into intestinal lumen. Note: absence of Lieberkühn crypts around the adenoma. (B) a representative large intestine obtained from animal of treatment group showing completely unobstructed lumen and the absence of polyps; Original magnification: 4×. All tissues were stained with hematoxylin and eosin.
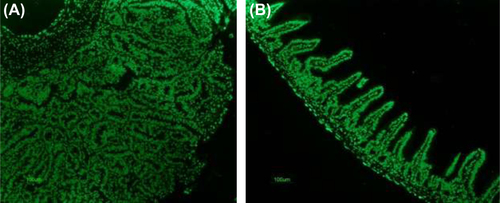
Apoptotic cells in the polyps were determined using the TUNEL method; shows a photomicrograph of the control group animal small intestine with the apoptotic cells distributed at the base and along the surface of the adenoma. The photomicrograph of well-defined villi obtained from a representative animal of the treatment group is depicted in . Because the TUNEL is a semi-qualitative method, staining against cleaved caspase-3 cells was used to quantify the expression.
Figure 4. Determination of apoptotic cells in lamina propria of the small intestine of ApcMin mice using In Situ Apoptotic Cell Labeling Method (TUNEL); (A) Slide showing a tumor found in the animal from control group, note presence of apoptotic cells primarily at the surface of the tumor, a localization of the oldest cells; magnification 40× (B) slide showing healthy microvilli found in the representative animal of treatment group, apoptotic cells are found throughout the entire length of the villi, at the base, along the crypts and at the surface, magnification 40×.
shows a photomicrograph processed using our customized MatLab program. The algorithm for analysis of immunohistochemical staining was designed to estimate the count of cells stained with antibodies, namely CD8, Mac-1, cleaved caspase-3, and Ki-67. The expression profile was quantified and represented in .
Figure 5. MatLab processing and quantification of the biomarkers; (A) representative photograph showing processed image; (B) the percent expression of CD8, Mac-1, cleaved caspase-3, and Ki-67 expressing cells in control and treatment group animals; asterisks, statistical differences (p < 0.05) when compared to control.
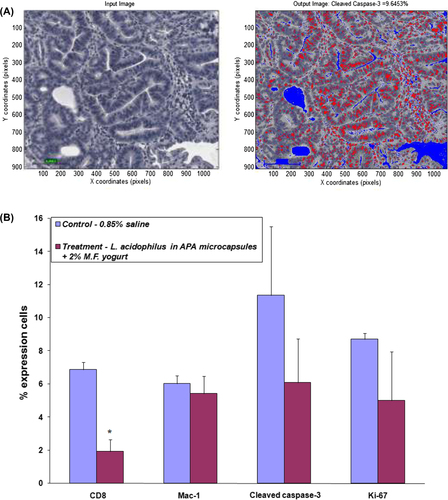
In the present study, the tissue of treatment group animals was found to express higher concentrations of CD8 cells than the tissue of animals in the control group; 1.93 and 6.87%, respectively (). Adenoma tissues, on average, contained higher CD8 cells when compared to healthy tissue staining indicating efficient recruitment of T lymphocytes during the inflammatory state. Relatively similar Mac-1 expression was found in animal tissues from both control and treatment groups—6.02 and 5.43%, respectively ().
Antibodies against CD8, Mac-1, Ki-67, and cleaved caspase-3 were used to determine the effect of probiotic treatment on the recruitment of T cells, as well as cell proliferation and apoptosis (). Cleaved caspase-3 was expressed in apoptotic cells, apoptotic bodies and in some tumor cells, mostly at the base and surface () in control group animals, whereas in treatment group animals, cleaved caspase-3 expression was localized to the nucleus and to the cytoplasm diffusely, thus it was less concentrated in the normal mucosa. Quantification using MatLab yielded 11.36 and 6.09% expression of cleaved caspase-3 in control and treatment group animals, respectively (). Ki-67 staining was observed to be lower in adenomas of treatment group animals (5.00% expression in cells) as compared with adenomas of the control group (8.72% expression) (Figures 5B and 6G, H).
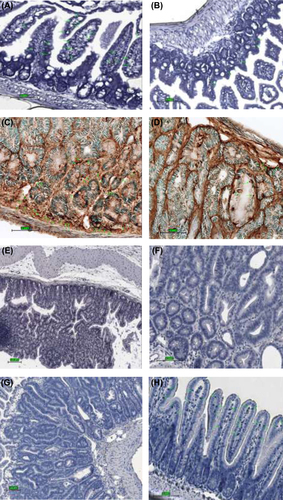
Figure 6. Immunohistochemical staining for CD8, Mac-1, cleaved caspase-3, and Ki-67 expressing cells in the small intestinal tissue from representative animals; control animal (left) and treatment animal (right). (A) higher abundance of positive CD8 cells in control group animal; magnification 40× (B) localization of CD8 cells within and around a tumorous overgrowth; magnification 40× (C) expression of Mac-1 cells in a control group animal; magnification 40× (D) scarce positive Mac-1 cells detected in treatment group animal; magnification 40× (E) staining for cleaved caspase-3: high expression of apoptotic cells in the area of the tumor with greater concentration found at the surface; magnification 20× (F) lower expression of cleaved caspase-3 cells in normal mucosa; magnification 40× (G) proliferation cells marker Ki-67 greatly present in adenoma of control group animal; magnification 20× (H) fewer Ki-67 positive cells seen within microvilli of the small intestine of the treatment group animal, see pointing arrows; magnification 20×.
Collectively, our results suggest that oral administration of the probiotic formulation may lower the expression of markers directly related to intestinal inflammation and therefore may have potential application as a dietary supplement in the modulation of certain gastrointestinal pathological conditions.
Discussion
It is known that the microflora of the gut stimulates the proliferation and differentiation of epithelial cells (CitationFooks and Gibson 2002). It is therefore postulated that the imbalance in microbiota may be due to the suppression of cell proliferation, enhancement of apoptosis within cells and restoration of microbial gut flora due to beneficial probiotic bacterial populations. The basic functions of the mucosal immune system include protection against pathogens, prevention of penetration by foreign antigens, and maintenance of mucosal homeostasis (CitationParkin et al. 2001). The knowledge of the different requirements needed to induce an effective immune response at the mucosal sites would help to define immunotherapeutic approaches and to prevent diseases. Probiotic bacteria would be good candidates to affect improvement of the mucosal immune system; however, the precise mechanisms through which they work, such as network of signals involved in GI immune response, are still unknown. Conceivable mechanisms which involve probiotic impact on development of intestinal tumors include alteration of the intestinal microflora, inactivation of cancerogenic compounds, competition with putrefactive and pathogenic microbiota, improvement of the host's immune response, anti-proliferative effects via regulation of apoptosis and cell differentiation, fermentation of undigested food, and inhibition of tyrosine kinase signaling pathways (CitationUcello et al. 2012). It has also been shown that the colonization of the gut with commensal microflora influences the development of the immune system (CitationGaldeano and Perdigon 2006).
In the evolution of intestinal tumorigenesis the imbalance between cell proliferation and apoptosis is considered one of the prominent causes of tumor induction and/or progression. Therefore studies involving the thorough evaluation of apoptotic cells are quite valuable as they provide insightful information about the process. For instance, there is much evidence that probiotics can have a role in the regulation of cell proliferation and apoptosis which are potentially crucial mechanisms in the prevention of CRC by suppressing TNF-induced NK-kB activation in a dose- and time-dependent manner (CitationIyer et al. 2008), or by altering the differentiation process of tumor cells (CitationBaricault et al. 1995). In the present study, we assessed the impact of a probiotic-containing yogurt formulation on intestinal tumorigenesis in ApcMin mice using various immunochemical markers. TUNEL, a common and reliable apoptosis detection method in tissue sections was used (CitationArai et al. 2005, CitationDonoghue et al., 1999); however, this method does not detect the early stages of apoptosis (CitationHall et al. 1992). Therefore, we chose to verify the concentration of pre-apoptotic cells and used additional cleaved caspase-3 antibody staining. As a result, we were able to detect pre-apoptotic cells and confirm a useful method in the detection of apoptosis on formalin-fixed, deparaffinized tissue sections.
An important step in the immune response system is the recruitment of lymphocytes into target tissues. Our results show significantly higher expression levels of CD8 cells in animals in the control group as compared to in the treatment group. There was no statistically significant difference detected in Mac-1 expressing cells between groups. This indicates that the recruitment of T lymphocytes was equally present in both groups. Ki-67, a marker of proliferating cells, was highly expressed in adenomas, especially within animals of the control group. No significant correlation was observed in the detection of apoptotic cells between staining with cleaved caspase-3 and Ki-67. However, the proposed link between cell proliferation and susceptibility to intestinal polyps is still being questioned by the differences in the background proliferation indices in different regions of the intestinal tract (CitationHeyman et al. 1987, CitationPotten et al. 1992). The quantitative distribution generated by MatLab was shown to contribute detailed information that further demonstrates specific antibody occurrence with respect to its size and location. Although a more diligent program is needed to fully assess the immunohistochemical analysis, we were able to show relative biomarker distribution between control and treatment groups.
Our results further demonstrate the polyp-inhibition activity of our microencapsulated probiotic live bacteria in the yogurt formulation by the significant difference in the total number of polyps per animal between groups, namely animals orally gavaged the probiotic formulation developed an average of 2.5 ± 1.60 tumors while animals in the control group developed 4.5 ± 1.46 tumors on average per animal. Although ApcMin mice provide a genetically valid model for studying and understanding intestinal tumorigenesis, its major drawback is that the variation in individual mouse tumor incidence is large and therefore it is difficult to draw consistent conclusions when comparing different animal batches. However, it must be noted that the individual treatment group animals consistently had lower numbers of tumors than the control animals. As GINs are the precursors of adenomas and eventually of intestinal carcinoma, it was interesting to note higher polyp counts of this type within control group. To further improve the effectiveness of polyp enumeration and classification along with immunohistochemical analysis, an automated system (protocol), that would allow consistency by implementing universal guidelines and standards, needs to be further designed and developed.
In theory, the oral administration of a probiotic yogurt formulation is a promising alternative modality for intestinal polyp suppression. However, the major drawback of this study is the use of ApcMin mouse which, while being the most widely used genetically engineered mouse model to study intestinal tumorigenesis, differs significantly from human form in its cancer development overall mode. For instance, in humans, carcinogenesis is a complex, multistep process which often includes metastasis. Most CRCs in human are regarded as sporadic and only a small percentage is due to an autosomal-dominant inherited syndrome (CitationHeijstek et al. 2005). The polyps found in ApcMin mice do not undergo the process of metastasis (CitationWilson et al. 1997). Furthermore, adenomas in ApcMin mice occur primarily in the small intestine, whereas tumors in humans are generally residing to the colon and rectum. Therefore, additional studies are needed to clarify the mechanism of bacterial activity and its impact on the immunomodulation of the gastrointestinal tract in mice and/or humans.
Acknowledgments
The authors also acknowledge and thank Ms. Melina Narlis for histological sample preparation.
Declaration of interest
The authors report no declarations of interest. The authors alone are responsible for the content and writing of the paper.
The authors would like to acknowledge support by a Post Graduate Scholarship from NSERC (to AMU), a Doctoral Research Award from CIHR (to JB), and research grant from CIHR and Micropharma for financial support (to SP).
References
- Ahn B, Ohshima H. 2001. Suppression of intestinal polyposis in Apc(Min/+) mice by inhibiting nitric oxide production. Cancer Res. 61:8357–8360.
- Arai M, Sasaki A, Saito N, Nakazato Y. 2005. Immunohistochemical analysis of cleaved caspase-3 detects high level of apoptosis frequently in diffuse large B-cell lymphomas of the central nervous system. Pathol Int. 55:122–129.
- Austin EB, Robins RA, Durrant LG, Price MR, Baldwin RW. 1998. Human monoclonal anti- idiotypic antibody to the tumor-associated antibody 791T/36. Immunology. 67:525.
- Baricault L, Denariaz G, Houri JJ, Bouley C, Sapin C, Trugnan G. 1995. Use of HT-29, a cultured human colon cancer cell line, to study the effect of fermented milks on colon cancer cell growth and differentiation. Carcinogenesis. 16:245–252.
- Bhathena J, Kulamarva A, Urbanska AM, Martoni C, Prakash S. 2007. Microencapsulated bacterial cells can be used to produce the enzyme feruloyl esterase: preparation and in-vitro analysis. Appl Microbiol Biotechnol. 75:1023–1029.
- Bhathena J, Kulamarva A, Martoni C, Urbanska AM, Prakash S. 2008. Preparation and in vitro analysis of microencapsulated live Lactobacillus fermentum 11976 for augmentation of feruloyl esterase in the gastrointestinal tract. Biotechnol Appl Biochem. 50:1–9.
- Chan TA, Morin PJ, Vogelstein B, Kinzer KW. 1998. Mechanisms underlying nonsteroidal anti-inflammatory drug-mediated apoptosis. Proc Natl Acad Sci. 95:681–686.
- Coussens LM, Werb Z. 2002. Inflammation and cancer. Nature. 420:860–867.
- Deckert-Schluter M, Rang A, Wiestler OD. 1998. Apoptosis and apoptosis-related gene products in primary non-Hodgkin's lymphoma of the central nervous system. Acta Neuropathol. 96:157–162.
- Donoghue S, Baden HS, Lauder I, Sobolewski S, Pringle JH. 1999. Immunohistochemical localization of caspase-3 correlates with clinical outcome in B-cell diffuse large-cell lymphoma. Cancer Res. 59:5386–5391.
- Elson CO, Cong Y, McCracken VJ, Dimmitt RA, Lorenz RG, Weaver CT. 2005. Experimental models of inflammatory bowel disease reveal innate, adaptice, and regulatory mechanisms of host dialogue with the microbiota. Immunol Rev. 206:260–276.
- Fooks LJ, Gibson GR. 2002. Probiotics as modulators of the gut flora. Br J Nutr. 88:S39–49.
- Frank DN, St Amand AL, Feldman RA, Boedeker EC, Harpaz N, Pace NR. 2007. Molecular- phylogenetic characterization of microbial community imbalances in human inflammatory bowel diseases. Proc Natl Acad Sci. 104:13780–13785.
- Frank DN, Pace NR. 2008. Gastrointestinal microbiology enters the metagenomics era. Curr Opin Gastroenterol. 24:4–10.
- Galdeano CM, Perdigon G. 2006. The probiotic bacterium Lactobacillus casei induces activation of the gut mucosal immune system through innate immunity. Clin Vaccine Immunol. 13:219–226.
- Gionchetti P, Rizzello F, Helwig U, Venturi A, Lammers KM, et al. 2003. Prophylaxis of puchitis onset with probiotic theraphy: a double-blind, placebo-controlled trial. Gastroenterology. 124:1202–1209.
- Grivennikov S, Karin E, Terzic J, Mucida D, Yu GY, et al. 2009. IL-6 and Stat3 are required for survival of intestinal epithelial cells and development of colitis-assciated cancer. Cancer Cell. 15:103–113.
- Grivennikov S, Wang K, Mucida D, Stewart CA, Schnabl B, et al. 2012. Adenoma-linked barrier defects and microbial products drive IL-23/IL-17 mediated tumor growth. Nature. 491:254–258.
- Haggar FA, Boushey RP. 2009. Colorectal cancer epidemiology: incidence, mortality, survival, and risk factors. Clin Colon Rectal Surg. 22:191–197.
- Hall C, Youngs D, Keighley MR. 1992. Crypt cell production rates at various sites around the colon in Wistar rats and humans. Gut. 33:1528–1531.
- Heijstek MW, Kranenburg O, Borel Rinkes IH. 2005. Mouse models of colorectal cancer and liver metastases. Dig Surg. 22:16–25.
- Heyman M, Corthier G, Petit A, Meslin JC, Moreau C, Desjeux JF. 1987. Intestinal absorption of macromolecules during viral enteritis: an experimental study on rotavirus-infected conventional and germ-free mice. Pediatr Res. 22:72–78.
- Iannitti T, Palmieri B. 2010. Therapeutical use of probiotic formulations in clinical practice. Clin Nutr. 29:701–725.
- Iyer C, Kosters A, Sethi G, Kunnumakkara AB, Versalovic J. 2008. Probiotic Lactobacillus reuteri promotes TNF-induced apoptosis in human myeloid leukemia-derived cells by modulation of NK-kappaB and MAPK signaling. Cell Microbiology. 10:1442–1452.
- Katoh H, Wang D, Daikoku T, Sun H, Dey SK, Dubois RN. 2013. CXCR2-expressing myeloid- derived suppressor cells are essential to promote colitis-associated tumorigenesis. Cancer Cell. 24: 631–644.
- Konstantinidou A, Korkolopoulou P, Patsouris E, Mahera H, Hranioti S, et al. 2001. Apoptosis detected with monoclonal antibody to single-stranded DNA is a predictor of recurrence in intracranial meningiomas. J Neurooncol. 55:1–9.
- Lauritsen K, Laursen LS, Bukhave K, Rask-Madsen J. 1986. Effects of topical 5-aminosalicilic acid and prednisolone on prostaglandin E2 and leukotriene B4 levels determined by equilibrium in vivo dialysis of recum in relapsing ulcerative colitis. Gastroenterology. 91:837–84.
- Le Leu RK, Brown IL, Hu Y, Bird AR, Jackson M, Esterman A, Young GP. 2005. A symbiotic combination of resistant starch and Bifidobacterium lactis facilitates apoptotic deletion of carcinogen-damaged cells in rat colon. J Nutr. 135:996–1001.
- Le Leu RK, Hu Y, Brown IL, Woodman RJ, Young GP. 2010. Synbiotic intervention of Bifidobacterium lactis and resistant starch protects against colorectal cancer development in rats. Carcinogenesis. 31:246–251.
- Naito Y, Saito K, Shiiba K, Ohuchi A, Saigenji K, Nagura H, Ohtani H. 1998. CD8 + T cells infiltrated within cancer cell nests as a prognostic factor in human colorectal cancer. Cancer Res. 58(16):3491–4.
- Parkin DM, Bray F, Ferlay J, Pisani P. 2001. Estimating the world cancer burden: Globocan 2000. Int J Cancer. 94:153–156.
- Potten CS, Kellett M, Rew DA, Roberts SA. 1992. Proliferation in human gastrointestinal epithelium using bromodeoxyuridine in vivo: data for different sites, proximity to a tumour, and polyposis coli. Gut. 33:524–529
- Qin J, Li R, Raes J, Arumugam M, Burgdorf KS, Manichanh C, et al. 2010. A human gut microbial gene catalogue established by metagenomic sequencing. Nature. 464:59–65.
- Singer II, Kawka DW, Schloemann S, Tessner T, Riehl T, et al. 1998. Cyclooxygenase 2 is induced in colonic epithelial cells in inflammatory bowel disease. Gastroenterology. 115:297–306.
- Strober W, Fuss I, Mannon P. 2007. The fundamental basis of inflammatory bowel disease. J Clin Invest. 117:514–552.
- Su LK, Kinzler KW, Vogelstein B, Preisinger AC, Moser AR, et al. 1992. Multiple intestinal neoplasia caused by a mutation in the murine homolog of the APC gene. Science. 256:668–670.
- Sutherland L, Singleton J, Sessions J, Hanauer S, Krawitt E, et al. 1991. Double blind, placebo controlled trial of metronidazole in Crohns's disease. Gut. 32:1071–1075.
- Tsujii M, DuBois RN. 1995. Alterations in cellular adhesion and apoptosis in epithelial cells overexpressing prostaglandin endoperoxide synthase-2. Cell. 83:493–501.
- Tu S, Bhagat G, Cui G, Takaishi S, Kurt-Jones EA, Rickman B, et al. 2008. Overexpression of interleukin-1 beta induces gastric inflammation and cancer and mobilizes myeloid-derived suppressor cells in mice. Cancer Cell. 14:408–419.
- Ucello M, Malaguarnera G, Basile F, D'agata V, Malaguarnera M, Bertino G, et al. 2012. Potential role of probiotics on colorectal cancer prevention. BMC Surgery. 12:S35.
- Urbanska AM, Bhathena J, Prakash S. 2007. Live encapsulated Lactobacillus acidophilus cells in yogurt for therapeutic oral delivery: preparation and in vitro analysis of alginate-chitosan microcapsules. Can J Physiol Pharmacol. 85:884–893.
- Wilson CL, Heppner KJ, Labosky PA, Hogan BL, Matrisian LM. 1997. Intestinal tumorigenesis is suppressed in mice lacking the metalloproteinase matrilysin. Proc Natl Acad Sci USA. 94:1402–1407.