
Abstract
Objective
To examine the effects of sodium pyruvate (SP) on metabolic acidosis.
Methods
For the in vivo experiments, we evaluated effects of SP on an ammonium chloride (NH4Cl)-induced hyperchloremic acidosis rat model. SP was infused at overall doses of 2, 4, and 6 mmol·kg− 1 for the SP1, SP2, and SP3 groups, respectively. Treatment with sodium bicarbonate (SB) was used as a positive control (2 mmol·kg− 1), and treatment with normal saline (NS) was used as a volume control (2 mL·kg− 1). Blood was sampled from the ophthalmic venous plexus for pH, blood gases, electrolytes, glucose, creatinine (Cr), and urea analysis after injection. For the in vitro experiment, propionate was applied to induce intracellular acidosis in human endothelial cells. Intracellular pH (pHi) was fluorimetrically measured after the addition of SP.
Results
In the in vivo study, the pH of SP1 group showed no significant difference compared with that of the NS group. The SP2 and SP3 groups had a higher pH than the NS group (P < 0.01). The SP3 group had a higher pH than the SB group (P < 0.05) and SP1 group (P < 0.05). Moreover, SP treatment ameliorated the abnormality of calcium and decreased the blood potassium levels. The SP3 group had higher glucose levels than SP1 group (P < 0.05). No significant differences were observed between all the groups in the plasma Cr and urea levels. In the in vitro study, the pHi increased immediately after the addition of SP.
Conclusion
The data suggest that intravascular treatment with SP represents a novel therapeutic strategy to ameliorate metabolic acidosis.
Introduction
Metabolic acidosis, a common acid–base disorder, is associated with increased morbidity and mortality due to its depressive effects on cardiovascular function, facilitation of cardiac arrhythmias, stimulation of inflammation, suppression of the immune response, and other adverse effects (CitationKraut and Madias 2010). Lactic acidosis, ketoacidosis, hyperchloremic acidosis, and renal tubular acidosis are the main types of metabolic acidosis in clinic. To evaluate its severity, metabolic acidosis has been divided into three forms based on the levels of blood pH: mild (pH, 7.30–7.36), moderate (pH, 7.20–7.29), and severe (pH, < 7.20). They correspond to the blood concentration of bicarbonate (cHCO3–) > 20 mmol·L− 1, 10–19 mmol·L− 1, and < 10 mmol·L− 1, respectively (Kraut and Kurtz 2012). The deleterious effects of metabolic acidosis on cellular function result from the decrease in both the extracellular pH (pHe) and intracellular pH (pHi) (CitationVenkatesh et al. 2010). Sodium bicarbonate (SB) therapy is primarily the supportive measure to metabolic acidosis in clinic, when the therapies tailored to the specific disorder are a failure. However, the rationale for using SB to treat metabolic acidosis has been debated for several years. It is reported that SB can cause serious complications including deterioration in systemic hemodynamics, metabolic alkalosis, electrolyte abnormalities, and especially pHi decline (CitationGraf et al. 1985, CitationKraut and Kurtz 2001, Citation2006, CitationShapiro et al. 1989). Though alternative base buffers such as tris-hydroxymethyl (THAM) and Carbicard have been developed, they all have potential adverse effects. THAM therapy can depress breathing and result in hyperkalemia (CitationNahas et al. 1998), while Carbicard is not currently available in clinics because its effect should be re-examined (CitationKraut and Madias 2012). Therefore, novel methods are worth studying further for the treatment of metabolic acidosis.
An ideal base therapy should have the ability to eliminate the complications of metabolic acidosis and avoid the potential adverse effects by itself. Pyruvate, known as both an endogenous metabolic substrate and an effective reactive oxygen species (ROS) scavenger (CitationNath et al. 1994), seems to be an attractive candidate molecule for the treatment of metabolic acidosis. Previous studies have focused on the protective effects of hypertonic sodium pyruvate (SP) on ameliorating organ damage and enhancing survival rate in the animal models of hemorrhagic shock and ischemic-reperfusion (CitationPetrat et al. 2011, CitationMongan et al. 2002, CitationSharma and Mongan 2010). The mechanisms considered here are that SP can inhibit inflammatory mediators such as TNF-α and NF-κB, provide additional energy to the myocardium, improve Ca2+ homeostasis, attenuate apoptosis, preserve carbohydrate metabolic pathways and promote lipid metabolism (CitationKristo et al. 2004, CitationLee et al. 2004, CitationLopaschuk et al. 2002, CitationMongan et al. 2003). Besides its anti-inflammatory and antioxidant effects, the effect of SP on increasing blood pH after resuscitation in rats suffering from lactic acidosis induced by hemorrhagic shock should also be taken into consideration. Mongan et al. used a swine model of hemorrhagic shock to study the protective effect of SP on preventing liver damage. The blood pH values of SP groups were higher than those of NaCl group after resuscitation (CitationMongan et al. 2002). Petrat et al. used a rat model of severe intestinal ischemia–reperfusion injury to study the protection of SP infusion and found that SP could increase blood pH and base excess (BE) after reperfusion (CitationPetrat et al. 2011). More importantly, it was indicated that pyruvate can increase pHi in isolated failing human myocardium (CitationHasenfuss et al. 2002).
Above studies suggested that treatment with SP may be a novel strategy to correct lactic acidosis. However, it has been reported that the mortality rate of hyperchloremic acidosis was 29% in intensive care unit (ICU, CitationGunnerson et al. 2006). This study was designed to investigate the dose-dependent effects of SP on system hyperchloremic acidosis induced by NH4Cl in vivo and intracellular acidosis induced by propionate in vitro.
Materials and methods
Animals
All experiments were approved by the Institute of Transfusion Medicine, Academy of Military Medical Sciences. All efforts were made to minimize the number of animals used and their suffering. Thirty-nine male Wistar rats (Vital River Laboratories, Beijing, China), weighing between 175 g and 225 g, were adapted to cages for 5 days before experiments. All animals received standard rodent chow and drinking water.
Induction of metabolic acidosis
Before NH4Cl (Ammonium Chloride, Sigma, USA) loading, venous blood of all rats was collected from the ophthalmic venous plexus with a heparinized centrifuge tube and analyzed immediately for pH, PaCO2, PaO2, actual cHCO3−, actual BE, cK+, cNa+, cCa2+, cCl,− and glucose (cGlu) on a blood gas analyzer (ABL 80 CO-OX, Radiometer, Denmark). To induce metabolic acidosis, the rats were administered 0.28 mol·L− 1 NH4Cl (containing 0.5% sucrose; Sucrose, Sigma, USA) in drinking water ad libitum (CitationNowik et al. 2010). Six days after NH4Cl loading, venous blood was collected and analyzed immediately for pH, blood gases, electrolytes, and glucose (T0).
Grouping and treatment protocol for the in vivo study
The rats were randomly assigned to the following five groups based on the solution infused: Group 1 SP1 (n = 8), 1 mol·L− 1 SP (Sigma, USA) solution (pH = 6.37); Group 2 SP2 (n = 8), 2 mol·L− 1 SP solution (pH = 6.32); Group 3 SP3 (n = 8), 3 mol·L− 1 SP solution (pH = 6.36); Group 4 SB (n = 8), 1 mol·L− 1 SB (Sigma, USA) solution (pH = 8.50) for a positive control; and Group 5 NS (n = 7), normal saline (0.9% NaCl; Sigma, USA) solution (pH = 7.49) for a volume control. The solution was administered for over 2 min via the tail vein (2 ml·kg− 1)(CitationDiehl et al. 2001). The dose of SP was selected on the basis of previously published investigations (CitationShapiro et al 1989, CitationDiehl et al. 2001), and it corresponded to 2 mmol·kg− 1 of SB, which was chosen based on typical initial clinical dosing for severe acidosis. The doses of SP were 2 mmol·kg− 1, 4 mmol·kg− 1, and 6 mmol·kg− 1 for the SP1, SP2, and SP3 groups, respectively. All fluids were used at room temperature. Blood was sampled from the ophthalmic venous plexus for pH, PaCO2, PaO2, actual cHCO3−, actual BE, cK+, cNa+, cCa2+, cCl,− and cGlu analysis at 15 min (T15), 30 min (T30), 60 min (T60), 120 min (T120), and 240 min (T240) after injection.
Measurement of plasma creatinine (Cr) and urea for the in vivo study
Measurement of serum Cr levels and urea levels is helpful in evaluating renal function. At T240 point, blood was collected from the ophthalmic venous plexus with a heparinized centrifuge tube and centrifuged at 1448 g for 10 min. The supernatants were used for the measurement of Cr levels and urea levels using an Automatic Analyzer (HITACHI 7020, HITACHI, Japan). Plasma Cr levels were determined using a trinitrophenol method by a Cr detection kit (CRE kit, LEADMAN, China). Urea levels were determined using glutamate dehydrogenase method by a urea detection kit (Urea kit, LEADMAN, China).
Cell culture
Human endothelial cells of the EA.hy926 cell line was purchased from China Center for Type Culture Collection (CCTCC) and was cultured in complete DMEM medium (DMEM, Gibco, USA), supplemented with 10% fetal bovine serum (FBS, Gibco, USA), 100 U·mL− 1 penicillin, and 100 μg·mL− 1 streptomycin (Penicillin-Streptomycin, Gibco, USA) in 5% CO2 at 37°C.
Intracellular acidosis cell model and measurement of pHi for the in vitro study
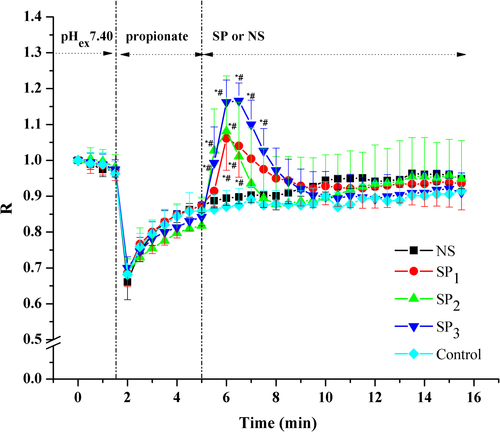
The pHi was fluorimetrically measured by a dual-excitation (488 nm and 445 nm), single-emission (535 nm) ratiometric technique using the pH-sensitive fluorophore 2,7-biscarboxyethyl-5(6)-carboxyfluorescein-acetoxymethylester (BCECF-AM, Invitrogen, USA) (CitationYoung et al. 2011, CitationHuck et al. 2007). There was a positive correlation between BCECF emission ratio (R, R = F(Ex = 488 nm/Em = 535 nm)/F(Ex = 445 nm/Em = 535 nm)) and pHi (CitationYoung et al. 2011). Briefly, EA.hy926 cells, grown on glass coverslips, were loaded with the 0.1 μmmol·L− 1 BCECF-AM in HEPES-buffered Ringer solution (HBRS) (140 mmol·L− 1 NaCl, 5 mmol·L− 1 KCl, 1 mmol·L− 1 MgCl, 1 mmol·L− 1 CaCl2, 5 mmol·L− 1 glucose, 10 mmol·L− 1 HEPES adjusted to pH 7.40) for 30 min at 37°C in darkness (CitationHuck et al. 2007). Then, glass coverslips were rinsed thrice with HBRS to remove the excess of BCECF-AM and transferred into fresh HBRS. Fluorescence was monitored by a laser scanning confocal microscope (Ultra VIEW VoX 3D Live Cell Imaging System, PerkinElmer, USA). Intracellular acidosis was induced by exposing cells to 30 mmol·L− 1 sodium propionate (sodium propionate, Sigma, USA), which reduced pHi as uncharged propionic acid (pKa 4.7) diffused into the cell and dissociated to H+ and propionate (CitationDe Hemptinne et al. 1983, CitationSpitzer et al. 2000). After 3-min equilibration in HBRS with sodium propionate, 33 mmol·L− 1, 66 mmol·L− 1, and 100 mmol·L− 1 SP was applied for the SP1 group, SP2 group and SP3 group. NS addition was performed as negative control group (NS group). No addition was performed as blank control group (Control group). R values were calculated using the Volocity software (Volocity, PerkinElmer, USA).
Statistical analysis
Results were expressed as means ± SD. Means of different groups were compared using repeated-measures analysis of covariance with Tukey–Kramer adjustment or one-way analysis of variance (ANOVA) followed by Student– Newman–Keuls test wherever appropriate. When normality and homogeneity of variance assumptions were not satisfied, non-parametric Kruskal–Wallis test was applied. Statistical significance was considered when P < 0.05. Data were analyzed using Statistical Analysis System software (SAS Version 9.2, SAS Institute, USA).
Results
NH4Cl-induced acidosis
Plasma pH (), cHCO3− (), and BE () of all groups decreased compared with the baseline values (P < 0.05), demonstrating that NH4Cl loading in drinking water for 6 days resulted in induction of metabolic acidosis. Partial respiratory compensation was shown by the decrease in PaCO2 and the elevation of PaO2. No significant differences were observed between T0 values and baseline values in the PaCO2 and PaO2 levels (). Compared with baseline values, plasma potassium concentration () in all groups showed decreasing trends without statistical significance. However, plasma sodium (), free calcium (), and chloride () concentrations increased in the rats subjected to NH4Cl loading compared with the baseline values (P < 0.05). The weight (data not shown), pH, blood gases, and electrolytes parameters did not differ significantly between groups at T0.
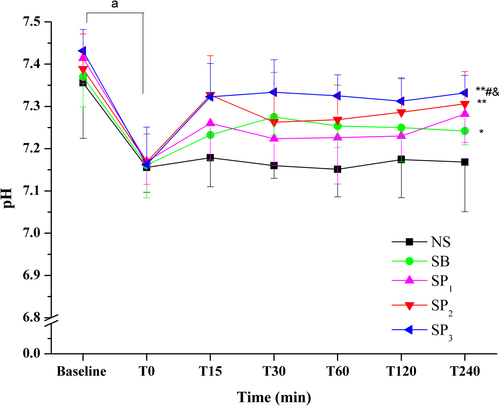
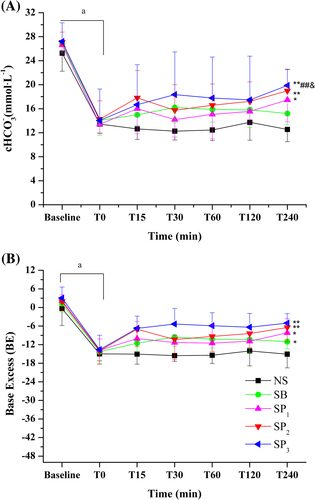
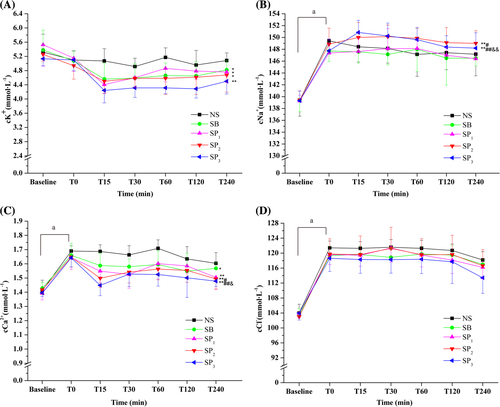
Table I. Venous Blood PaCO2 and PaO2.
Effect of pyruvate treatment on blood pH, BE, and cHCO3−
The effects of NS, SB, and SP on NH4Cl-induced acidosis were studied in this experiment. Treatment with NS had no significant effect on any of the parameters studied at all the time points. Treatment with SB or SP resulted in a prompt increase in systemic pH (), BE, and cHCO3− (). The pH of SP1 group showed no significant difference compared with that of the NS group (). The SP2 and SP3 groups had a higher pH than the NS group (P < 0.01) (). The SP3 group had a higher pH than the SP1 group (P < 0.05) (). Additionally, the pH values in the SP3 group approached to normal level (7.35–7.46) upon SP infusion at all the time points.
The pH of SB group was higher than that of the NS group (P < 0.05) (). The SP groups took 15 min to reach a peak, while the SB group took 30 min (). The pH values in the SP3 group clearly stayed above those of the SB group (P < 0.05). A notable amelioration of systemic acidosis in the SP3 group lasted for 240 min after administration (). The effect of SB on pH was most notable in the first 30 min (pH: T0, 7.16 ± 0.08; T30, 7.28 ± 0.04) but then tended to decrease. The BE and cHCO3− corresponded to the changes in the values of pH in all groups ().
Effect of pyruvate treatment on blood PaCO2 and PaO2
PaCO2 and PaO2 showed non-significant difference in all groups after administration ().
Effect of pyruvate treatment on blood electrolytes
Treatment with SP and SB decreased plasma potassium levels (). The SB, SP1, and SP2 groups had a lower potassium level than the NS group (P < 0.05) (). The SP3 group had a lower potassium level than the NS group (P < 0.01) (). No significant difference was observed between SP1, SP2, SP3, and SB groups ().
No significant differences were observed between the SP1, SB, and NS groups in the blood sodium levels (). Infusion of SP2 or SP3 resulted in higher blood sodium levels than that of NS (P < 0.01, ). The SP2 group had a higher sodium levels than the SB group (P < 0.05, ). The SP3 group had higher sodium levels than the SB group (P < 0.01) and the SP1 group (P < 0.01, ).
Infusions of SB and SP were also associated with a decrease in the blood free calcium concentrations that had increased in the acidosis (). The SP1, SP2,and SP3 groups had lower free calcium levels than the NS group (P < 0.01) (). The SB group had lower free calcium levels than the NS group (P < 0.05) (). The SP2 group had lower free calcium levels than the SB group (P < 0.05) (). Moreover, the SP3 group had lower free calcium levels than the SB group (P < 0.01) and the SP1 group (P < 0.05) ().
The chloride levels decreased moderately after treatment in all groups, and no significant differences were observed between all the groups ().
Effect of pyruvate treatment on blood glucose
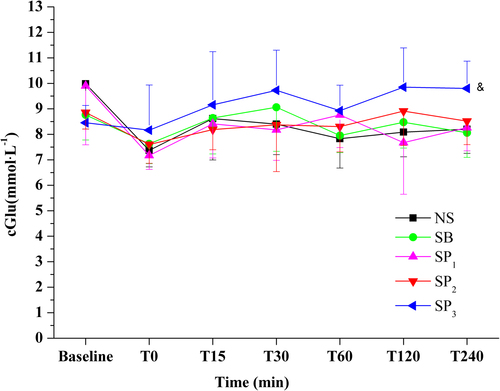
No significant differences were observed between the SP1, SP2, SB, and NS groups in the glucose levels. The SP3 group had higher glucose levels than the SP1 group (P < 0.05, ).
Effect of pyruvate treatment on plasma Cr and urea levels
No significant differences were observed between all the groups in the plasma Cr and urea levels at T240 ().
Table II. Effect of treatment on Cr and Urea levels.
Effect of pyruvate treatment on pHi levels
In the control group, sodium propionate induced a rapid decrease in pHi, corresponding to an average fall of 0.3 units in R values. Following the acidification, the pHi slowly recovered to 85% of its initial values in 3 min. The addition of NS had no effect on pHi, while the addition of SP caused a transient rise in pHi. The SP groups have a higher peak R values than the NS group (P < 0.05) and the control group (P < 0.05). No significant differences were observed between the NS group and the control group ().
Discussion
For more than 100 years, SB administration has been considered the most universal therapy for patients with metabolic acidosis (CitationKraut and Kurtz 2006, CitationNarins and Cohen 1987, CitationForsythe and Schmidt 2000). However, several studies have suggested that SB administration often increases pHe but transiently decreases pHi in several vital organs such as heart and brain (CitationArieff et al. 1982, CitationForsythe and Schmidt 2000, CitationKraut and Kurtz 2001, CitationKurtz and Madias 2010, CitationNarins and Cohen 1987, CitationShapiro et al. 1989). It is due to rapid diffusion of dissolved CO2 originating from exogenous SB into the cell, which results in the overproduction of intracellular H+ (CitationLevraut et al. 1996). The decreased pHi may result in intracellular acidosis that damages organ function. Investigators have focused on the development of agents that could increase both pHe and pHi. Lactated ringer solution and NS, the maintenance therapy with large volume infusions in clinic, didn't change the acid–base balances (CitationCosenza et al. 2013, CitationMongan et al. 2002). Thus, in the present study, we chose NS treatment as the negative control referred to in the previous study (CitationBar-Joseph et al. 1998). The in vivo and in vitro results showed that treatment with NS has no amelioration effect on metabolic acidosis. The blood pH, bicarbonate, and BE revealed that SP could ameliorate the metabolic acidosis induced by NH4Cl in vivo. In intracellular acidosis cell model, SP was found to increase pHi. Both the in vivo and the in vitro effects were dose dependent. It seems that SP may be superior to SB in the treatment of acidosis.
The amelioration effect of SP on acidosis did not solely result from its chemical buffering ability. First, the pH of SP solution that infused in our study was from 6.32 to 6.37, while the blood pH was higher than 7.0 even at T0 in acidosis. After treatment with SP, the blood pH increased. Second, pyruvate only has a weaker buffering capacity due to the dissociation constant (pKa) of 2.49 compared with HCO3− pKa of 6.36. Thus, exogenous pyruvate may ameliorate acidosis via its biochemical characteristics more than chemical buffering. We propose that it works via consuming intracellular protons in metabolic processes as follows (CitationZhou 2005):
(1) Oxidation into CO2 and H2O via the TCA cycle under aerobic conditions;
Endogenous pyruvate is converted into acetyl-CoA catalyzed by the pyruvate dehydrogenase (PDH) complex, which is the main input for the TCA cycle as part of aerobic respiration. Acetyl-CoA can be oxidized into CO2 and H2O via the TCA cycle, consuming equal molar protons in mitochondria (CitationOliver et al. 1994). Metabolic acidosis inhibits pyruvate oxidation in liver by decreasing activity of PDH (CitationToyomizu et al. 1999). Furthermore, Mongan et al. have confirmed that the administration of pyruvate resulted in the prevention of PDH deactivation during acidosis induced by hemorrhagic shock (CitationMongan et al. 2003, CitationSharma et al. 2005). Thus, we hypothesis that exogenous pyruvate may correct metabolic acidosis via the TCA cycle by supplying substrate and stimulating the activity of PDH.
(2) Reduction to lactate by lactate dehydrogenase (LDH) under hypoxic conditions;
When oxygen is absent or insufficient, endogenous pyruvate can be transformed into lactate by LDH, which regenerates NAD+ (oxidized form: nicotinamide adenine dinucleotide) from NADH (reduced form: nicotinamide adenine dinucleotide) for a continuous supply for glycolysis. The process consumes equal molar protons from the cytosolic hydrogen pool which may raise pHi and NAD+/NADH ratios. Several studies have shown that exogenous pyruvate loading can increase lactate levels and therefore provide evidence for this mechanism (CitationPetrat et al. 2011, CitationMongan et al. 2003, CitationHu et al. 2013). In addition, recent study showed that exogenous pyruvate loading increased NAD+/NADH ratios (CitationHegde et al. 2010). Hence, we assume that exogenous pyruvate may correct metabolic acidosis by being reduced to lactate.
(3) Gluconeogenesis;
Gluconeogenesis is an energy-requiring process. Exogenous pyruvate can be transformed into glucose by gluconeogenesis, consuming double molar protons (CitationBurns et al. 2001). In our study, glucose concentrations in the SP3 group were higher than those in the SP1 group. It suggests that the appropriate dose of pyruvate may promote gluconeogenesis while increasing systemic pH.
In addition, recent reports show that exogenous pyruvate can enhance hypoxia-inducible factor-1 (HIF-1) activity, which stimulates glycolytic flux by inducing the expression of glucose transporters (CitationGleadle and Ratcliffe 1997, CitationMaxwell et al. 1997) and glycometabolic enzymes including hexokinase (CitationMathupala et al. 2001), phosphoglycerate kinase 1 (CitationSemenza et al. 1994), and lactate dehydrogenase A (CitationSemenza et al. 1996). HIF-1 plays a central role in the adaptive regulation of energy metabolism and regulates many target genes. We conjecture that exogenous pyruvate may correct metabolic acidosis through regulating glycometabolism and HIF-1-related signal pathways. Further research is necessary to clarify the exact mechanisms.
Metabolic acidosis has complex effects on various plasma electrolyte levels. In our study, chloride and sodium levels increased significantly with the decreased pH for NH4Cl loading. After treatment with SP, the plasma sodium levels increased in the high-dose (SP2 and SP3) groups, and there was not significant change in SP1 and SB groups, which corresponded with the concentration of sodium infused. However, no significant differences were observed between the SP and SB groups in the anion gap (AG) which was calculated as follows: cNa++ cK+- cCl− - cHCO3− (P > 0.05, data not shown). This suggests that sodium loading from SP treatment did not change AG levels.
When metabolic acidosis occurs, the plasma free calcium level may increase immediately, because low pH reduces the binding of free calcium to albumin (CitationPederson 1972). Increased calcium adversely affects the function of most organ systems, especially the kidney, central nervous system, and cardiovascular system. In our study, high plasma free calcium concentrations were also observed in rats with decreased pH. SP3 treatment decreased the plasma free calcium concentration to near-normal levels. This suggests that SP can ameliorate the abnormality of calcium associated with acidosis.
Reports show that metabolic acidosis can increase plasma potassium concentration created by the infusion of mineral acids (NH4Cl or HCl, CitationAdrogue and Madias 1981, CitationBurnell et al. 1956, CitationOster et al. 1980). In our study, plasma potassium concentration did not increase significantly, but rather, decreased after 6 days of NH4Cl loading in drinking water, which corresponds to a recent study by Marta Nowik (2010). The contrary results may be due to the different methods of acid loading, namely the short-duration infusion way (CitationAdrogue and Madias 1981, CitationBurnell et al. 1956, CitationOster et al. 1980) and the long-duration intake method (CitationNowik et al. 2010). After treatment, both the SP and the SB groups had more decreased plasma potassium levels. In addition, a low plasma potassium level corresponded with a high pH and HCO3− levels. This is because potassium depletion can stimulate H+-K+-ATPase (CitationDoucet and Marsy 1987, CitationBuffin-Meyer et al 1977, CitationWingo 1989) activity, which may increase HCO3− re-absorption and H+ excretion in renal proximal convoluted tubule (CitationCapasso et al. 1987, CitationHays et al. 1986).
Kidneys play an important role in restoring acid–base balance. In the in vivo study, plasma Cr and urea levels increased compared with the normal values in rats because of NH4Cl-loading (CitationRoncal et al. 2007). Meanwhile, the results of Cr and urea levels suggested that SP did not aggravate the renal injury compared with SB and NS.
In summary, in the in vivo study, treatment with SP at a dose of 4 and 6 mmol·kg−1 provided notable beneficial effects on metabolic acidosis, while 2 mmol·kg−1 of SP could alleviate the acidosis partly. In the in vitro study, the pHi increased immediately after the addition of SP. Thus, intravascular treatment with SP represents a novel therapeutic strategy to ameliorate metabolic acidosis.
Limitations
Although the results of this study indicate that SP may ameliorate metabolic acidosis by the regulation of glycometabolism, the mechanisms by which exogenous pyruvate consumes intracellular protons are yet to be determined. Further research is necessary to detect the effect of exogenous pyruvate on pyruvate, lactate, PDH, and LDH levels.
Acknowledgments
The authors thank Na ZHANG and Peng-long LI for their invaluable assistance.
Declaration of interest
All authors have read and approved the manuscript for publication. No conflicts of interest, financial or otherwise, are declared by the authors. This study was supported by the National Natural Science Foundation of China (No. 31271001) and a grant from the National High Technology Research and Development Program of China (No. 2010AA021902).
References
- Adrogue HJ, Madias NE. 1981. Changes in plasma potassium concentration during acute acid-base disturbances. Am J Med. 71: 456–467.
- Arieff AI, Leach W, Park R, Lazarowitz VC. 1982. Systemic effects of NaHCO3 in experimental lactic acidosis in dogs. Am J Physiol. 242: F586–F591.
- Bar-Joseph G, Weinberger T, Castel T, Bar-Joseph N, Laor A, Bursztein S, Ben Haim S. 1998. Comparison of sodium bicarbonate, Carbicard, and THAM during cardiopulmonary resuscitation in dogs. Crit Care Med. 26:1397–1408.
- Buffin-Meyer B, Younes-Ibrahim M, Barlet-Bas C, Cheval L, Marsy S, Doucet A. 1977. K+ depletion modifies the properties of Sch-28080-sensitive K+-ATPase in rat collecting duct. Am J Physiol. 272:F124–F131.
- Burnell JM, Villamill MF, Uyeno BT, Villamil MF. 1956. The effect in humans of extracellular PH change on the relationship between serum potassium concentration and intracellular potassium. J Clin Invest. 35:935–939.
- Burns SP, Murphy HC, Iles RA, Cohen RD. 2001. Lactate supply as a determinant of the distribution of intracellular pH within the hepatic lobule. Biochem J. 358:569–571.
- Capasso G, Jaeger P, Giebisch G, Guckian V, Malnic G. 1987. Renal bicarbonate reabsorption in the rat. Distal tubule load dependence and effect of hypokalemia. J Clin Invest. 80:409–414.
- Cosenza M, et al. 2013. Effect of lactated Ringer's solution on fluid, electrolyte and acid-base balances of healthy horses, ewes and calves. Ciencia Rural43:2247–2253.
- De Hemptinne A, Marrannes R, Vanheel B. 1983. Influence of organic acids on intracellular pH. Am J Physiol Cell Physiol. 245: C178–C183.
- Diehl KH, Hull R, Morton D, Pfister R, Rabemampianina Y, Smith D, et al. 2001. A good practice guide to the administration of substances and removal of blood, including routes and volumes. J Appl Toxicol21:15–23.
- Doucet A, Marsy S. 1987. Characterization of K+-ATPase activity in distal nephron: stimulation by potassium depletion. Am J Physiol. 253:F418–423.
- Forsythe SM, Schmidt GA. 2000. Sodium bicarbonate for the treatment of lactic acidosis. Chest. 117:260–267.
- Gleadle JM, Ratcliffe PJ. 1997. Induction of hypoxia-inducible factor-1, erythropoietin, vascular endothelial growth factor, and glucose transporter-1 by hypoxia: evidence against a regulatory role for Src kinase. Blood. 89:503–509.
- Graf H, Leach W, Arieff AI. 1985. Evidence for a detrimental effect of bicarbonate therapy in hypoxic lactic acidosis. Science. 227: 754–756.
- Gunnerson KJ, Saul M, He S, Kellum JA. 2006. Lactate versus non- lactate metabolic acidosis: a retrospective outcome evaluation of critically ill patients. Crit Care. 10:R22.
- Hasenfuss G, Maier LS, Hermann HP, Lüers C, Hünlich M, Zeitz O, et al. 2002. Influence of pyruvate on contractile performance and Ca2 + cycling in isolated failing human myocardium. Circulation105:194–119.
- Hays SR, Seldin DW, Kokko JP, Jacobsen HR. 1986. Effect of K+ depletion on HCO3- transport across rabbit collecting duct segments. Kidney Int29:368A.
- Hegde KR, Kovtun S, Varma SD. 2010. Inhibition of glycolysis in the retina by oxidative stress: prevention by pyruvate. Mol Cell Biochem. 343:101–105.
- Hu S, Bai XD, Liu XQ, Wang HB, Zhong YX, Fang T, Zhou FQ. 2013. Pyruvate ringer's solution corrects lactic acidosis and prolongs survival during hemorrhagic shock in rats. J Emerg Med. 45: 885–893.
- Huck V, Niemeyer A, Goerge T, Schnaeker EM, Ossig R, Rogge P, et al. 2007. Delay of acute intracellular pH recovery after acidosis decreases endothelial cell activation. J Cell Physiol. 211:399–409.
- Kraut JA, Kurtz I. 2006. Controversies in the treatment of acute metabolic acidosis. Neph SAP. 5:1–9.
- Kraut JA, Kurtz I. 2001. Use of base in the treatment of severe acidemic states. Am J Kidney Dis. 38:703–727.
- Kraut JA, Madias NE. 2010. Metabolic acidosis: pathophysiology, diagnosis and management. Nat Rev Nephrol6:274–285.
- Kraut JA, Madias NE. 2012. Treatment of acute metabolic acidosis: a pathophysiologic approach. Nat Rev Nephrol. 8:589–601.
- Kristo G, Yoshimura Y, Niu J, Keith BJ, Mentzer RM Jr, Bunger R, Lasley RD. 2004. The intermediary metabolite pyruvate attenuates stunning and reduces infarct size in in vivo porcine myocardium. Am J Physiol. 286:H517–H524.
- Lee YJ, Kang IJ, Bunger R, Kang YH. 2004. Enhanced survival effect of pyruvate correlates MAPK and NF-κB activation in hydrogen peroxide-treated human endothelial cells. J Appl Physiol. 96: 793–801.
- Levraut J, Labib Y, Chave S, Payan P, Raucoules-Aime M, Grimaud D. 1996. Effect of sodium bicarbonate on intracellular pH under different buffering conditions. Kidney Int. 49:1262–1267.
- Lopaschuk GD, Rebeyka IM, Allard MF. 2002. Metabolic modulation: a means to mend a broken heart. Circulation. 105:140–142.
- Mathupala SP, Rempel A, Pedersen PL. 2001. Glucose catabolism in cancer cells: identification and characterization of a marked activation response of the type II hexokinase gene to hypoxic conditions. J Biol Chem. 276:43407–43412.
- Maxwell PH, Dachs GU, Gleadle JM, Nicholls LG, Harris AL, Stratford IJ, et al. 1997. Hypoxia-inducible factor-1 modulates gene expression in solid tumors and influences both angiogenesis and tumor growth. Proc Natl Acad Sci USA. 94:8104–8109.
- Mongan PD, Capacchione J, West S, Karaian J, Dubois D, Keneally R, Sharma P. 2002. Pyruvate improves redox status and decreases indicators of hepatic apoptosis during hemorrhagic shock in swine. Am J Physiol Heart Circ Physiol. 283: H1634–H1644.
- Mongan PD, Karaian J, Van Der Schuur BM, Via DK, Sharma P. 2003. Pyruvate prevents poly-ADP ribose polymerase (PARP) activation, oxidative damage, and pyruvate dehydrogenase deactivation during hemorrhagic shock in swine. J Surg Res. 112:180–188.
- Nahas GG, Sutin KM, Fermon C. 1998. Guidelines for the treatment of acidaemia with THAM. Drugs. 55:191–194.
- Narins RG, Cohen JJ. 1987. Bicarbonate therapy for organic acidosis: The case for its continued use. Ann Intern Med. 106:615–618.
- Nath KA, Enright H, Nutter L, Fischereder M, Zou JN, Hebbel RP. 1994. Effect of pyruvate on oxidant injury to isolated and cellular DNA. Kidney Int45:166–176.
- Nowik M, Kampik NB, Mihailova M, Eladari D, Wagner CA. 2010. Induction of metabolic acidosis with ammonium chloride (NH4Cl) in mice and rats–species differences and technical considerations. Cell Physiol Biochem26:1059–1072.
- Oliver FJ, Salto R, Sola MM, Vargas AM. 1994. Mitochondrial pyruvate metabolism in liver and kidney during acidosis. Cell Biochem Funct. 12:229–235.
- Oster JR, Perez G, Castro A, Vaamonde CA. 1980. Plasma potassium response to acute metabolic acidosis induced by mineral and nonmineral acids. Miner Electrolyte Metab. 4:28–36.
- Pederson KO. 1972. Binding of calcium to serum albumin. Effect of pH via competitive hydrogen and calcium ion binding to the imidazole group of albumin. Scand J Clin Lab Invest. 29:75–83.
- Petrat F, Rönn T, de Groot H. 2011. Protection by pyruvate infusion in a rat model of severe intestinal ischemia-reperfusion injury. J Surg Res167:e93–101.
- Roncal CA, Mu W, Croker B, Reungjui S, Ouyang X, Tabah-Fisch I, et al. 2007. Effect of elevated serum uric acid on cisplatin-induced acute renal failure. Am J Physiol Renal Physiol. 292:F116–F122.
- Semenza GL, Jiang BH, Leung SW, Passantino R, Concordet JP, Maire P, Giallongo A. 1996. Hypoxia response elements in the aldolase A, enolase 1, and lactate dehydrogenase A gene promoters contain essential binding sites for hypoxia-inducible factor 1. J Biol Chem. 271:32529–32537.
- Semenza GL, Roth PH, Fang HM, Wang GL. 1994. Transcriptional regulation of genes encoding glycolytic enzymes by hypoxia inducible factor 1. J Biol Chem. 269:23757–23763.
- Shapiro JI, Whalen M, Kucera R, Kindig N, Filley G, Chan L. 1989. Brain pH responses to sodium bicarbonate and Carbicarb during systemic acidosis. Am J Physiol Heart Circ Physiol. 256:Hl316–H1321.
- Sharma P, Mongan PD. 2010. Hypertonic sodium pyruvate solution is more effective than ringer's ethyl pyruvate in the treatment of hemorrhagic shock. Shock. 33:532–540.
- Sharma P, Walsh KT, Kerr-Knott KA, Karaian JE, Mongan PD. 2005. Pyruvate modulates hepatic mitochondrial functions and reduces apoptosis indicators during hemorrhagic shock in rats. Anesthesiology3:65–73.
- Spitzer KW, Ershler PR, Skolnick RL, Vaughan-Jones RD. 2000. Generation of intracellular pH gradients in single cardiac myocytes with a microperfusion system. Am J Physiol Heart Circ Physiol. 278: H1371–H1382.
- Toyomizu M, Yamahira S, Shimomura Y, Akiba Y. 1999. Metabolic acidosis inhibits pyruvate oxidation in chick liver by decreasing activity of pyruvate dehydrogenase complex. Life Sci. 65:3743.
- Venkatesh B, Morgan TJ, Cohen J. 2010. Interstitium: the next diagnostic and therapeutic platform in critical illness. Crit Care Med. 38: S630–S636.
- Wingo CS. 1989. Active proton secretion and potassium absorption in the rabbit outer medullary collecting duct. Functional evidence for proton-potassium activated adenosine triphosphatase. J Clin Invest. 84:361–365.
- Young G, Reuss L, Altenberg GA. 2011. Altered intracellular pH regulation in cells with high levels of P-glycoprotein expression. Int Biochem Mol Biol. 2:219–227.
- Zhou FQ. 2005. Pyruvate in the correction of intracellular acidosis: a metabolic basis as a novel superior buffer. Am J Nephrol. 25:55–63.