
 ?Mathematical formulae have been encoded as MathML and are displayed in this HTML version using MathJax in order to improve their display. Uncheck the box to turn MathJax off. This feature requires Javascript. Click on a formula to zoom.
Abstract
Present invention relates to design of nanostructured lipid carriers (NLC) to augment oral bioavailability of Carvedilol (CAR). In this attempt, formulations of CAR-NLCs were prepared with glyceryl-monostearate (GMS) as a lipid, poloxamer 188 as a surfactant and tween 80 as a co-surfactant using high pressure homogenizer by 23 factorial design approach. Formed CAR-NLCs were assessed for various performance parameters. Accelerated stability studies demonstrated negligible change in particle size and entrapment efficiency, after storage at specified time up to 3 months. The promising findings in this investigation suggest the practicability of these systems for enhancement of bioavailability of drugs like CAR.
Introduction
One of the most attractive areas of research in drug delivery today is the design of nanosystems that are able to deliver drugs to the right place, at appropriate time, and at the right dose. Solid lipid nanoparticles (SLN) are one of the most promising particulate type of delivery systems to improve the oral bioavailability of lipophilic drugs (CitationMehnert and Mader 2001). The goal of any drug delivery system is to provide a therapeutic amount of drug to the proper site in the body; and to achieve and maintain the desired drug concentration. SLN can improve the lymphatic uptake of drugs with poor water solubility and low bioavailability as it size ranges from 50 to 1000 nm. But SLN was found to have certain disadvantages like drug expulsion and low drug loading capacity; to overcome such limitations, nanostructured lipid carrier (NLC) has been designed as second generation of SLN (CitationMuller et al. 2002a, CitationMuller and Keck 2004, CitationAlvarez-Roman et al. 2004, CitationSchäfer-Korting et al. 2007, CitationBlasi et al. 2007, CitationLin et al. 2007). NLCs produced by controlled mixing of solid lipids with spatially incompatible liquid lipids, leads to special nanostructure with improved properties for drug loading capacity, modulation of the drug release profile, and stable drug incorporation during storage (CitationMuller et al. 2002b). Such NLCs have low crystallinity, thereby leading to ‘highest incompatibility’, higher drug loading, and minimum incidence of drug expulsion during storage. The inclusion of oil with solid lipid can produce imperfections in their lattice structure and create separation in the fatty acid chain packing, making more room for the drug. Thus, the drug molecules can be accommodated in between lipid layers and/or fatty acid chains (CitationMuller et al. 2002a). Due to these characteristics NLCs protect the drug from hepatic metabolism and overcome the disadvantages related with SLNs.
Carvedilol (CAR) is an anti-hypertensive agent used in the treatment of congestive heart failure; it also has vasodilating properties that are attributed mainly to its blocking activity at receptors. It possesses poor bioavailability (25–35%) due to its rapid hepatic first pass metabolism. Chemically, CAR is ({1-[carbazolyl-(4)-oxy]-3-[2-methoxyphenoxyethylamino] propanol-(2)}); a poorly water soluble drug with crystalline nature (CitationPotluri et al. 2011). It belongs to Biopharmaceutical Classification System (BCS) Class II, and has plasma half-life of 7–8 h. It is a highly lipophilic drug with poor aqueous solubility which results in low oral absorption (CitationParfitt 1999).
Formerly, NLCs of simvastatin were investigated for improvement in release, pharmacokinetics, and biodistribution over its SLNs (CitationTiwari and Pathak 2011), and CAR-SLNs were fabricated by using N-carboxymethyl chitosan which resulted in prevention of burst release of the SLNs in acidic medium (CitationVenishettya et al. 2012).
Therefore, the ultimate aim of the present research was to adopt a simple approach for the formulation of glyceryl-monostearate (GMS) and oleic acid based NLCs of CAR with assistance of 23 full factorial designs. Three formulation factors, that is, total lipid (%), liquid lipid (%), and surfactant (%) were studied to optimize the formulation for maximum entrapment efficiency (EE%). In addition to EE%, the particle size was also considered as a dependent parameter. NLCs of CAR were expected to overcome associated drawbacks of CAR such as low oral absorption and hepatic metabolism and fabricated by employing GMS as solid lipid, oleic acid as liquid lipid, poloxamer 188 and tween 80 as surfactant.
Experimental
Materials
CAR was received as a generous gift from Sun Pharmaceuticals, Silvassa. Tween 80 and Oleic acid were purchased from Merck, India. Poloxamer 188 was obtained as gift sample from BASF, Mumbai. GMS was purchased from Fine Chem Industries, Mumbai, India. All other chemicals used for the study were of HPLC grade. Water used in all the studies was distilled and filtered through 0.22 μm nylon filter before use.
Preparation of CAR-loaded NLC
CAR-NLCs were formulated using high pressure homogenization method. The concentration of different variables was as shown in and . Initially, GMS was melted to about 60–70°C, followed by addition of oleic acid and 15 mg of CAR (lipid phase). Poloxamer 188 and Tween 80 were dissolved in 80 ml hot distilled water (aqueous phase). The lipid phase, preheated to 10°C above the melting point of lipid, was transferred to the hot aqueous surfactant solution under stirring at 500 rpm for 20 min using a mechanical stirrer (Remi Instruments Ltd, Mumbai, India). It resulted into formation of a pre-emulsion which was subsequently homogenized in a high pressure homogenizer (Panda 2K, NiroSoavi Ltd, Italy) for 5 homogenization cycles at a pressure of 500 bars. Finally, the resultant mixture was lyophilized to yield CAR-NLC (CitationTriplett et al. 2009).
Table I. Coded values of the independent variables for CAR-NLCs.
Table II. The 23 factorial design layouts.
Experimental design
The statistical problem solving approach uses a series of small carefully designed experiments. Sometimes this statistical approach is referred as ‘Strategic Experimentation’. It involves analysis of results of few experiments and then planning the next experiment for optimization. Any statistical design consists of three small and efficient experiments, namely a screening experiment, from which few important factors affecting the process are identified, then an optimization experiment where a predictive model is built for the few factors in the region of optimum and finally, a verification experiment where the results are confirmed at the predicted settings.
Different batches of CAR loaded NLCs were planned based on the 23 factorial designs, to study the effect of different variables on its properties. Independent variables include the total lipid concentration (X1), liquid lipid concentration (X2), and surfactant concentration (X3). Physico-chemical properties of the produced NLC, that is, mean particle size (Y1) and EE% (Y2) were considered as dependent variables. For each factor, the lower and higher values of the lower and upper levels were represented by a (− 1) and a (+ 1) sign, respectively, as summarized in . A factorial design approach was applied to maximize the experimental efficiency which requires minimum experiments to optimize the CAR loaded NLC (CitationGonzalez-Mira et al. 2010).
Determination of particle size and zeta potential of CAR-NLCs
Particle size of NLC dispersion was determined using a Zetasizer (Nano ZS 90, Malvern Instruments Ltd., Malvern, UK) equipped with a 4.0 mW internal laser and based on the dynamic light scattering phenomenon. Dynamic light scattering (also known as Photon Correlation Spectroscopy) first measures Brownian motion of the particles and relates this to the size of nanoparticles based on the Stokes–Einstein equation, done by illuminating the nanoparticles with a laser beam and analyzing the intensity fluctuations in the scattered light. Prior to the measurement all samples were diluted with double-distilled water to have a suitable scattering intensity, in a disposable polystyrene cell (DTS0012). All measurements were performed at 25°C, at a scattering angle of 90°. The intensity weighed mean diameter of the bulk population of particles was given by z-average diameter value of the particles, and width of size distribution was characterized by the polydispersity index (PDI).
The zeta potential (ZP), reflecting the electric charge on the particle surface and indicating the physical stability of colloidal systems, was measured by determining the electrophoretic mobility using the Malvern Zetasizer. The measurements were performed in double-distilled water. The ZP was calculated using the Helmholtz–Smoluchowsky equation. The pH was in the range of 6.0–6.5 and the applied field strength was 20 V/cm and the average of the ZP was given from 30 runs (CitationKumar et al. 2007, CitationTrotta et al. 2003).
Determination of EE% and LE%
EE% was calculated by determining the amount of non-encapsulated CAR in the aqueous solution as reported previously. The EE% was determined by analyzing the free drug content in the supernatant obtained by diluting the suspension in 5 ml benzyl alcohol after centrifuging the NLC suspension in high speed centrifuge at 15,000 rpm for 30 min at 4°C (Cooling Centrifuge, C24, Remi Instruments Ltd., Mumbai, India). The EE% and loading efficiency (LE%) was estimated spectrophotometrically at 241.20 nm by UV-spectrophotometer using Eqs. (1) and (2), respectively, as shown below (CitationVenkateswarlu and Manjunath 2004, CitationSingh et al. 2010, CitationSouto et al. 2004).
Freeze-drying of NLCs
After preliminary characterization, the lipid dispersion was lyophilized using VirTis Benchtop Freeze Dryer (VirTis Benchtop, SP Scientifics, New York, USA), having 4.5 L capacity, at − 70°C condenser temperature for 24 h. The pre-freezing and freeze drying times, temperature, and vacuum conditions were optimized to recover completely dried nanoparticles. The vacuum was maintained at 100 mTorr. Varying concentrations of mannitol as a cryoprotectant used to get completely dry powder of NLC which were stored at − 4°C until further investigation.
FTIR spectroscopy
The freeze-dried nanoparticles were subjected to Fourier Transform Infrared (FTIR, Shimadzu IRAffinity, Japan) spectroscopy studies in order to access interaction if any between drug and lipids in mixtures. The potassium bromide (KBr) disk method was used for the preparation of sample. The IR spectrum of CAR alone was compared with spectra of lipid for any interactions ().
DSC
Differential scanning calorimetry (DSC) was performed on CAR using DSC (Mettler Toledo®, USA), placebo, and the freeze-dried CAR loaded NLCs (). The samples were put on DSC reference pan and DSC thermograms were obtained at heating rate of 10°C/min from 40 to 300°C in inert atmosphere.
SEM
The surface morphology of freeze-dried optimized formulation was studied using a scanning electron microscopy (SEM) (JSM 6390®, JEOL DATUM Ltd., Japan). Lyophilized powder of optimized formulation was dusted onto double-sided tape on an aluminum stub and coated with gold using a cold sputter coater in SEM chamber to a thickness of 400 Å, and then photomicrographs were captured by operating at an accelerating voltage of 15 kV electron beam ().
XRD
X-ray diffraction (XRD) patterns of CAR, freeze-dried NLC formulation, and placebo were obtained using X-ray diffractometer (Bruker AXS, D8 Advance, Germany) and Cu-Kα line as a source of radiation which was operated at the voltage 40 kV and current 30 mA. All samples were measured in the 2θ angle range between 100 and 600 with a scanning rate of 3°/min and a step size of 0.020 ().
In vitro release of CAR from NLC
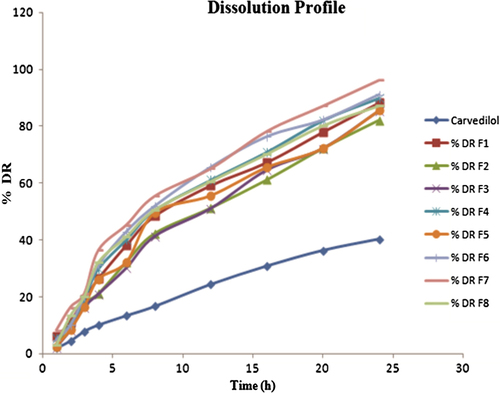
In vitro release studies were performed using phosphate buffer saline (PBS) solution (pH 6.8) using dialysis bag diffusion technique (CitationReddy et al. 2006, CitationJain and Ram 2011, CitationLiu et al. 2011). Dialysis membrane with pore size of 2.4 nm and molecular weight cut off 100 kDa was selected for study. The membrane was soaked in double-distilled water for 24 h before use. The CAR-NLCs dispersion was placed in a dialysis bag and sealed at both ends. The dialysis bag was placed in a beaker containing 250 ml of PBS solution with pH 6.8 at 37 ± 2°C as a dissolution medium and stirred magnetically at 50 rpm. Samples were withdrawn at predetermined time intervals of 1, 2, 4, 6, 8, 10, 12, 16, 20, and 24 h. Sink condition was maintained by replacing with fresh pre-warmed PBS solution at same temperature. Samples were analyzed by UV-spectrophotometer at 241.20 nm ().
Accelerated stability studies
The freeze dried powder sample of final optimized formulation (F5) was selected for accelerated stability studies as per International Conference on Harmonization (ICH) Q1A (R2) guidelines. ICH guidelines suggested long term stability at 5°C ± 3°C and accelerated stability study at 25 ± 2°C/60 ± 5% RH, for the products to be stored in refrigerator. Study was performed for assessment of stability of NLCs at 25 ± 2°C/60 ± 5% RH with respect to particle size and EE% (CitationAlex et al. 2011).
Freshly prepared freeze dried powder was filled in three different amber colored glass vials, sealed and positioned in stability chamber (CHM-10S, Remi Instruments Ltd, Mumbai, India) maintained at 25 ± 2°C/60 ± 5% RH for a period of total 3 months. The dried powder samples subjected for stability test were re-dispersed in distilled water and analyzed with a sampling interval of 1 month for particle size, and EE% of the CAR-NLCs over 3-month period.
Results and discussion
Preparation of CAR-loaded NLC
The CAR-NLCs with 30% and 40% oleic acid content, respectively, were prepared by using high pressure homogenization in an aqueous system. The homogenization cycles and the pressure underwent by the mixture was 500 bar pressure and 5 cycles to form the NLC dispersion.
Experimental design
Effect of formulation variables on particle size of nanoparticles
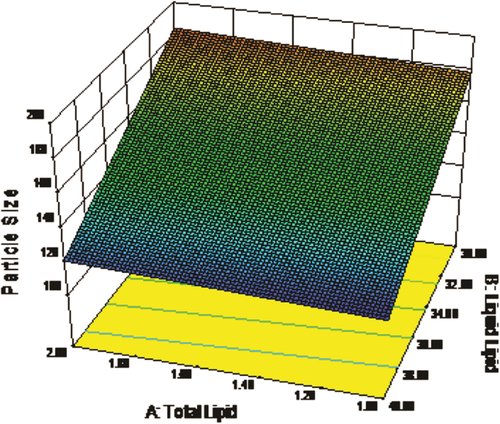
Regression coefficients for the responses Y1 (particle size) is shown in Eq. (3). It was observed that particle size was directly proportional to concentration of total lipid and inversely proportional to concentration of liquid lipid. The relationship between variables was further elucidated using response surface plot (). The lowest value of particle size was observed for formulation F5, having low value of the independent variables, which may be due to the maximum concentration of liquid lipid.
where, Y1 = particle size
X1 = total lipid
X2 = liquid lipid
Effect of formulation variables on EE
Regression coefficients for the responses Y2 (EE%) is shown in Eq. (4). As the concentration of total lipid decreased and percentage of liquid lipid increased, EE was relatively increased. The relationship between variables was further elucidated using response surface plot (). Highest value of EE was observed in optimized formulation F5.
where, Y2 = EE%
X1 = total lipid
X2 = liquid lipid
X3 = surfactant
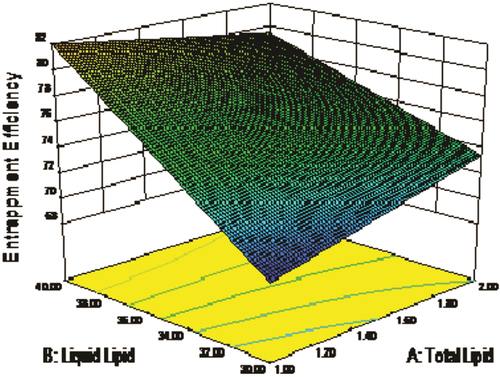
Response surface plots
Response surface plots are significant three dimensional surface curves for understanding the interaction patterns. Three dimensional response surface plots generated at different levels by the Design-Expert® software ( and ) for the studied responses, that is, particle size (Y1) and EE% (Y2). In both figures, the third factor (X3) was kept at a constant level.
In a nutshell, change in total lipid (X1) and liquid lipid (X2) concentration demonstrated significant effect on particle size and EE%, that is, increase in lipid concentration and decrease in surfactant concentration decreases the particle size and increases the EE% ( and ).
Particle size and ZP analysis
The particle size values for all batches of CAR loaded NLCs are reported in . Particle size of all formulations was found to be in the range of 110.1–194.5 nm, which is due to the varied amount of independent variables in the formulation. The particle size statistics shows that, particle size decreased as the amount of liquid lipid in the formulation increased. Polydispersity values were varied from 0.233 to 0.437, implying wide distribution in all batches, and several populations of overlapping particles.
An electric charge on each particle surface forms electrical barrier which results in ‘Repulsion phenomenon’, which is the ZP of a formulation. ZP of all batches was found to be toward negative side in the range of − 36.4 to − 25.0 mV. It supports the fact that GMS used in the formulation of CAR-NLCs possesses negative charge and there might be the presence of GMS residue which contributed the negative ZP.
EE% of NLCs
The EE% is mainly dependent on the nature of the drug and the lipid phase in which the drug is encapsulated. As the CAR is a lipophilic drug and its solubility is also greater in the GMS, the EE% was obviously found to be higher, that is, in the range of 62–85% ().
It was also observed that by increasing oil content, the percentage of encapsulated drug increases as the drug shows more solubility in the liquid lipid than the solid lipid. This might be the reason for higher EE% in NLCs. The high EE% values observed in this study indicate that the lipid and surfactant compositions employed were satisfactory for CAR entrapment in NLC.
FTIR spectroscopy
The characteristic FTIR spectra of CAR, GMS, placebo, and NLCs are shown in . CAR alone showed characteristic peaks at 1124, 2837, 3331, and 3606 cm− 1. The characteristic peaks of CAR and GMS were observed in both, that is, NLCs and its corresponding physical mixture. This suggests that there is no significant interaction between the drug and carrier.
DSC
DSC studies were performed to confirm the absence of drug-excipients interactions. The DSC thermograms of CAR, placebo, and drug loaded freeze dried NLCs are depicted in . The DSC thermogram showed a peak at 115.2°C and 80°C for CAR and placebo, respectively, while for NLC formulation had a peak at 104.6°C. Thus, DSC study revealed the absence of any chemical interaction between CAR and NLCs. CAR endothermic peak was not observed in DSC thermogram of lyophilized NLCs owing to the molecular inclusion of CAR in the lipid matrix of GMS. This suggests that CAR exists in amorphous state in NLCs.
SEM
The optimized lyophilized sample (F5) of NLCs was examined by SEM for analyzing the shape and surface morphology of the fabricated nanoparticles. All nanoparticles were appeared to be in non-spherical shape with uneven surface and flake like structure ().
XRD analysis
The XRD pattern of CAR, placebo, and CAR-NLC is shown in . The diffractogram of CAR depicted highly sharp intensity peaks at 2θ of 5.99°, 6.94°, 14.54°, 15.31°, 16.42°, 18.17°, 19.19°, 20.68°, 21.97°, 24.57°, and 26.26°, suggesting its crystalline nature. The diffraction pattern of placebo exhibited intensity peaks at 2θ of 9.86°, 14.85°, 17.48°, 19.09°, 20.59°, 23.41°, and 25.31°. CAR-NLCs showed low and diffused intensity peaks at 2θ of 9.87°, 13.83°, 14.80°, 17.45°, 18.92°, 20.56°, 21.36°, 23.58°, and 25.31°. The absence of 5.99°, 6.94° distinctive peaks of CAR and existence of numerous peaks of placebo in NLC demonstrated that high amount of the drug was dissolved in the solid state carrier matrix in an amorphous structure suggesting the transformation of crystalline form of CAR to amorphous form in the NLC. This suggests that polymorphic transformation leads to faster dissolution rate of NLC as the material in its amorphous form dissolves at a faster rate due to its higher internal energy and molecular motion when compared to crystalline forms.
In vitro release of CAR from NLC
In vitro drug release study of the CAR loaded NLCs showed sustained release behavior in pH 6.8 phosphate buffer (). Almost all formulation batches showed the 40% release of drug release within first 2 h followed by the sustained release from the CAR loaded NLCs. The low solubility of the CAR in aqueous phase could be the reason for the slow release of the drug from the lipid matrices after initial burst release. The increase in lipid concentration had significant effect; it sustained the release of the CAR from NLCs, which may be due to the equal distribution of drug within the lipid matrix and good entrapment of CAR in GMS.
Optimization data analysis for the CAR-NLCs
Responses recorded for fabricated CAR-NLCs were fitted to various models using Design-Expert® software. It was found that, the linear models were best-fitted for both particle size and EE%. 2FI model was best fitted as it showed the interactive outcome of independent variables on responses that non-linear model does not show. All values of R2, SD, and %coefficient of variation are depicted in . Results of ANOVA for the dependent variables verified that the model was significant for both the studied response variables.
Table III. Summary of ANOVA results for Y1 and Y2.
Accelerated stability studies
Stability studies were conducted on optimized NLCs (F5) using the particle size and EE% as the main parameters. From , it was evident that particle size was increased slightly during the 3 months storage from the 110.1 ± (1.9) nm to 124.0 ± (3.9) nm. The EE% of the optimized batch initially was found to be 85.11 ± 3.7% while after 3 months was found to be 81.35 ± 3.5% indicating that the drug can retain within the NLCs for the sufficient period of time. Above findings suggests that there were no significant alterations in the size and the EE% of optimized batch (F5). Formulation F5 was found to be stable at 25 ± 2°C/60 ± 5% RH for a total period of 3 months.
Table IV. Stability studies data of optimized CAR-NLCs formulation (F5).
Conclusion
In present approach, CAR encapsulated NLCs were successfully formulated by hot high pressure homogenization technique. The study also reports use of 23 full factorial design for designing, practicability, and validity CAR-NLCs. Thermal analysis revealed conversion of CAR into amorphous form, which may lead to increased oral bioavailability of CAR. Our key findings demonstrated the feasibility of investigated CAR-NLCs for administration of CAR encapsulated in NLC. This would offer an exciting mode of delivering hydrophobic drugs like CAR. However, extensive pharmacokinetic and clinical studies need to be tailored so as to explore the investigated NLCs to boost its scale up for the market.
Acknowledgments
Authors gratefully acknowledge STIC, Cochin University, Cochin for spectral support. The authors are also grateful to the Management of H. R. Patel Institute of Pharmaceutical Education and Research, Shirpur for providing the necessary facilities, support and encouragement.
Declaration of interest
The authors report no declarations of interest. The authors alone are responsible for the content and writing of the paper.
References
- Alex MR, Chacko AJ, Jose S, Souto EB. 2011. Lopinavir loaded solid lipid nanoparticles (SLN) for intestinal lymphatic targeting. Eur J Pharm Sci. 42:11–18.
- Alvarez-Roman R, Naik A, Kalia YN, Guy RH, Fessi H. 2004. Skin penetration and distribution of polymeric nanoparticles. J Control Release. 99:53–62.
- Blasi P, Giovagnoli S, Schoubben A, Ricci M, Rossi C. 2007. Solid lipid nanoparticles for targeted brain drug delivery. Adv Drug Deliv Rev. 59:454–477.
- Gonzalez-Mira E, Egea MA, Garcia ML, Souto EB. 2010. Design and ocular tolerance of flurbiprofen loaded ultrasound-engineered NLC. Colloids Surf B Biointerfaces. 81:412–421.
- Jain NK, Ram A. 2011. Development and characterization of nanostructured lipid carriers of oral hypoglycemic agent: selection of surfactants. Int J Pharm Sci Rev Res. 7:125–130.
- Kumar VV, Chandrashekar D, Ramakrishna S, Kishan V, Rao YM, Diwan PV. 2007. Development and evaluation of nitrendipine loaded solid lipid nanoparticles: influence of wax and glyceride lipids on plasma pharmacokinetics. Int J Pharm. 335:167–175.
- Lin XH, Li XW, Zheng LQ, Yu L, Zhang QQ, Liu WC. 2007. Preparation and characterization of monocaprate nanostructured lipid carriers. Colloids Surf A. 311:106–111.
- Liu D, Liu Z, Wang L, Zhang C, Zhang N. 2011. Nanostructured lipid carriers as novel carrier for parenteral delivery of docetaxel. Colloids Surf B Biointerfaces. 85:262–269.
- Mehnert W, Mader K. 2001. Solid lipid nanoparticles: production, characterization and applications. Adv Drug Deliv Rev. 47: 165–196.
- Muller RH, Keck CM. 2004. Challenges and solutions for the delivery of biotech drugs - a review of drug nanocrystal technology and lipid nanoparticles. J Biotechnol. 113:151–170.
- Muller RH, Radtke M, Wissing SA. 2002a. Solid lipid nanoparticles (SLN) and nanostructured lipid carriers (NLC) in cosmetic and dermatological preparations. Adv Drug Deliv Rev. 54: S131–S155.
- Muller RH, Radtke M, Wissing SA. 2002b. Nanostructured lipid matrices for improved microencapsulation of drugs. Int J Pharm. 242:121–128.
- Parfitt K. 1999. The Complete Drug Reference. London: Pharmaceutical Press, p. 838.
- Potluri RK, Bandari S, Jukanti R, Veerareddy PR. 2011. Solubility enhancement and physicochemical characterization of carvedilol solid dispersion with gelucire. Arch Pharm Res. 34: 51–57.
- Reddy LH, Vivek K, Bakshi N, Murthy RS. 2006. Tamoxifen citrate loaded solid lipid nanoparticles (SLN™): preparation, characterization, in vitro drug release, and pharmacokinetic evaluation. Pharm Dev Technol. 11:167–177.
- Schäfer-Korting M, Mehnert W, Korting HC. 2007. Lipid nanoparticles for improved topical application of drugs for skin diseases. Adv Drug Deliv Rev. 59:427–443.
- Singh S, Dobhal AK, Jain A, Pandit JK, Chakraborty S. 2010. Formulation and evaluation of solid lipid nanoparticles of a water soluble drug: Zidovudine. Chem Pharm Bull. 58:650–655.
- Souto EB, Wissing SA, Barbosa CM, Muller RH. 2004. Evaluation of the physical stability of SLN and NLC before and after incorporation into hydrogel formulations. Eur J Pharm Biopharm. 58:83–90.
- Tiwari R, Pathak K. 2011. Nanostructured lipid carrier versus solid lipid nanoparticles of simvastatin: comparative analysis of characteristics, pharmacokinetics and tissue uptake. Int J Pharm. 415:232–243.
- Triplett (II) MD, Rathman JF. 2009. Optimization of β-carotene loaded solid lipid nanoparticles preparation using a high shear homogenization technique. J Nanopart Res. 11:601–614.
- Trotta M, Debernardi F, Caputo O. 2003. Preparation of solid lipid nanoparticles by a solvent emulsification–diffusion technique. Int J Pharm. 257:153–160.
- Venishettya VK, Chedea R, Komuravelli R, Adepua L, Sistla R, Diwan PV. 2012. Design and evaluation of polymer coated carvedilol loaded solid lipid nanoparticles to improve the oral bioavailability: a novel strategy to avoid intraduodenal administration. Colloids Surf B Biointerfaces. 95:1–9.
- Venkateswarlu V, Manjunath K. 2004. Preparation, characterization and in vitro release kinetics of clozapine solid lipid nanoparticles. J Control Release. 95:627–638.