
 ?Mathematical formulae have been encoded as MathML and are displayed in this HTML version using MathJax in order to improve their display. Uncheck the box to turn MathJax off. This feature requires Javascript. Click on a formula to zoom.
Abstract
A new microring resonator system is proposed for the detection of the Salmonella bacterium in drinking water, which is made up of SiO2-TiO2 waveguide embedded inside thin film layer of the flagellin. The change in refractive index due to the binding of the Salmonella bacterium with flagellin layer causes a shift in the output signal wavelength and the variation in through and drop port's intensities, which leads to the detection of Salmonella bacterium in drinking water. The sensitivity of proposed sensor for detecting of Salmonella bacterium in water solution is 149 nm/RIU and the limit of detection is 7 × 10− 4RIU.
Introduction
Typhoid fever is caused by Salmonella typhimurium (CitationKhan 2012). The Salmonella bacterium (SB) comprises flagellin (the spherical shape of the protein that evolves itself in a transparent cylinder of filament) with 494 amino acids. Several experiments have been conducted for the identification and detection of the SB such as nuclear magnetic resonance (NMR), TUBEX test, Felix–Widal test, and optical anisotropy of flagellin layer (CitationKovacs et al. 2013). There is an increasing tendency toward improving various techniques in biosensing due to high demand for the rapid and precise detection of biomolecules. Several techniques have been introduced for the sensing based on the change of the phase or frequency of the optical system such as fluorescence, surface enhanced Raman spectroscopy (SERS), refractometry, and nonlinear optics (microresonator) biosensor (CitationMarty et al. 2012). Most of the biosensors are focused on the detection of protein within a bacterium. Nowadays, the optoelectronics biosensors have become one of the important practical technologies as it provides label-free sensing for biomolecules detection with high sensitivity. The optical microring resonator (MRR) is one of the optoelectronics devices which comprise high confinement of photons and electrons in photonics biosensor circuits. The MRR systems can fabricate in compact size with low cost which are more accurate and need less operating power (CitationWerquin et al. 2013). The MRR is used as the main component in optofluidic devices for the biosensing (CitationDelezoide et al. 2012) and chemical analysis applications (CitationKosterev et al. 2010, CitationHaddadpour and Yi 2010) as it can be integrated with the photonics component. To date, a number of experimental and numerical investigation have been conducted in order to provide the optimized shape, size, and materials (CitationBenson et al. 2006) for the sensing purposes.
In this paper, new waveguide system consisting of optical microring resonator is proposed and investigated for the detection of the SB in drinking water. The nonlinear treatment of soliton pulse due to the Kerr effect is numerically and analytically studied. A system with embedded optical microresonator inside the thin films layer of the flagellin with applied Salmonella total antibodies is used as the probe for the detection of SB.
Background
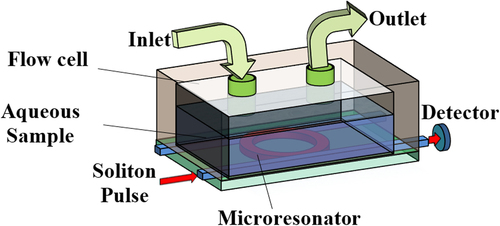
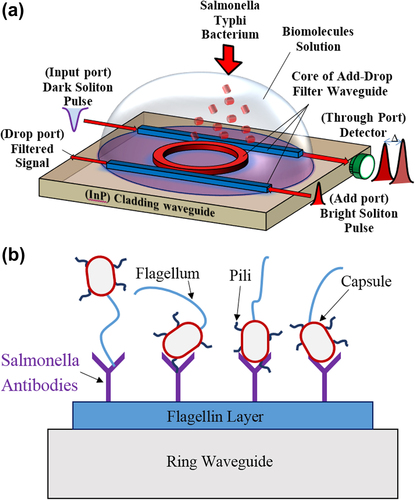
According to the spectroscopic technique known as optical waveguide light-mode spectroscopy (OWLS), the insertion of the biomolecules into the flow cell causes the small change in the refractive index which results in a change in output signals (CitationGrego and Stoner 2009, CitationVoros et al. 2002) due to absorption of radiations by the biomolecules. shows the proposed design of OWLS's SiO2-based waveguide comprising add-drop filter (ADF) microresonator system with 2 × 2 optical directional couplers. The microresonator waveguide is placed within the contaminated water-carrying SB. The illustrates the ADF microresonator system used as a probe biosensor embedded inside the aqueous solution. SB is characterized as a rod-shape, gram negative, oxidative, and motile bacteria which moves with its flagellin (CitationSanders and Sanders 1997). Salmonella paratyphi and Salmonella typhi are two serotypes of Salmonella enterica subspecies. Together these two serotypes have five antibodies. These antibodies can specifically interact to different parts of bacteria such as capsule, pili, flagellum, or the surface proteins as illustrated in . Salmonella flagellin has 494 amino acids, the first 65 and the last 45 residues are flexible (CitationKovacs et al. 2013) while its central portion (amino acid number166–450) makes a compact domain. This attribute of Salmonella flagellin provides the feasibility of preparing a flagellin layer. The flagellin sample layer for SB can be prepared by heat-induced depolymerization of flagellar filament for 15 min incubated at 65°C. The microresonating system is placed into the head assembly of an OWLS optical scanner attached with the flow-through cuvette (flow cell) (CitationKovacs et al. 2013). In order to provide the specific and selective binding of the SB into the flagellin layer, the Salmonella total antibody is applied on the flagellin sample layer which is loaded on the ring waveguide. Salmonella total antibody including Salmonella paratyphi A H Ab, Salmonella paratyphi B H Ab, Salmonella typhi H D Ab, Salmonella typhi O Vi Ab, and Salmonella typhi O D Ab is used for selective detection of Salmonella H, Type A, B, C and Salmonella O, Type Vi, and Salmonella O, Type D, respectively (CitationPui et al. 2011). Double filtration plasmapheresis has been used to separate plasma from drinking water. Salmonella antibodies can be provided by iterative free flow electrophoresis (CitationNissum et al. 2007). Applying the Salmonella total antibody on the flagellin sample layer which is loaded on the ring waveguide brings about the specific and selective binding of the SB into the flagellin layer. Thus, the detected wavelength shift due to the variation of the refractive index is specifically due to the reaction between antigen (Salmonella) and antibody. When an optical pulse is coupled into the ring, a portion of the evanescent field couples and intensifies within the ring waveguide. The refractive index of the outer medium changes due to interaction of the photon with the binding molecules while the pulse propagates along the waveguide (CitationPavesi and Fauchet 2008). The intensity shift is analyzed with respect to the change of refractive index which contributes toward the sensitivity of the biosensor.
The waveguide parameters used in this modeling is based on the TiO2 as the core medium with refractive index 2.00 and the SiO2 as the cladding with refractive index 1.75 for the ADF system (CitationSchmitt and Hoffmann 2009). The average refractive index of Salmonella flagellin layer with thickness of 2.2 nm on the surface of the waveguide is n3 = 1.43 (CitationKovacs et al. 2013). Two types of solutions are used for aqueous medium in modeling parameters. Drinking water with the refractive index of 1.3320 at 37°C (CitationZhernovaya et al. 2011) is used as the baseline solution and the contaminated drinking water with refractive index of 1.33133 for 1 mg/mL Salmonella solution (CitationKovacs et al. 2013). The refractive index is changed due to the reaction between SB with its total antibody applied on the surface of the microresonator.
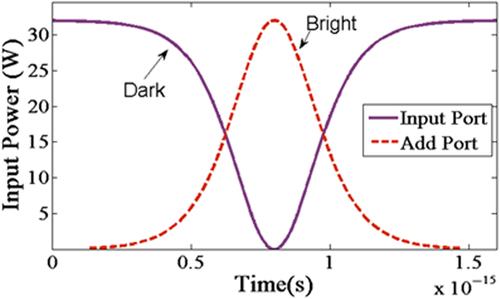
The modeling of the microresonator biosensor system is carried out using scattering matrix method in order to simplify the mathematical calculation on the behavior of electric field propagation. The bright soliton pulse can be generated by femtosecond tunable laser with 6.5-cm tellurite microstructure fiber,which is able to produce laser pulse in range of 528–552-nm wavelength (tunable green laser source) (CitationYan et al. 2009). For the dark soliton, the Yb mode-locked laser is required to pass through the Mach Zehnder interferometer modulator with polarization control in maximum direct current bias condition (CitationFeng et al. 2005). For the dark and bright soliton (CitationAgrawal 2011), the simulations provide the baseline on the transmission signal and output power as the references for OWLS sensing activity. The output intensity of the microresonator is analyzed to detect the presence of SB.
The equations of the optical dark and bright soliton pulses are given as (CitationAgrawal 2000)
Where A represents the optical power amplitude, x shows the propagation distance, T is the soliton pulse propagation time, and T < β1x is a soliton pulse propagation time in a frame moving at the group velocity, and T0 is the initial propagation time which is equal to soliton pulse width. LD <T0/ β2| is the dispersion length of the soliton pulse, ω is the angular frequency shift, ωt is the phase shift. Here, β and β are the coefficients of the linear and second order terms of Taylor expansion of propagation constant (CitationYupapin and Teeka 2010, CitationSrithanachai et al. 2012). The dark and bright equations consist of the balance of the dispersive β and the nonlinear effect ω of light pulse which are group velocity dispersion and the self-phase modulation, respectively (CitationAgrawal 2011). In , the dark and bright solitons are simulated against time as solid and dash lines, respectively.
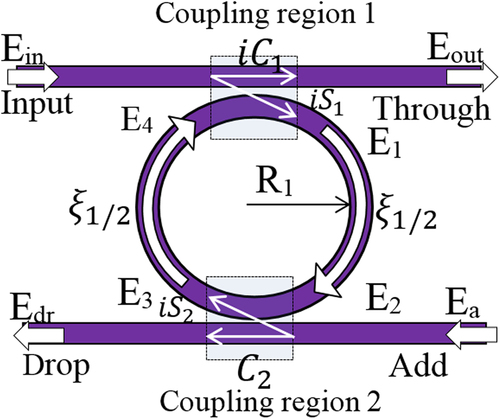
The scattering matrix method is used to determine the pulse transfer function which shows the variation of pulse electric field inside the system. From , a portion of input dark soliton pulse, E1, is transmitted into the system via coupler due to the cross-coupling of ![]() and the rest of soliton pulse travels along the bus waveguide toward the output port Eout which exhibits self-coupling
and the rest of soliton pulse travels along the bus waveguide toward the output port Eout which exhibits self-coupling ![]() Here k1 is coupling coefficient and ω shows the coupler loss (CitationSuwanpayak et al. 2011). In the same process, the optical bright soliton pulse at the add port undergoes cross and self-coupling into ring and bus waveguide, respectively. The pulse E1 propagates in clockwise direction along the ring and interferes with the portion of bright soliton pulse, E3, inside the ring resonator. Using the scattering matrix method, the relationship between the output and input port's electric fields can be determined as
Here k1 is coupling coefficient and ω shows the coupler loss (CitationSuwanpayak et al. 2011). In the same process, the optical bright soliton pulse at the add port undergoes cross and self-coupling into ring and bus waveguide, respectively. The pulse E1 propagates in clockwise direction along the ring and interferes with the portion of bright soliton pulse, E3, inside the ring resonator. Using the scattering matrix method, the relationship between the output and input port's electric fields can be determined as
By considering the round trip loss and the Z-transform parameter as ![]() (CitationBahadoran et al. 2012), the relationship between the propagating fields inside the rings can be determined as
(CitationBahadoran et al. 2012), the relationship between the propagating fields inside the rings can be determined as
Where α is the linear attenuation coefficient, L is the circumference of the ring resonator and K represents the vacuum wavenumber (CitationBahadoran et al. 2013, CitationSirawattananon et al. 2012). The refractive index of the light pulse which propagates within nonlinear medium can be written as
where nL is linear refractive and nNL is nonlinear refractive index. The intensity is shown by I, the optical power is shown by P, and Aeff is the effective mode core area of waveguide and P. From Eq. (6), the nonlinear Kerr effect occurs inside the system due the change of refractive index, n, which causes the phase shift of the propagating pulse. When the biomolecules interact with cladding layer, the change in effective refractive index, neff, can be determined as
where ncr is the core refractive index, ncd is the cladding refractive index and the propagation constant is shown by β (CitationHeebner et al. 2008). When the SB in drinking water interacts with applied total Salmonella antibodies on the flagellin layer, the effective refractive index of the ring waveguide can be determined. From Eq. (7), the group refractive index of the ring waveguide is given by ng = neff + λ0 (dneff / dλ)λ0, where λ0 is the center wavelength of the input signals to the ring resonator (CitationBahadoran et al. 2013, CitationBahadoran et al. 2013). From Eqs. (4)–(6), the relationship between the output electric field (Eout) with respect to the input fields can be written as:
The output intensity at through Iout and drop Idrp ports can be obtained as
Result and discussion
In operation, the input pulse consisting of dark and bright solitons with center wavelength of 546.1 nm are fed into the microresonating system with the radius of R = 200μm, as shown in , (CitationQiu et al. 2014). In the simulation, the following optical parameters are used: coupling coefficient ratios κ1:κ2 = 50:50, Aeff = 0.10 μm2, (CitationApiratikul et al. 2009), α = 9.2 dBm− 1 (CitationD’Orazio et al. 2003) and the lossless coupling, γ = 0, is supposed for the proposed system (CitationMikroulis et al. 2005). The dark soliton (Eq. 2) is launched into the input port, and the bright soliton (Eq. 3) is introduced to the add port of the proposed system. Regarding to Eq. (7), the applied layer of Salmonella flagellin with refractive index of 1.43 (CitationKovacs et al. 2013) causes an increase in effective refractive index of the ring waveguide. The reported refractive index for SB is 1.33133 (CitationKovacs et al. 2013). The interaction of SB in drinking water with applied total Salmonella antibodies on the flagellin layer causes a change in the effective refractive index of the ring waveguide, which can bring the variations in intensity and the wavelength shift of output signals.
shows the output signals at the through port and drop port. The output power signals at through and drop ports are simulated in wavelength range of 544–548 nm for the soliton pulse propagates within the microring resonator immersed in drinking water with and without SB, where the change in group refractive index of the ring waveguide due to the antibody and antigen (Salmonella) interaction effects on the intensity of output signals can occur. In –8 the blue lines represent the output intensity at through port for drinking water without SB which is used as baseline.
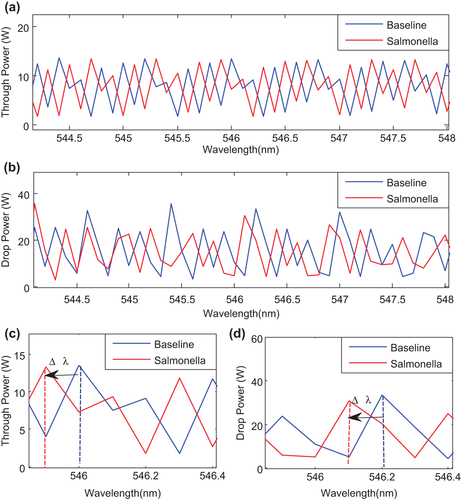
and are the enlargement of and , respectively, in range of 545.86–546.40 nm. shows the shift in the wavelength at the through port due to presence of SB in the drinking water. Similar behavior is observed at the drop port due to the interaction of optical evanescent field with the external molecules (molecules outside the core waveguide). As the waveguide is exposed to the biomolecules at the surfaces, the antigen-antibody reaction causes binding of SB (antigen) into applied antibody on the waveguide surfaces and changes the system refractive index, which enhances the nonlinearity effect of the system and causes the shift in wavelength (CitationChremmos et al. 2010).
shows the output signal at the through port. The intensity of the signals at through port is simulated for 20000 roundtrips of soliton pulse within the microring resonator for sensing purpose. The red color represents the output signal for drinking water with SB. and are the enlargement of diagram in range of 8000–12000 round trips and 12000–20000 round trips, respectively. The intensity of output signal for the SB is slightly decreased and increased upto 36.40 W/m2 for round trips 5929, whereas the baseline intensity decreases to 4.42 W/m2 in 5866 round trips as shown in . This shows the nonlinearity response of the SB present inside the drinking water which build-up the intensity inside the ring waveguide. The presence of SB in the drinking water causes the change of refractive index of the ring which contributes to the nonlinear response of the resonance which in turn changes the resonance peak intensity with respect to round trips (in the range of 5000th–15000th).
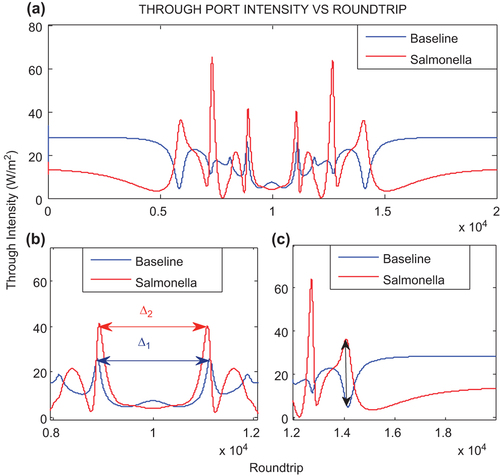
shows output intensity signals for 10000 round trips. A shift in the output signal is observed due to presence of SB in the drinking water sample. The shift is identified by measuring the distance from peak to peak for the both samples with and without SB. The peak to peak difference ∆ 1 for the baseline is 2245 round trips with intensity 25.98 W/m2. The peak to peak difference ∆2 is decreased to 2155 round trips with intensity 40.27 W/m2 for Salmonella operation. For 10000 round trips, the maximum resonance of the soliton pulse is observed. The Salmonella operation produces lower intensity 4.07 W/m2 as compared to the baseline 7.46 W/m2 which shows the lower refractive index from the SB solution which decreases the resonance of the optical signal in the system.
In for 12000th–20000th, the output signal intensity initially decreases for baseline operation whereas an increase in the output signal intensity is observed with Salmonella operation which reaches to maximum value 63.88 W/m2 for 12690 round trips. The baseline intensity is observed 5.09 W/m2 for 14100 round trips, whereas for Salmonella operation the intensity 35.90 W/m2 is obtained for 14060 round trips. Similar behavior is observed for 8000th round trips. The output signal intensity for Salmonella operation decreases, then increases exponentially which is opposite to the baseline operation. The increase in intensity illustrates the change in the bonding nature between molecules (i.e., drinking water and microresonator) due to presence of SB which causes the change in the refractive index of the system (CitationChremmos et al. 2010) whereas, the baseline intensity is decreased for the first 6000th round trips.
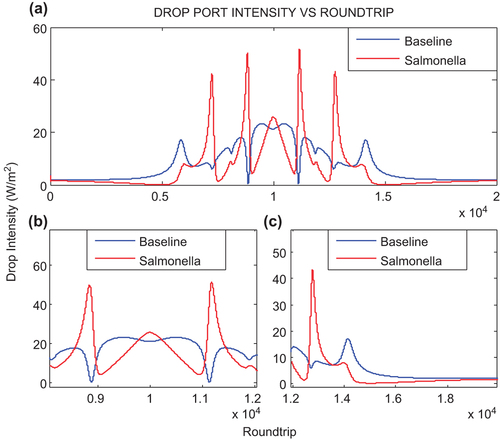
shows the output intensity signal at drop port of the ADF microresonator. For 10000 round trips, the output pulse intensity at drop port is higher than through port due to nonlinearity effect. As the bright soliton pulse comprises high intensity peak as compared to dark soliton, the high output intensity is observed at the resonance round trip (10000th) for drop port. The output intensity signal at drop port as shown in is slightly decreased at resonant round trips 10000. For 10000th round trips, the intensity at the drop port is increased for Salmonella as compared to baseline operation due to the absorption loss in cladding which contributes to the nonlinearity effect. shows the drop port intensity for round trips 12000–20000. The output pulse propagates with similar pattern with different peak intensity as, for the baseline, 17.10 W/m2 whereas for Salmonella operation 43.19 W/m2.
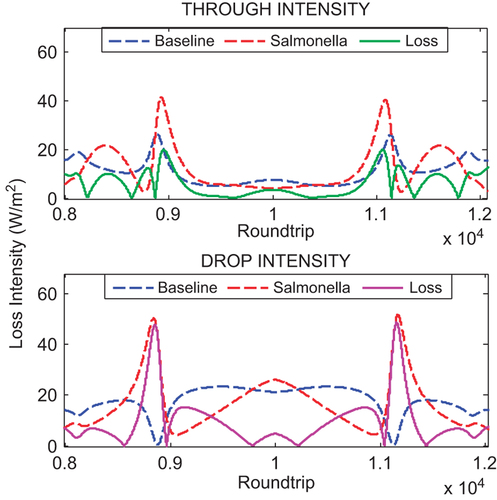
shows the intensity loss at the through and drop port. The percentages of the loss intensity at the resonances round trip are determined with respect to the baseline operation. The intensity loss at the through port is observed as 3.40 W/m2 with 45.48 and at the drop port 4.81 W/m2 with 18.87%. The higher percentage of the intensity loss gives better performance for the detection as the intensity loss is caused by the change in refractive index due to the presence of SB in the system. This indicates that the light pulse experiences more radiation loss due to the bending motion inside the ring waveguide.
In this work, the sensitivity of proposed sensor (S = Δλ/Δn) is the ratio of the change in sensor wavelength output to the change in the refractive index of medium (SB/drinking water). The through port and drop port resonance output intensities undergo 0.1-nm shift in wavelength Δλ in presence of the SB. The proposed MRR biosensor shows better sensitivity due the longer interaction length (CitationAgrawal 2000) between light and the biomolecules. The interaction length is measured as the system operates along 20000 round trips which are equal to 0.754 m larger than others interaction length of conventional biosensors (CitationKovacs et al. 2013, CitationMarty et al. 2012). Thus microring resonator is able to provide sensitive detection with a sensitivity of 149 nm/RIU based on the sensitivity resonance. The sensitivity can be increased using microring resonator with smaller radius. The limit of detection (LOD) (CitationClaes et al. 2010) of proposed sensor is 7 × 10− 4 RIU which is obtained from the ratio of the smallest detectable shift in wavelength and the sensitivity.
Conclusion
A new technique based on optical microring resonator is proposed and analytically investigated for the detection of SB in drinking water. The visible wavelength of the soliton pulse laser, 546.1 nm, is considered as the input source of the system for detection of biomolecules within the drinking water. The scattering matrix method and analytical formulation is conducted using iterative method to simulate the of pulse propagation for 20000 round trips. A shift in the output signal toward lower wavelength is observed in the presence of the Salmonella bacterium. The simulation results show that the through port provides better percentages of intensity loss as compared to the drop port 67.96% and 37.77%, respectively. The sensitivity of the proposed sensor for detecting of SB is 149 nm/RIU and LOD is 7 × 10− 4 RIU.
Acknowledgments
We would like to thank the Institute of Advanced Photonics Science, Nanotechnology Research Alliance, Universiti Teknologi Malaysia (UTM) and King Mongkut's Institute of Technology (KMITL), Thailand, for providing research facilities.
Declaration of interest
The authors report no declarations of interest. The authors alone are responsible for the content and writing of the paper.
This research work has been supported by Flagship Research Grant Q.J130000.2509.06H46.
References
- Agrawal GP. 2000. Nonlinear Fiber Optics. Berlin: Springer.
- Agrawal GP. 2011. Nonlinear fiber optics: its history and recent progress [Invited]. J Opt Soc Am B. 28:A1–A10.
- Apiratikul P, Rossi AM, Murphy TE. 2009. Nonlinearities in porous silicon optical waveguides at 1550 nm. Opt Express. 17: 3396–3406.
- Bahadoran M, Afroozeh A, Ali J, Yupapin PP. 2012. Slow light generation using microring resonators for optical buffer application. Opt Eng. 51: 044601-1-044601-8.
- Bahadoran M, Ali J, Yupapin PP. 2013. Graphical approach for nonlinear optical switching by PANDA Vernier filter. photonics technology letters IEEE.25:1470–1473.
- Bahadoran M, Ali J, Yupapin PP. 2013. Ultrafast all-optical switching using signal flow graph for PANDA resonator. Appl Optics. 52: 2866–2873.
- Benson TM, Boriskina SV, Sewell P, Vukovic A, Greedy SC, Nosich AI. 2006. Micro-optical resonators for microlasers and integrated optoelectronics – recent advances and future challenges. Nato Sci Ser Ii-Math. 216:39–70.
- Chremmos I, Uzunoglu N, Schwelb O. 2010. Photonic Microresonator Research and Applications. Berlin: Springer.
- Claes T, Bogaerts W, Bienstman P. 2010. Experimental characterization of a silicon photonic biosensor consisting of two cascaded ring resonators based on the Vernier-effect and introduction of a curve fitting method for an improved detection limit. Opt Express. 18:22747–22761.
- D’Orazio A, De Sario M, Mescia L, Petruzzelli V, Prudenzano F, Chiasera A, et al. 2003. Design of Er3 + doped SiO2-TiO2 planar waveguide amplifier. J Non-Cryst Solids. 322:278–283.
- Delezoide C, Lautru J, Zyss J, Ledoux-Rak I, Nguyen CT. 2012. Vertically coupled polymer microresonators for optofluidic label-free biosensors. SPIE OPTO: International Society for Optics and Photonics, San Francisco, California, USA, January 21, 2012.
- Feng XH, Liu YG, Li Y, Yuan SZ, Kai GY, Dong XY. 2005. Generation of bright and dark pulses with doubled repetition rate using direct external nonlinear modulation. Proc Soc Photo-Opt Ins. 5623:789–793.
- Grego S, Stoner BR. 2009. Wavelength interrogation of optical waveguide biosensors in the input grating coupler configuration. Proc SPIE. 7218:9.
- Haddadpour A, Yi YS. 2010. Metallic nanoparticle on micro ring resonator for bio optical detection and sensing. Biomed Opt Express. 1:378–384.
- Heebner J, Grover R, Ibrahim TA. 2008. Optical Microresonators: Theory, Fabrication, and Applications. Berlin: Springer Verlag.
- Khan AA. 2012. Bacteria and Cancer. The Netherlands: Springer Science Publisher.
- Kosterev A, Dong L, Thomazy D, Tittel F, Overby S. 2010. QEPAS for chemical analysis of multi-component gas mixtures. Appl Phys B. 101:649–659.
- Kovacs N, Patko D, Orgovan N, Kurunczi S, Ramsden JJ, Vonderviszt F, Horvath R.Optical anisotropy of flagellin layers: in situ and label-free measurement of adsorbed protein orientation using OWLS. Anal Chem. 2013;85:5382–5389.
- Marty MT, Sloan CDK, Bailey RC, Sligar SG. 2012. Nonlinear analyte concentration gradients for one-step kinetic analysis employing optical microring resonators. Anal Chem. 84:5556–5564.
- Mikroulis S, Simos H, Roditi E, Syvridis D. 2005. Ultrafast all-optical AND logic operation based on four-wave mixing in a passive InGaAsP-InP microring resonator. IEEE Photon Technol Lett. 17:1878–1880.
- Nissum M, Kuhfuss S, Hauptmann M, Obermaier C, Sukop U, Wildgruber R, et al. 2007. Two-dimensional separation of human plasma proteins using iterative free-flow electrophoresis. Proteomics. 7:4218–4227.
- Pavesi L, Fauchet PM. Biophotonics. Berlin: Springer; 2008.
- Pui C, Wong W, Chai L, Tunung R, Jeyaletchumi P, Hidayah N, et al. 2011. Salmonella: A foodborne pathogen. Int Food Res J. 18: 465–473.
- Qiu F, Spring AM, Maeda D, Ozawa M-A, Odoi K, Aoki I, et al. 2014. TiO2 ring-resonator-based EO polymer modulator. Opt Express. 22:14101–14107.
- Sanders W Jr, Sanders CC. 1997. Enterobacter spp.: pathogens poised to flourish at the turn of the century. Clin Microbiol Rev. 10:220–241.
- Schmitt K, Hoffmann C. 2009. High-refractive-index Waveguide Platforms for Chemical and Biosensing. Optical Guided-Wave Chemical and Biosensors I. Berlin: Springer, pp. 21–54.
- Sirawattananon C, Bahadoran M, Ali J, Mitatha S, Yupapin PP. 2012. Analytical Vernier effects of a PANDA ring resonator for microforce sensing application. Nanotechnol, IEEE Transact. 11:707–712.
- Srithanachai I, Ueamanapong S, Niemcharoen S, Yupapin PP. 2012. Novel design of solar cell efficiency improvement using an embedded electron accelerator on-chip. Opt Express. 20:12640–12648.
- Suwanpayak N, Jalil MA, Teeka C, Ali J, Yupapin PP. 2011. Optical vortices generated by a PANDA ring resonator for drug trapping and delivery applications. Biomed Opt Express. 2:159–168.
- Voros J, Ramsden JJ, Csucs G, Szendro I, De Paul SM, Textor M, Spencera ND. 2002. Optical grating coupler biosensors. Biomaterials. 23:3699–3710.
- Werquin S, Goes A, Dubruel P, Bienstman P. 2013. Silicon-on-insulator microring resonators for photonic biosensing applications. 15th International Conference on Transparent Optical Networks (ICTON), Cartagena, Spain, June 23–27, 2013.
- Yan X, Qin GS, Liao MS, Suzuki T, Mori A, Ohishi Y. 2009. Soliton source generation in a few-mode tellurite microstructure fiber. Appl Phys Lett. 95.
- Yupapin PP, Teeka C. 2010. OOK generation based on MZI incorporating a pumped nonlinear ring resonators system. Opt Express. 18:9891–9899.
- Zhernovaya O, Sydoruk O, Tuchin V, Douplik A. 2011. The refractive index of human hemoglobin in the visible range. Physics in medicine and biology. Phys Med Biol. 56:4013.