
 ?Mathematical formulae have been encoded as MathML and are displayed in this HTML version using MathJax in order to improve their display. Uncheck the box to turn MathJax off. This feature requires Javascript. Click on a formula to zoom.
Abstract
We prepared liver-targeting micelles loaded with oxaliplatin (OXA), using a polymer modified by a liver-targeting ligand, namely, glycyrrhetinic acid-conjugated and stearic acid-grafted chitosan (GA-CS-SA). The particles had a uniform size, which was 138.6 ± 0.72 nm. The encapsulation efficiency was up to 71.7 ± 0.46%. The hepatic distribution of OXA in mice given OXA-GA-CS-SA was significantly superior to that in the controls (P < 0.05), which means that liver-targeted delivery of OXA was achieved. These results reveal that OXA-GA-CS-SA could be a potential and promising candidate for efficiently targeted delivery of OXA.
Keywords::
Introduction
Oxaliplatin (OXA) is one of the third generation of platinum-based anticancer agents, with a lower adverse reaction than cisplatin and carboplatin. It plays an important role in the combination therapy followed for hepatocellular carcinoma. However, OXA still has the toxicity common to all platinum-based drugs, which seriously limits its clinical application (CitationPark et al. 2011, CitationSittl et al. 2012). Consequently, targeting carriers of such agents have attracted increasing attention as efficient drug delivery systems which increase efficacy and lower systemic side effects.
Glycyrrhetinic acid-conjugated and stearic acid-grafted chitosan (GA-CS-SA), which had been previously synthesized in our laboratory, showed good capacity for micelle formation in aqueous medium via self-assembly. It was thus qualified to be a potentially excellent liver-targeting carrier (CitationChen et al. 2013). In this study, GA-CS-SA was utilized as a carrier to prepare OXA-loaded micelles for liver-targeted delivery.
Materials and instruments
Materials
Stearic acid-grafted chitosan (CS-SA, self-made), GA-CS-SA (self-made); Oxaliplatin (98.5%), Qilu pharmaceutical Co., Ltd; Kunming Mice, 25 ± 5 g, Animals certificate: SCXK (E) 20140022; other chemicals were all of analytical or chromatographic grade and used as received unless otherwise noted.
Instruments
Zetasizer Nano instrument (Zetasizer Nano-ZS90), Malvern Instruments Ltd.; Transmission electronic microscope (JEM2010), JEOL; Ultrasonic cell crusher (BILON92-2D), Shanghai Bilon Experiment Equipment Co., Ltd.; Low speed centrifuge (D-78532), Hettich; HPLC (LC-20A), Shimadzu; ICP-MS (ICP-MS7500A), Agilent Technologies.
Methods and results
Preparation of oxaliplatin-loaded micelles
A certain amount of CS-SA and GA-CS-SA were each dispersed in 20 mL ultrapure water, respectively. Then the solutions were placed in an ice bath and treated with a probe-type ultrasonicator at 400 W for 30 min (pulse on 2.0 s, pulse off 3.0 s), respectively.
Preparation of drug-loaded micelles
A certain amount of OXA was added to DMSO. The mixture was ultrasonicated to prepare a DMSO solution of OXA, with the same ultrasonicator as above, at room temperature. The solution was added dropwise to the blank micelle solution with stirring for a period of time. Then it was placed in dialysis bags (MWCO = 3500) with 10 volumes of ultrapure water. The water was refreshed at time intervals of 0.5 h to remove free OXA and organic solvent. Eventually, OXA-loaded micelle solution was obtained in the dialysis bags.
Determination of encapsulation efficiency
In order to calculate encapsulation efficiency (EE), the content of OXA was determined with high performance liquid chromatography (HPLC).
Free OXA was separated by ultrafiltration centrifugation. 2ml of OXA-loaded micelle solution was placed in an ultrafiltration tube (molecular weight 3000) and centrifuged at 4000 rpm for 30 min. The lower liquid was taken to determine the free OXA content. Nine milliliter of methanol was added to 1 mL drug-loaded micelles, ultrasonicated for 30 min in a water bath to destroy the micelles, and then centrifuged at 4000 rpm for 30 min within an ultrafiltration tube (molecular weight 3000).
The lower liquid was taken to determine the total OXA content. The EE was calculated with reference to the following formula:
Ms: the quantity of total OXA content; Mi: the quantity of free OXA content.
Study of the preparation process of OXA-loaded micelles
EE was regarded as an indicator for the evaluation of OXA-loaded micelles: the higher the EE, the better the preparation process.
Orthogonal array test
According to the results of our preliminary research, we selected four parameters which have comparatively large impacts on micellar EE: dialysis time, volumetric ratio of organic to water phase, carrier concentration, and the ratio of drug quantity to micellar volume. With the elements of the four factors, we designed an L9 (34) orthogonal array test to obtain the optimal combination. Experimental conditions for the preparation of micelles are listed in and the consequent EE values corresponding to each combination are presented in and .
Figure 1. Trends of levels in every factor.
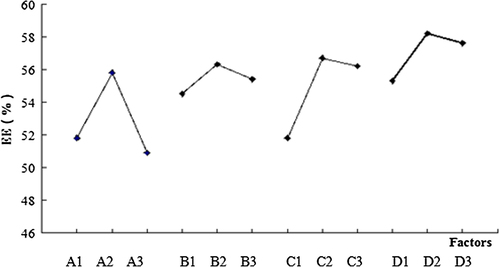
Table I. Factors and levels.
Table II. Design and results of the orthogonal experiment.
indicates that the influence on EE values decreases in the order: C > B > D > A. Meanwhile, the optimum condition was found to be A2B2C2D2. We confirmed the best preparation process based on the results in . Sixty milligram of CS-SA was dispersed in 20 mL of ultrapure water and then ultrasonicated with a probe-type ultrasonicator in an ice bath at 400 W for 30 min (pulse on 2.0 s, pulse off 3.0 s). Forty milligram of OXA was added to 40 mL DMSO, ultrasonicated with the same probe-type ultrasonicator at room temperature, and then added dropwise to the blank micellar solution (2:1, v/v) under stirring for 4 h. The mixture solution was placed in dialysis bags (MWCO = 3500) with 10 volumes of ultrapure water for 4 h. The water was refreshed at time intervals of 0.5 h to remove free OXA and organic solvent. Eventually, OXA-loaded micelle solution was obtained in the dialysis bags.
Verification of the preparation process
Three batches of OXA-CS-SA micelle solution were prepared under the optimum conditions. The surface morphology, particle size distribution and EE were measured ( and IV).
Table III. EE and diameter of OXA-CS-SA prepared by the optimal conditions.
Verification of the OXA-CS-SA micelles. The CS-SA and OXA-CS-SA micelle solutions were dropped to the copper net, respectively. Negative staining was performed using 2% sodium phosphotungstate solution (PH = 4.47). TEM imaging was performed to observe the particle size and morphology of these micelles (). Compared with the CS-SA micelles, the OXA-CS-SA micelles showed interparticle adhension and some fragments. showed that CS-SA has quite a narrow particle size distribution, while the distribution of OXA-CS-SA is much wider. Presumably, the interaction of OXA and CS-SA might lead to such discrepancy.
Figure 2. SEM photograph of CS-SA micelles and micelles with OXA.
Figure 3. The size distribution of CS-SA micelles and OXA-CS-SA micelles.
The OXA-CS-SA micelles have an average particle size of 189.8 nm and a stable EE value. Their particle size distribution range is wider than that of blank micelles. The preparation method seems to be highly reproducible and easy to operate.
Verification of OXA-GA-CS-SA micelles. Three batches of OXA-GA-CS-SA micelle solutions were prepared using the same method as the OXA-CS-SA solutions above.
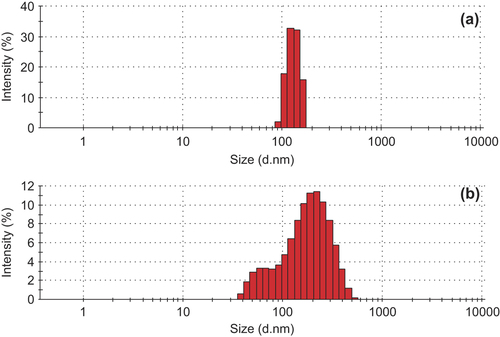
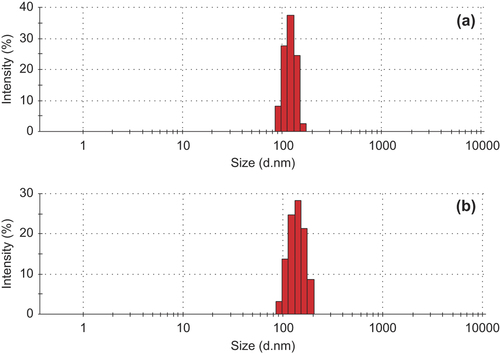
showed that the morphology of OXA-GA-CS-SA micelles resemble that of OXA-CS-SA micelles. reveals that the particle size distribution range was a little wider for the OXA-GA-CS-SA micelles than for the GA-CS-SA micelles. The particle size of OXA-GA-CS-SA micelles had an average particle size of 138.6 nm, and a stable EE value. The results indicate that the optimal preparation process of OXA-CS-SA micelles is also applicable to the OXA-GA-CS-SA micelles.
Figure 4. SEM photograph of GA-CS-SA micelles and OXA-GA-CS-SA micelles.
Figure 5. The size distribution of GA-CS-SA micelles and OXA-GA-CS-SA micelles.
In vitro drug release characteristics
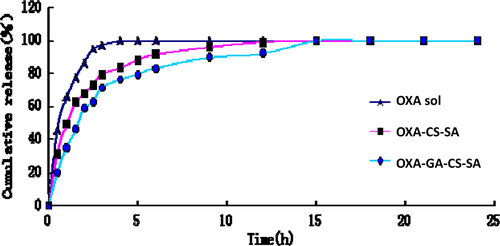
In vitro drug release was investigated via dialysis. Three milliliter of OXA-CS-SA and OXA-GA-CS-SA were each placed in dialysis bags (MWCO = 3500), respectively. These bags were put in 30 mL of PBS buffer (pH = 7.4) and were heated at 37°C. The OXA contents in the dialysate at 0.5, 1.0, 1.5, 2.0, 2.5, 3.0, 4.0, 5.0, 6.0, 9.0, 12.0, 15.0, 18.0, 21.0 and 24.0 h were determined by HPLC, respectively. suggests that the in vitro release of OXA, OXA-CS-SA and OXA-GA-CS-SA had two phases, respectively. The content of these agents increased drastically in the first phase while a plateau appeared in the second one. The release rate of OXA in the three solutions all decreased progressively.
. In vitro release profiles of DOX, OXA-CS-SA and OXA-GA- CS-SA in PBS (pH = 7.4).
OXA distribution in mice tissue
Forty-five mice were randomly assigned to three groups, and intravenously injected with different agents, including OXA solution, OXA-CS-SA micelle solution and OXA-GA-CS-SA micelle solution (20 mg/kg). Separate cohorts of mice were sacrificed for organ harvesting for tissue distribution analysis of OXA at 0.5, 4.0 and 12 h post-injection.
The organs were weighed accurately, and then were carbonized in crucibles and allowed to carbonize until smoking stopped. The ashes of the organs were heated at 650°C for 2 h in a muffle furnace. If a dark residue remained, 0.5 mL of nitric acid was added and the mixture was heated again until all residue disappeared. One milliliter of aqua regia (1:1) and 9 mL of distilled water were added to the ash and heated on an electric furnace for 10 min. After the solution cooled down, distilled water was added till the level reached the 10 mL mark (CitationWei et al. 2014). Eventually, the content of OXA was determined with ICP-MS. The concentration of OXA in the organ was calculated as follows:
These data were statistically analyzed by SPSS Statistics 19.0.
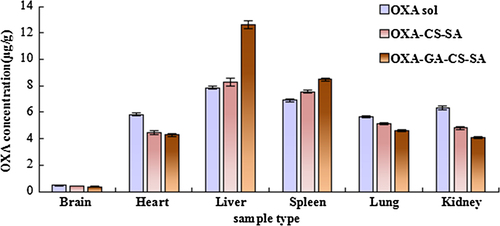
reveals that OXA contents detected in the liver and spleen at 0.5 h post-injection, of both micelle groups (the OXA-CS-SA group and the OXA-GA-CS-SA group), were significantly higher (P < 0.05) than that of the OXA solution group. Simultaneously, OXA contents in other organs of both micelle groups were significantly lower (P < 0.05) than the OXA solution group. Moreover, compared with the OXA-CS-SA group, the OXA-GA-CS-SA group had a significantly elevated (P < 0.05) OXA content in liver and spleen and a significantly decreased (P < 0.05) OXA content in the brain, lung and kidney. However, the discrepancy in the OXA content in the heart, between the two micelle groups, was not statistically significant.
Figure 7. The concentrations in the tissues of mice at 0.5 h.
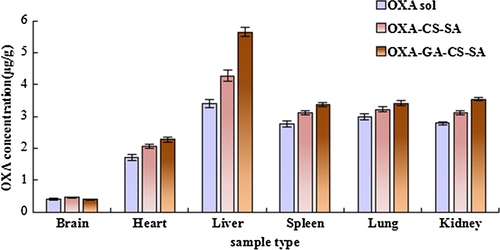
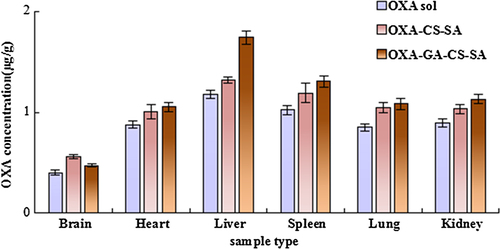
According to , OXA contents detected in the heart, liver, spleen, lung and kidney of both micelle groups at 4 h post-injection were further increased and significantly higher (P < 0.05) compared with the OXA solution group. Moreover, the OXA-GA-CS-SA had significantly elevated (P < 0.05) OXA content values when compared to the OXA-CS-SA group. Additionally, brain OXA content of the OXA-CS-SA group was significantly higher (P < 0.05) than that of the OXA solution group.
Figure 8. The concentrations in the tissues of mice at 4 h.
suggests that at 12 h post injection, both micelle groups had greater OXA content values in each organ involved, than the OXA solution group. Moreover, the OXA-GA-CS-SA group had significantly higher (P < 0.05) OXA content in the liver, spleen and kidney than the OXA-CS-SA group, while the difference between brain OXA content of the two groups was contrary.
Figure 9. The concentrations in the tissues of mice at 12 h.
Discussion
In this study, OXA-CS-SA micelles were prepared by the film dispersion method (CitationWang et al. 2011). However, it was difficult for us to replicate those procedures because of the difficulty in preparing the solution of lecithin in ethanol.
We optimized the conditions of preparing OXA micelles by the orthogonal experiment. The calculation of EE requires accurate determination of free drug in the micellar system, because EE is a usual index for assessing drug-loaded micelles. Consequently, the separation of free OXA from micelles is the key to the determination. Dialysis, ultrafiltration centrifugation and gel chromatography are common methods (CitationKing et al. 2012, CitationHostetter et al. 2012). Ultrafiltration centrifugation is easy to operate and time-saving. The molecular weights of the polymer and OXA in this experiment are ∼10,000 and 397.3, respectively, which means that an ultrafiltration centrifuge tube with MWCO greater than 3000 is applicable to the separation of free drug.
Dialysis was used to determine in vitro drug release. The changes in OXA concentration in the OXA solution and the dialysate of the two micelles all had two phases. The former had a drastic increase while the latter had a plateau. In the first phase, free OXA existing in the solution within the dialysis bags diffused beyond these bags, which led to the rapid rise. Afterwards, in the second phase, OXA entrapped within micelles was slowly released, maintaining the plateau. OXA-GA-CS-SA had the mildest concentration change in OXA among the three systems. In a sense, a slow release was achieved. OXA-GA-CS-SA had better surface morphology, smaller particle size, greater EE and slower release rate in vitro than OXA-CS-SA, presumably because GA-CS-SA, bearing more hydrophobic groups, was more capable of forming a tighter hydrophobic core than CS-SA.
In this research, change in OXA concentration is reflected by the change in plasma platinum content, which was detected by ICP-MS (CitationMelgar et al. 2014, CitationWeidmann and Barton 2014), that often serves as a tool for heavy metal detection in biological samples. The results showed that the entrapment of OXA by micelles affected the tissue distribution of OXA. At an earlier stage after injection (0.5 h), OXA contents in the brain, heart, lung and kidney of the two micelle groups was lower, which alleviated the impact of drugs on these tissues. Meanwhile, OXA contents in the liver and spleen increased, presumably because small particles tend to be absorbed by macrophages in these organs. After 4 and 12 h, OXA concentrations of the two micelle groups in tissues were all greater than in the OXA solution group, which may be due to the slower release of OXA from micelles. The OXA-GA-CS-SA group displayed the highest hepatic OXA concentration, which may be attributed to the liver-targeting ligand, glycyrrhetinic acid.
Conclusions
Herein, we successfully prepared OXA-GA-CS-SA, a liver-targeting micelle consisting of an anti-cancer drug OXA and a liver-targeting carrier GA-CS-SA. The micelle had good shape and uniform particle size. We have confirmed that a sustained in vitro release of OXA was achieved by the micelle. We have also shown that the carrier changed in vivo distribution of OXA: OXA content was increased in the liver and spleen and reduced in the heart and kidney. We anticipate that OXA-GA-CS-SA has tremendous potential as a new therapy for hepatic cancer. We also expect that GA-CS-SA may become a practicable and applicable delivery system for drugs that cure hepatic diseases.
Declaration of interest
The authors report no declarations of interest. The authors alone are responsible for the content and writing of the paper.
References
- Chen Q, Sun Y, Wang J, Yan G, Cui Z, Yin H, Wei H. 2013. Preparation and characterization of glycyrrhetinic acid-modified stearic acid-grafted chitosan micelles. Artif Cells Nanomed Biotechnol. doi:https://doi.org/10.3109/2169-1401.2013.845570.
- Hostetter AA, Osborn MF, DeRose VJ. 2012. RNA-Pt adducts formed from cisplatin treatment of Saccharomyces cerevisiae. ACS Chem Biol. 7:218–225.
- King CL, Ramachandran S, Chaney SG, Collins L, Swenberg JA, DeKrafft KE, et al. 2012. Debio 0507 primarily forms diaminocyclohexane-Pt-d(GpG) and -d(ApG) DNA adducts in HCT116 cells. Cancer Chemother Pharmacol. 69:666–677.
- Melgar MJ, Alonso J, García MA. 2014. Total contents of arsenic and associated health risks in edible mushrooms, mushroom supplements and growth substrates from Galicia (NW Spain). Food Chem Toxicol. 73C:44–50.
- Park SB, Lin CS, Krishnan AV, Goldstein D, Friedlander ML, Kiernan MC. 2011. Dose effects of- oxaliplatin on persistent and transient Na+ conductances and the development of neurotoxicity. PLoS ONE. 6:e18469.
- Sittl R, Lampert A, Huth T, Schuy ET, Link AS, Fleckenstein J, et al. 2012. Anticancer drug oxaliplatin induces acute cooling-aggravated neuropathy via sodium channel subtype NaV1.6-resurgent and persistent current. Proc Natl Acad Sci. 109:6704–6709.
- Wang K, Liu L, Zhang T, Zhu YL, Qiu F, Wu XG, et al. 2011. Oxaliplatin-incorporated micelles eliminate both cancer stem-like and bulk cell populations in colorectal cancer. Int J Nanomedicine. 6:3207–3218.
- Wei H, Xu L, Sun Y, Li G, Cui Z, Yan G, et al. 2014. Preliminary pharmacokinetics of PEGylated oxaliplatin polylactic acid nanoparticles in rabbits and tumor-bearing mice. Artif Cells Nanomed Biotechnol. doi:https://doi.org/10.3109/21691401.2014.883402.
- Weidmann AG, Barton JK. 2014. Construction and application of a rh-pt DNA metalloinsertor conjugate. Inorg Chem. 53: 7812–7814.