
 ?Mathematical formulae have been encoded as MathML and are displayed in this HTML version using MathJax in order to improve their display. Uncheck the box to turn MathJax off. This feature requires Javascript. Click on a formula to zoom.
Abstract
The objective of the present study was to prepare solid lipid nanoparticles (SLNs) of altretamine (ALT) by the hot homogenization and ultrasonication method. The study was conducted using the Box-Behnken design (BBD), with a 33 design and a total of 17 experimental runs, performed in combination with response surface methodology (RSM). The SLNs were evaluated for mean particle size, entrapment efficiency, and drug-loading. The optimized formulation, with a desirability factor of 0.92, was selected and characterized. In vitro release studies showed a biphasic release pattern from the SLNs for up to 24 h. The results of % EE (93.21 ± 1.5), %DL (1.15 ± 0.6), and mean diameter of (100.6 ± 2.1) nm, were very close to the predicted values.
Introduction
ALT is a synthetic, cytotoxic, alkylating, and antineoplastic agent, used in the treatment of advanced ovarian cancer (CitationHansen and Hughes 1991). The common name for altretamine is hexamethylmelamine (HMM). It is a white-colored, crystalline powder, having small molecules with a molecular weight of 210.25. It is practically insoluble in water, and has poor oral bioavailability because it undergoes first-pass metabolism (CitationThigpen 1987). It is an FDA-approved drug, used either alone or in combination with other drugs (cisplatin, cyclophosphamide, doxorubicin, fluorouracil and melphalan), for the treatment of refractory ovarian cancer (CitationDamia and Dincalci 1995, CitationWiernik 1992, CitationGidwani and Vyas 2013).
Due to its poor aqueous solubility and high permeability, it is categorized as a class II drug, according to the Biopharmaceutical Classification System (BCS). This means that its absorption is limited by its poor solubility. The BCS is based on the absorption of drug through the intestinal membrane, which is proportional to its concentration at the membrane surface, being the in vivo dissolution (CitationAmidon et al. 1995). The therapeutic activity of ALT is limited, due to its poor solubility and dose-dependent toxicity (including gastrointestinal, hematologic, and neurotoxicity) (CitationHansen and Hughes 1991). Various approaches have been utilized to develop suitable formulations of altretamine; for instance, CitationHariharan and Price (2002), incorporated ALT into microspheres using poly lactic acid (PLA) as a carrier. Later, CitationSun et al. (2010), prepared liposomes of ALT using sodium deoxycholate as a carrier, for oral delivery . Furthermore, CitationKreilgard et al. (1975) prepared a complex of HMM with gentisic acid species, to enhance apparent solubility and make it suitable for parenteral delivery. However, no significant results were achieved. The pharmacokinetic properties are often inappropriate or may be hampered, due to poor drug solubility. Moreover, it is very difficult to formulate oral dosage for such drugs. Oral bioavailability of ALT can be improved through its lymphatic delivery. Lymphatic delivery is mostly the preferred method to avoid first pass metabolism in peroral delivery (CitationDriscoll 2002). The transport of the drug through the lymphatic system reduces the hepatic first-pass effect and improves bioavailability, because the intestinal lymph vessels drain directly into the thoracic duct, followed by the venous blood, thus by-passing the portal circulation (CitationPorter and Charman 2001, CitationKhan et al. 2013). For this purpose, the lipid-based approach is used, and the drug ALT is incorporated into the lipid nanoparticles (SLNs). However, recent methods, using cyclodextrin-based nanocarriers, are gaining significant importance in the delivery of hydrophobic drugs. They provide a synergistic or additive effect (CitationGidwani and Vyas 2014).
SLNs came into existence in the early 1990s, and were advantageous compared to liposomes, emulsions, and polymeric nanoparticles. These lipid-based nanoparticles are made of solid lipid, which means lipids that remain solid at room temperature and body temperature. They are stabilized by the use of suitable surfactants, and can be delivered through the oral, topical, and parenteral routes (CitationWong et al. 2007). Moreover, there is no issue regarding the status of regulatory acceptance. SLNs are superior compared to polymeric and colloidal carriers, in terms of biocompatibility, stability, and scalability. Moreover, it is possible to achieve desired drug release, that is, controlled or sustained, through SLNs (CitationWolfgang and Karsten 2001). The drug release from SLNs can be modulated in order to optimize their blood levels. The unique advantages of SLNs are the absence of biotoxicity, avoidance of organic solvents, drug stability, high drug payload, and incorporation of both lipophilic and hydrophilic drugs. However, research into SLNs, conducted over the last 15 years, has been focused mostly on the pharmaceutical applications, including formulation, development and drug delivery (CitationMuller et al. 2011). All these features make SLNs promising and potential carriers for the optimized delivery of drugs with poor physicochemical properties.
The effect of process parameters and the physicochemical properties of SLNs, like particle size, surface morphology, drug release, etc., can be improved by optimization (CitationDas et al. 2011). The procedure of optimization involves systematic formulation of designs to minimize the number of trials, and analyzes the response surfaces in order to realize the effects of causal factors and to obtain the appropriate formulations with the target goals (CitationZhang et al. 2010). Statistical models are extensively used in diversified areas, especially in pharmaceuticals, to strengthen the art of drug formulation. Most of the hydrophobic drugs, like enalapril maleate (CitationSingh et al. 2011), simvastatin (CitationGambhire et al. 2011), lutein (CitationLiu and Wu 2010), sildenafil citrate (CitationGhasemian et al. 2013), etc., are optimized using factorial design and RSM. The objective of the present study was to develop a mathematical model using a BBD, combined with RSM, in order to deduce the adequate conditions to prepare SLNs with the desired optimized characteristics. This will help to determine the relationship between the selected independent variables and their responses. The variables selected are fitted in a three-factor, three-level BBD, with three replicates.
In the present work, the role of SLNs in oral delivery of ALT has been examined. Compritol® 888 ATO, Poloxamer-188, and soya lecithin, were selected as the solid lipid, surfactant, and cosurfactant respectively. SLNs loaded with ALT were prepared by the hot homogenization and ultrasonication method, and were optimized using 33 factorial response surface methodologies. They were further characterized for their mean particle size, loading parameters, entrapment efficiency, in vitro drug release behavior, and morphology.
Experimental
Materials
ALT was obtained as a gift sample from Spectra Lab. (Hyderabad, India). Poloxamer 188 was supplied by Signet Chemical Corporation Pvt. Ltd. (Mumbai, India). Soya lecithin was purchased from HiMedia Lab Pvt. Ltd. (Mumbai, India). Compritol® 888 ATO and Precirol® ATO 5 were kind gifts from Gattefosse (France). Glycerol monostearate(GMS), stearic acid (SA), cetyl alcohol (CA), and cetostearyl alcohol (CSA), were purchased from Loba Chemie Pvt. Ltd. (Mumbai, India). Purified water from an ultra-pure water system (Synergy UV water purification system, India) was used throughout the study. All other chemicals and solvents used in the study were of analytical grade.
Partitioning behavior of drug (ALT) in lipids
The choice of lipid was done on the basis of the solubility and partitioning behavior of ALT in different lipids. The partitioning behavior of ALT was tested in five different lipids, viz., Compritol® 888 ATO, Precirol® ATO 5, GMS, SA, CA, and CSA. An accurate weight of 25 mg of Altretamine was dispersed in a mixture of melted lipid (approx. 2 g) and hot distilled water (2 ml). This mixture was shaken for 30 min at 80°C in a hot water bath, and then centrifuged at 5000 rpm for 10 min. The aqueous phase obtained was filtered through a membrane filter (pore size 0.45 μm). The concentration of ALT in water was determined by UV spectroscopy (UV 1700-Spectrophotometer, Shimadzu, Japan) (CitationShailesh et al. 2012).
Preparation of SLNs
SLNs loaded with ALT were prepared by the hot homogenization-ultrasonication method (CitationAlex et al. 2011). Briefly, ALT (100 mg) was dissolved in melted lipid (Compritol 888 ATO), and this solution was then dissolved in 20 ml acetone, maintained at 75°C. The aqueous phase consisted of the surfactant (Poloxamer-188) and co-surfactant (soya lecithin), dissolved in 20 ml of distilled water to obtain a 2% solution, which was heated up to 80°C in a beaker. When a clear homogeneous lipid phase was obtained, the hot aqueous phase solution was added to the lipid phase maintained at 75°C, and homogenized at 15,000 RPM for 10 min using a high-speed homogenizer, UltraTurrax T10 (T-10 basic ULTRA-TURRAX® - IKA, Germany). The resulting pre-emulsion was then ultrasonicated using a probe sonicator (Frontline Sonicator) at 50 W for 5 min. Later, the mixture was poured into cold water (1–4°C) and stirred with a magnetic stirrer. The SLNs were allowed to recrystallize until room temperature, and then diluted up to 100 ml with deionized water, yielding an ALT-SLN dispersion.
Determination of optimal concentration of surfactant
The stability of lipid nanoparticles depends on the balance of emulsifiers/surfactants at the oil-water interface, and the nature of the oil phase (CitationMartini and Herrera 2008). For this, preliminary screening experiments were used to choose the ingredients for the production of SLNs, before the optimization of formulations in this study. All the ingredients screened in this study are generally recognized as safe (GRAS). Briefly, ALT (50 mg) was dissolved in 100 mg melted lipid (Compritol ATO 888), and the solution was then dissolved in 20 ml acetone. The surfactant was added to the aqueous dispersion of the cosurfactant at concentrations of 1%, 2%, 3%, 4% and 5% (w/v). The most suitable concentration of the surfactant was estimated from particle size, entrapment efficiency (EE), and drug loading (DL) of the prepared SLNs (CitationSong et al. 2006).
Experimental design and statistical analysis
Mathematical models based on statistics are extensively used to design the formulation of lipid-based nanoparticles; therefore, it is essential to investigate the independent variables which can affect the properties of SLNs in the desired formulation (Lewis et al. 2006). In this study, all the data are reported as mean ± standard deviation (n = 3). A 3-level experimental factorial design-response surface methodology was used to study the effect of different variables on formulation properties like mean particle size (PS) (Y1), percentage drug loading (% DL) (Y2), and entrapment efficiency (% EE) (Y3) of the prepared SLNs. Independent variables used in the study include drug concentration (X1), lipid concentration (X2), and surfactant concentration (X3). In order to optimize the ALT–SLNs, equations based on mathematical modeling were derived by computer simulation programming with Design-Expert® 9.0. The models were presented as three-dimensional (3D) response-surface graphs. Three dimensional surface plots were used to establish the relationship between independent variables and dependent variables (response).
The best-fitted models for statistical analysis were considered significant, with probability limits of the P value < 0.05. Predicted R2 value and one-way ANOVA were estimated to confirm the best fit of the model. The desirability function of particle size was at the minimum level, and that of entrapment efficiency and drug loading was at the maximum level, to optimize formulations (CitationZhang et al. 2010). Design-Expert software (version 9.0.1; Stat-Ease, trial version) was utilized for statistical analysis and graph plotting.
Evaluation of SLNs
Determination of mean particle size, PDI and zeta-potential of ALT-SLNs
The mean particle size (z-average) of the SLNs, and the poly dispersity index (PDI), as measures of the width of particle size distribution, were determined by dynamic light scattering (DLS), using a Zetasizer (Nano ZS 90, Malvern Instruments, UK) at 25°C with a scattering angle of 90o (CitationVenkateswarlu and Manjunath 2004). The SLN formulations were diluted with double-distilled water to weaken opalescence before measurement. The surface charge was estimated by measuring the zeta potential of SLNs based on the Helmholtz-Smoluchowski equation, using the same equipment at 25°C, with an electric field strength of 23 V/cm.
Where ζ is the zeta potential, EM is the elecrophoretic mobility, η is the viscosity of the dispersion medium and ϵ is the dielectric constant.
Determination of %EE and %DL of ALT-SLNs
The percentage of EE and DL were evaluated by determining the amount of free ALT in the aqueous solution of surfactant & cosurfactant, which was separated by using the cooling centrifuge. The free (unentrapped) drug in the SLNs dispersion was sedimented by controlled centrifugation (Remi Instruments Ltd., Mumbai, India) at 12,000 rpm, 4°C, for 20 min, and the SLN dispersion was decanted without disturbing (CitationLamprecht et al. 2000). The concentration of ALT in the aqueous phase was determined using a UV–visible spectrophotometer (UV 1700, Shimadzu, Japan) at λ max 226 nm. The %EE and %DL were calculated by the following equations:
Similarly, % drug loading (DL) was determined as the percentage of drug/lipid ratio.
Differential scanning calorimetry
The DSC studies of pure drug (ALT), Compritol® 888, physical mixture (1/1), and freeze dried ALT-SLNs of the optimized batch were performed using a Shimadzu DSC-60 Systems (Shimadzu, Kyoto, Japan) equipped with a computerized data station TA-50WS/PC. The thermal behavior of samples was studied by heating in a sealed flat bottom aluminum pan, using an empty sealed pan as reference, over the temperature range of 20–300°C, at a rate of 10°C/min and under a constant flow of dry nitrogen (CitationVenkateswarlu and Manjunath 2004, CitationRahman et al. 2010).
Transmission electron microscopy study
The surface morphology and shape of optimized SLNs loaded with ALT was analyzed by Transmission Electron Microscopy (TEM) (model TECNAI 200 Kv TEM, Fei Electron Optics, Japan). The optimized ALT-SLN aqueous dispersion was placed on copper grids coated with carbon film and stained with negative stain using a drop of 2% (w/w) aqueous solution of phosphotungstic acid for 30 s. Excess staining solution was washed out by filter paper, leaving a thin aqueous film on the surface. After staining, samples were dried at room temperature for 10 min to carry out investigations. The magnification for the TEM images was 150000X (CitationZhang et al. 2010, CitationLiu and Wu 2010).
In vitro release of ALT from SLNs
The in vitro release study of ALT from the optimized SLNs was performed by using a modified Franz diffusion cell. The dialysis membrane (molecular weight cutoff 10,000 Da) was kept in double-distilled water for 24 h before mounting it on the diffusion cell. The ALT-SLN aqueous dispersion (2 ml) was placed in the donor compartment, and the receptor compartment was filled with dissolution medium (pH 6.8 phosphate buffer), and the temperature was maintained at 32 ± 0.5°C by continuous stirring at 100 rpm. At regular time intervals, aliquots of samples (0.1 ml) were withdrawn from the receptor compartment and an exact volume of dissolution medium was added in the same compartment, to maintain constant volume throughout the study. The amount of ALT released was analyzed by UV-visible spectrophotometer (Shimadzu, UV 1700, Japan) (CitationPaliwal et al. 2009).
The release kinetics profile from the optimal ALT-SLNs was fitted on zero order, first order, Higuchi model, Korsmeyer-Peppas model and Hixson-Crowell model (CitationCosta and Sousa Lobo 2001, CitationDash et al. 2010).
Stability studies
The storage stability studies of the optimized ALT-SLN dispersion was performed as per the ICH guidelines. For this, 10 ml of ALT-SLN dispersion with the drug of concentration 2 mg/ml was taken into glass vials and stored at two different temperature conditions, 4°C and 25°C, for a period of 3 months. The stability study was confirmed by evaluating the effect on particle size, zeta potential, and percentage entrapment efficiency in the SLN dispersion. The sampling was done with a frequency of 1 month.
Results and discussion
Partitioning behaviour of ALT in lipids
The concentration of ALT in the aqueous phase was determined from the standard curve prepared in methanol. The partition coefficients obtained were 76.14 ± 12.60, 54.13 ± 1.40, 46.22 ± 1.05, 21.32 ± 0.49 and 32.65 ± 3.29 for Compritol® 888 ATO, Precirol® ATO 5, glycerol monostearate, stearic acid, cetyl alcohol and cetostearyl alcohol, respectively. On the basis of results obtained, it is clear that the maximum solubility of ALT is in Compritol® 888 ATO, more than in other lipids. Thus, Compritol® 888 ATO is used as the lipid phase for the entire study.
Preparation of SLNs loaded with ALT
The hot homogenization-ultrasonication method is the easiest and most feasible method for the production of SLNs in laboratories. Compritol® 888 ATO, Poloxamer 188, and soya lecithin, were used as lipid, surfactant, and co-surfactant respectively. The homogenization speed was optimized at 15,000 rpm for 10 min and the sonication time was 5 min at 50W.
Optimization of surfactant concentration
The surfactants tested in this study include Tween 20, Tween 80, Span 60 and Pluronic F68 (Poloxamer 188). Poloxamer 188 is a non-ionic emulsifier which offers added steric stabilization effects to lipid nanoparticles, by avoiding aggregation of the nanoparticles in the system. In addition, it is a good surfactant for oral delivery, as it can easily manipulate the p-glycoprotein efflux system and cytochrome P-450, thereby improving the oral absorption of hydrophobic drugs. Therefore, Poloxamer 188 was used as surfactant in the study, and its concentration was optimized. On the basis of preliminary studies, the surfactant concentrations ranging from 1% to 5% (w/v) were selected for evaluating the effect of surfactant concentration on mean particle size, percentage of drug EE and DL. A 2% concentration of surfactant (w/v) led to the smallest particle size, highest % EE and %DL. At this concentration, the mean particle size, %EE and %DL of SLNs were 109.42 ± 0.46, 89.32 ± 1.08 and 1.48 ± 0.186, respectively. So, from the above results, a 2% concentration of Poloxamer 188 as the surfactant was determined to be the optimum.
Optimization of formulas
The BB factorial design, in combination with RSM, is an effective approach for investigating maximum variables at different levels, with a limited number of experimental runs (CitationZhang et al. 2009). In the present study, the three-factor, three-level factorial design is used with three different responses. The variables used in the study were selected on the basis of preliminary experiments. From the results of optimization, the three dependent values ranged from 96.24% – 81.24% for EE, 1.48% – 0.16% for DL, and 139.54 nm – 82.16 nm for PS. It was seen that the quadratic model was best-fitted for all the responses studied, that is, mean particle size, %EE and %DL. The quadratic equations generated for different responses are as under:
Where, X1, X2 and X3 represent the coded values of the drug concentration, lipid concentration and surfactant/cosurfactant ratio, respectively. The positive sign of values of a factor in the above quadratic equation indicates a synergistic effect or an enhancement of that particular response, and vice versa. The lack-of-fit was not significant in all the cases, at 95% confidence level. However, all the remaining parameters were significant, at P 0.05 or lower. shows that the average experimental values of the three batches of SLNs prepared using the optimized range were very close to the predicted values. The results showed low percentage bias, suggesting that the optimized formulation was consistent and reasonable.
Table I. Comparison of the observed and predicted values in the SLN prepared under predicted optimum conditions.
Response-surface plots
According to the surface response methodology using the BB design, a total of 17 experimental runs were performed for three levels and three factors. The detailed summary of experimental runs using dependent and independent variables is shown in . The three-dimensional (3D) response- surface plots generated by the Design-Expert® software (trial version 9.0.1.) was used to study the pattern of interaction between variables. The values of various statistical parameters like multiple correlation coefficients (R2), F-value, P-value, coefficient of variation, standard deviation, predicted residual sum of squares, and mean square values, are shown in . The response-fitting results indicated that optimized SLNs with high % EE, high % of DL, and small mean particle size, were obtained at the ALT (drug) concentration of 0.99%, lipid concentration of 0.16%, and surfactant/cosurfactant ratio of − 0.403 [coded values] respectively. The graphs show that with an increase in the concentration of lipid, the mean particle size and % EE increased, with a decrease in % DL. Particle size significantly increased with increase in drug concentration, but decreased at concentrations above 0.075%. The values of zeta potential in all the cases were more than − 33.42 ± 0.19 mV, indicating good stability of the SLN dispersion. However, in case of the surfactant/cosurfactant ratio, an optimum concentration ratio (1/1) led to minimum particle size and maximum % EE and % DL. The response-surface graphs showed that all the selected dependent variables were statistically significant. The surface plot showing the effect of different variables on the particle size of ALT- SLNs is shown in .
Figure 1. Surface plots showing the effect of variables on (A) particle size (B) percentage of entrapment efficiency and (C) percentage of drug loading.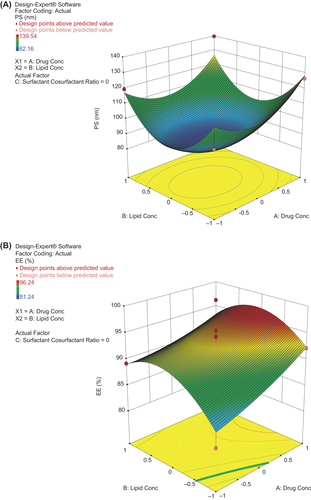

Table II. Independent variables, along with their coded and actual values, along with their respective responses for different batches of ALT-SLNs.
Table III. Summary of the results of regression analysis for responses, and analysis of variance for particle size, EE and DL.
Particle size, zeta potential and PDI of ALT-loaded SLNs
The values for particle size, zeta potential and PDI of the ALT-loaded SLNs are depicted in . The mean particle sizes, PDI values and zeta potential of all the 17 formulations were in the range of 82–139 nm, 0.12–0.41 and 16.20–27.17 mV, respectively.
Effect of drug concentration on particle size, zeta potential, and PDI
There was remarkable and significant difference in the particle size of SLNs prepared with different drug concentrations (DC) ranging from 0.025 to 0.075%. Initially, the particle size significantly increased with an increase in DC, but later on, at higher values of DC (above 0.075%), the particle size decreased. The values of PDI also increased with higher DC, this may be due to the presence of a higher amount of drug. The zeta potentials of all the 17 SLN dispersions indicated good stability of the SLN dispersions. Thus, in the present study, 0.05% DC was selected for the final preparation of the ALT-loaded SLN dispersion.
Effect of lipid concentration on the particle size, PDI and zeta potential
The concentration of lipid also produced significant effect on the particle size, zeta potential, and PDI of the SLN dispersion, as it solubilized the drug present in the formulation. The response-surface plot shows that with the increase in lipid concentration from 1% to 3%, the mean particle size increased in all the cases. The SLN dispersions which contained the highest amount of lipid, comparatively, showed the largest particle size, greater than that of the dispersions with low lipid content. The zeta potential also varied with increase in lipid content.
The particle size increased on increasing the lipid concentration (LC). Efficient reduction of particle size was observed in dilute dispersions containing low lipid, due to uniform distribution of sonication energy. In most of the literature, it is reported that increasing the LC leads to larger sized particles with broader particle size distribution (CitationShailesh et al. 2012, CitationAlex et al. 2011).
Effect of Surfactant and Cosurfactant ratio on the particle size, PDI and zeta potential
The surfactant/cosurfactant ratios produced a predominant effect on the particle size and the stability of the ALT-SLN dispersion. A higher ratio led to a reduction in surface tension, prevented the agglomeration of particles, and led to a decrease in particle size. This decrease in particle size with increase in the ratio was seen up to the optimal ratio (1/1), and after that, further increase in the surfactant concentration produced an inverse effect, i.e., an increase in the mean particle size at a constant amount of lipid and the increase of cosurfactant concentration, and vice versa. This shows that increase in surfactant and cosurfactant concentrations at optimal level reduces the particle size significantly. However, no considerable effect was observed in the PDI, with the changes in ratio of surfactant and cosurfactant. The zeta potential is an indication of the stability of a colloidal dispersion through electrostatic repulsion between the charged particles. The observed values of zeta potential indicate that the surface charge of the almost all the particles was negative. Moreover, there was no significant correlation between the zeta potential and surfactant/cosurfactant ratio.
Percentage entrapment efficiency and percentage drug loading of ALT-loaded SLNs
The entrapment efficiency (EE) and drug loading (DL) percentages of all the 17 SLN dispersions were in the range of 81.20–96.25% and 0.16–1.48% respectively. The percentage of EE and the DL capacity were significantly affected by the nature of the drug (ALT). shows the percentage of EE and percentage of DL of all the SLN dispersions loaded with ALT.
Effect of drug concentration on percentage of EE and percentage of DL
The percentage of EE significantly decreased with an increase in DC. This is because the EE directly depends on the amount of drug added (i.e., DC). As lipids also have certain drug-loading capacity, the addition of excess of drug led to an increase in the amount of unencapsulated drug (i.e., decrease in EE). The percentage of drug loading increased with higher DC, up to 0.075%, after which the amount of drug added was beyond the encapsulation capacity of the lipid used.
Effect of surfactant to cosurfactant ratio on percentage of EE and DL
The ratio of surfactant concentration to cosurfactant concentration played a vital role in the solubility of drug. High percentage of EE and DL were obtained with the optimum surfactant/cosurfactant concentration ratio (1/1), compared to the other two ratios (1/2, 1/3). Response-surface plots showing the effect of different variables on the percentage of EE and DL are shown in [ and ].
Effect of lipid concentration on Percentage EE and DL
The lipid concentration produced a significant effect on the percentage of EE and DL. The response-surface curve showed that an increase in LC led to a higher percentage of EE. This is because of the fact that more amount of lipid was available for dissolving the drug (ALT).
As estimated, the EE increased with the increase in LC. This is because a higher amount of lipid was available for drug encapsulation at high LC, which led to higher EE, with significantly remarkable increase in particle size. In case of low LC, the opposite behavior was observed. However, the percentage of DL significantly decreased with increasing LC. This was because of the fixed DC used during formulation. Based on these observations, LC of 2%w/v was selected as the value achieving the best results.
DSC studies
The DSC thermogram of the drug (ALT), lipid (Compritol ATO 888), physical mixture (1/1), and SLNs loaded with ALT, is shown in . The melting point of ALT is in the range of 171–175°C. The DSC thermogram of ALT and Compritol ATO 888 showed a sharp endothermic peak at 173°C and 75°C respectively. The physical mixture showed no significant change in the position of endothermic peaks. Thus, there was no chemical interaction between ALT and Compritol ATO 888. SLNs containing ALT showed two endothermic peaks in the DSC thermogram, one at 71°C for lipid, and another at around 155°C for mannitol (cryoprotectant used in lyophilization of SLNs), but no peak was observed for ALT. The peak of Compritol® 888 ATO in the SLN-formulation showed a shift towards lower temperature. This may be due to a reduction in particle size and increase in surface area, leading to a decrease in melting enthalpy, as compared with heat flow through larger crystals, which requires more time. This result suggests that ALT was entrapped in SLNs and existed in the amorphous state.
Figure 2. (A) DSC thermogram of altretamine (ALT), Compritol ATO 888, physical mixture and ALT-SLNs. (B) TEM image of optimized ALT-SLNs.
Transmission electron microscopy
On the basis of optimization, the shape and surface morphology of the selected SLN dispersion containing ALT was determined by TEM. TEM was done to study the particle size and shape of the samples. The results of TEM showed smooth spherical surface morphology of the SLNs. This confirmed that the particles were spherical in shape, with narrow size distribution, and no aggregation. The TEM image is shown in .
In vitro drug release studies
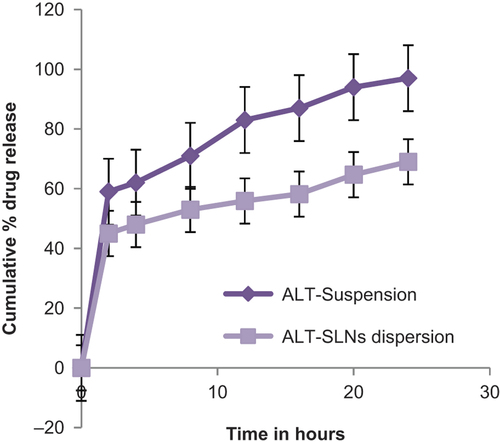
The cumulative percentage drug release of optimized ALT-SLN dispersion was determined for 24 h. The in vitro release profile of the optimized ALT-SLN suspension in 6.8 pH phosphate buffer at 37°C is shown in . From the graph, it is clear that the suspension of ALT released almost 97.51% ± 0.024% of the drug at the end of 24 h, while the SLNs loaded with ALT released 69.19% ± 0.52% of drug after 24 h. The drug release pattern of SLNs loaded with ALT was bi-phasic in nature; with an initial burst release followed by sustained drug release. The initial burst release of about 45% was observed within the first 2 h, and after that, the release rate was sustained. This burst release may be due to the presence of the free drug ALT in the external phase and on the surface of the SLNs. The initial burst release rate was also affected by the change in concentration of lipid and surfactant in the external phase. When the concentration of lipid increased, the initial burst release rate decreased, due to the higher concentration of drug present in the inner core. Meanwhile, as the surfactant concentration increased, the initial burst release rate also increased, due to an increase in the drug's solubility in the external phase. This bi-phasic release pattern (burst release) can be used to improve the penetration of the drug, and sustained release can provide a drug supply for a prolonged time period.
Figure 3. Release profile of the optimized ALT-SLN dispersion in 6.8 pH phosphate buffer at 37°C.
The release kinetics from the optimized formulation of ALT-SLNs was compared to different kinetic models. Results showed that the model was best fitted with data in the Higuchi equation (R2 = 0.986). This model explains the drug release from an insoluble matrix, time-dependently based on Fickian diffusion (CitationHiguchi 1963). The release constant was computed from the slope of the suitable plots, and the regression coefficient was determined (). Moreover, the values obtained proved that next to the Higuchi model, the best linearity was followed by the first-order kinetics model (R2 = 0.914).
Table IV. Model-fit for optimized ALT-SLNs.
Stability studies
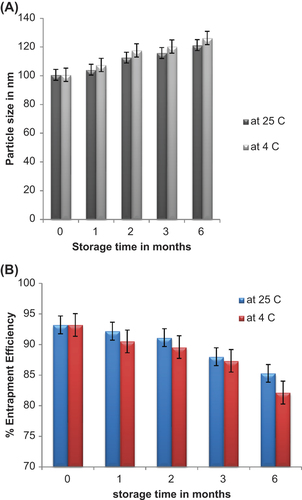
Stability studies of optimised SLNs under two storage conditions were carried out, and the changes in particle size, zeta potential, and EE were evaluated as the prime parameters. The results showed that there was a slight increase in the particle size during the three months of storage at 4°C and 25°C, from 100.64 ± 6.54 nm to 112.64 ± 1.53 nm and 117.26 ± 1.17 nm respectively. However, in case of zeta potential, no significant changes were observed after three months of storage. The percentage of EE of the optimised SLNs was found to be 93.21% ± 0.68% and after 3-month-storage at 4°C and 25°C, it was found to be 91.05% ± 0.72% and 89.27% ± 0.11% respectively. shows the changes in particle size against storage time. The particle sizes of SLNs increased significantly during the storage periods at 4°C, whereas the particle sizes increased slowly when stored at 25°C. This indicates that the drug ALT can remain within the SLNs for a sufficient time. In addition, the percentage of EE also decreased significantly during storage at 4°C []. Thus, the optimized ALT-SLNs was found to be stable at two different storage temperature conditions for 3 months.
Figure 4. (A) Effect of storage conditions on the particle size of SLNs. (B) Effect of storage conditions on the percentage of entrapment efficiency of SLNs.
Conclusion
The hot homogenization-sonication method was employed to prepare the ALT-loaded SLNs. The SLNs were optimized using the Box-Behnken factorial design–response surface methodology. The experimental values of the prepared SLNs under the optimum conditions were mostly close to the predicted values. ALT-SLNs, under the optimized conditions, gave rise to an % EE of (93.25 ± 1.23), percentage of DL of (1.15 ± 3.41) %, and mean diameter of (100 ± 1.08) nm. The results of the in vitro drug release studies demonstrated significantly low release of ALT (69.19 ± 0.52%) from ALT-SLNs, as compared to the dispersion of pure drug (97.51%). These results indicate that the SLNs can be potentially exploited as a carrier system, with an initial dose and sustained release when therapeutically desired. Thus, RSM is a suitable tool for optimization of the drug-loaded SLNs to achieve a biphasic release pattern. Further, parameters can be optimized by systemic approach for therapeutic effect of these SLNs in vivo. Therefore, future studies about the structure, size, efficacy, and toxicity of solid lipid nanoparticles loaded with ALT is crucial.
Acknowledgement
The authors are thankful to the Director, University Institute of Pharmacy, Pt Ravi Shankar Shukla University Raipur, Chhattisgarh, for providing necessary infrastructural facilities. The authors are also thankful to CCOST/MRP/2012 Endt. No. 1926 and UGC-MRP F. No. 42-706/2013 (SR), for providing financial assistance relating to this work. One of the authors (BG) is thankful to UGC-BSR for JRF, Department of Science and Technology (DST-FIST).
Declaration of interest
The authors report no declarations of interest. The authors alone are responsible for the content and writing of the paper.
References
- Alex MR, Chacko AJ, Jose S, Souto EB. 2011. Lopinavir loaded solid lipid nanoparticles (SLN) for intestinal lymphatic targeting. Eur J Pharm Sci. 42:11–18.
- Amidon GL, Lennernas H, Shah VP, Crison JR. 1995. A theoretical basis for a biopharmaceutical drug classification: the correlation in vitro drug product dissolution and in vivo bioavailability. Pharm Res. 12:413–420.
- Costa P, Sousa Lobo JM. 2001. Modeling and comparison of dissolution profiles. Eur J Pharm Sci. 13:123–133.
- Damia G, Dincalci M. 1995. Clinical pharmacokinetics of altretamine. Clin Pharmacokinet. 28:39–48.
- Das S, Ng WK, Kanaujia P, Kim S. 2011. Formulation design, preparation and physicochemical characterizations of solid lipid nanoparticles containing a hydrophobic drug: Effects of process variables. Colloid Surf B. 88:483–489.
- Dash S, Murthy PN, Nath L, Chowdhury P. 2010. Kinetic modelling on drug release from controlled drug delivery systems. Acta Pol Pharm. 67:217–223.
- Driscoll MC. 2002. Lipid-based formulations for intestinal lymphatic delivery. Eur J Pharm Sci. 15:405–415.
- Gambhire MS, Bhalekar MR, Gambhire VM. 2011. Simvastatin loaded Solid lipid nanoparticles: formulation optimization using Box Behnken design, characterization and in vitro evaluation. Current Pharm Res. 1:157–164.
- Ghasemian E, Vatanara A, Najafabadi AR, Darabi M. 2013. Preparation, characterization and optimization of sildenafil citrate loaded PLGA nanoparticles by statistical factorial design. DARU J Pharm Sci. 21:68–78.
- Gidwani B, Vyas A. 2014. Synthesis, characterization and application of Epichlorohydrin-β-cyclodextrin polymer. Colloid Surf B. 114:130–137.
- Gidwani B, Vyas A. 2013. The potentials of nanotechnology-based drug delivery system for treatment of ovarian cancer. Artif Cells Nanomed Biotech. 1–7.
- Hansen LA, Hughes TE. 1991. Altretamine. DICP. 25:146–152.
- Hariharan M, Price JC. 2002. Solvent, emulsifier and drug concentration factors in poly (D, L-lactic acid) microspheres containing hexamethylmelamine. J Microencapsul. 19:95–109.
- Higuchi T. 1963. Mechanism of sustained-action medication. Theoretical analysis of rate of release of solid drugs dispersed in solid matrices. J Pharm Sci. 52:1145–1149.
- Khan AA, Mudassir J, Mohtar N. 2013. Advanced drug delivery to the lymphatic system: lipid-based nano formulations. Int J Nanomed. 8:2733–2744.
- Kreilgard B, Higuchi T, Repta AJ. 1975. Complexation in formulation of parenteral solutions: solubilization of the cytotoxic agent hexamethylmelamine by complexation with gentisic acid species. J Pharma Sci. 64:1850–1855.
- Lamprecht A, Ubrich N, Perez MH, Lehr M, Maincent P. 2000. Influences of process parameters on nanoparticle preparation performed by a double emulsion pressure homogenization technique. Int J Pharm. 196:177–182.
- Lewis GA, Mathieu D, Phan-Tan-Luu R. 1999. Pharmaceutical Experimental Design: Drugs and Pharmaceutical Sciences, Vol. 92, 1st ed. New York: Marcel Dekker, : p. 235.
- Liu CH, Wu CT. 2010. Optimization of nanostructured lipid carriers for lutein delivery. Colloid Surf A Physicochem Eng A. 353:149–156.
- Martini S, Herrera ML. 2008. Physical properties of shortenings with low-trans fatty acids as affected by emulsifiers and storage conditions. Eur J Lipid Sci Technol. 110:172–182.
- Muller RH, Shegokar R, Keck CM. 2011. 20 years of lipid nanoparticles (SLN and NLC): present state of development and industrial applications. Curr Drug Discov Technol. 3:207–227.
- Paliwal R, Rai S, Vaidya B, Khatri K, Goyal AK, Mishra N, et al. 2009. Effect of lipid core material on characteristics of solid lipid nanoparticles designed for oral lymphatic delivery. Nanomedicine. 5:184–191.
- Porter C, Charman WN. 2001. In vitro assessment of oral lipid based formulations. Adv Drug Deliv Rev. 50:S127–S147.
- Rahman Z, Zidan S, Khan MA. 2010. Non-destructive methods of characterization of risperidone solid lipid nanoparticles. Eur J Pharm Biopharm. 76:127–137.
- Shailesh S, Veena S, Vivek R, Patil U. 2012. Formulation and evaluation of Nimodipine-loaded solid lipid nanoparticles delivered via lymphatic transport system. Colloid Surf B. 97:109–116.
- Singh MR, Singh D, Saraf S. 2011. Formulation optimization of controlled delivery system for antihypertensive peptide using response surface methodology. Am J Drug Dis Dev. 1:174–187.
- Song KC, Lee HS, Choung IY, Cho KI, Choi EJ. 2006. The effect of type of organic phase solvents on the particle size of poly (D, L-lactide-co-glycolide) nanoparticles. Colloids Surf A Physicochem Eng Asp. 276:162–167.
- Sun J, Deng Y, Wang S, Cao J, Gao X, Dong X. 2010. Liposomes incorporating sodium deoxycholate for hexamethylmelamine (HMM) oral delivery: development, characterization and in vivo evaluation. Drug Deliv. 17:164–170.
- Thigpen T. 1987. Chemotherapy for advanced or recurrent gynaecologic cancer. Cancer. 60:2104–2116.
- Venkateswarlu V, Manjunath K. 2004. Preparation, characterization and in vitro release kinetics of clozapine solid lipid nanoparticles. J Control Release. 95:627–638.
- Wiernik PH. 1992. Hexamethylmelamine and low or moderate dose cisplatin with or without pyridoxine for treatment of advanced ovarian carcinoma: a study of the eastern cooperative oncology group. Cancer Invest. 10:1–9.
- Wolfgang M, Karsten M. 2001. Solid lipid nanoparticles Production, characterization and applications. Adv Drug Deliv Rev. 47: 165–196.
- Wong HL, Bendayan R, Rauth AM, Li Y. 2007. Chemotherapy with anticancer drugs encapsulated in solid lipid nanoparticles. Adv Drug Deliv Rev. 59:491–504.
- Zhang J, Fan Y, Smith E. 2009. Experimental design for the optimization of lipid nanoparticles. J Pharm Sci. 98:1813–1819.
- Zhang X, Liu J, Qioa H, Liu H, Ni J. 2010. Formulation optimization of dihydroartemisinin nanostructured lipid carrier using response surface methodology. Powder Technol. 197:120–128.