
 ?Mathematical formulae have been encoded as MathML and are displayed in this HTML version using MathJax in order to improve their display. Uncheck the box to turn MathJax off. This feature requires Javascript. Click on a formula to zoom.
Abstract
Chondroitin sulfate (Cs)-imprinted poly(hydroxyethyl methacrylate)-based macroporous cryogels (CsMIP) were prepared for selective recognition of Cs from an aqueous solution. The selective binding sites for Cs were maintained using vinyl imidazole-Cu2+ functional groups, during the precomplexation step in the polymerization procedure. Newly synthesized CsMIP cryogel columns were characterized. The separation of Cs from aqueous solutions was studied, both in the continuous system and in the fast protein liquid chromatography (FPLC) system. According to the FPLC studies, the Rs value obtained was 14.72, which shows that the CsMIP cryogel column can successfully separate Cs from aqueous solutions of Cs in the presence of competitor molecules.
Introduction
Glycosaminoglycans (GAGs) are long, unbranched, linear polysaccharides consisting of a repeating disaccharide unit (CitationMurugesan et al. 2008). GAGs are the major constituents of the extracellular matrix of the body. There are five GAG chains: heparin, heparan sulfate, chondroitin sulfate, keratin sulfate, and dermatan sulfate. GAGs selectively bind to different growth factors, enzymes, morphogens, cell adhesion molecules, and cytokines. Their multiple biological roles are dependent on this binding ability (CitationGallagher and Turnbull 1992, CitationSpillmann and Lindahl 1994, CitationToido and Linhardt 1996, CitationRostand and Esko 1997, CitationCapila and Linhardt 2002, CitationRabenstein 2002, CitationEsko and Selleck 2002). Recent studies in biochemistry, cell and developmental biology have shown that the GAGs are very important structural components that can play a vital role in regulating the cellular and physiological events (e.g. cell proliferation and differentiation, cell–cell and cell–matrix interactions, etc.). That's why these macromolecules attract great attention in the fields of biochemistry, pathology, and pharmacology. Most of the GAGs are produced from natural substances by extraction and purification methods, and are used for the production of several drugs. Although GAG-containing products are being marketed increasingly nowadays, the success of the treatments using these products depends on the high quality of GAGs used. In general, during the production/purification processes, GAG chains can be degraded and transformed to other GAG chains that may cause some serious side effects (i.e. allergic reactions, avian flu, etc.). That's why the separation and detection of the GAG chains in pharmaceuticals is very important for controlling the quality of the GAG products that are being marketed. Chondroitin sulfate is composed of disaccharide units containing N-acetylgalactosamine (GalNAc) and uronic acid, joined by β(1→4) or β(1→3) linkages (CitationTrowbridge and Gallo 2002), and it is one of the most significant impurities in anticoagulant (heparin) solutions, dietary supplements, and other pharmaceuticals. The use of anticoagulants is widespread in pharmaceuticals all over the world. (CitationChong 2003, CitationJang and Hursting 2005, CitationBaydemir and Denizli 2014). Recently, some health authorities have been dealing with reports of the side effects of the anticoagulants and focusing on producing safe anticoagulants without impurities (US Food and Drug Administration (FDA) and the United States Pharmacopeia (USP)) (CitationBendazzoli et al. 2010). Several methods reported in literature involve capillary electrophoresis (CEC) (CitationMalavaki et al. 2008), colorimetric measurements (CitationBitter and Muir 1962), photometric titrations (CitationLiang et al. 2002), high performance liquid chromatography (HPLC) (CitationChoi et al. 2003) and agarose gel electrophoresis (CitationTyler et al. 2002), to determine the Cs content in different GAG samples. Due to the fact that these methods are quite expensive and time consuming, with most of them requiring pre-treatment, it is very important to develop alternative methods. In this study, the molecular imprinting technique has been studied for Cs recognition, and reported, to the best of our knowledge, for the first time in literature. Molecularly imprinted polymers (MIP) are prepared in the presence of the target molecules. The target molecules are pre-organized with functional monomers, and then the MIPs can be produced by forming a 3D polymeric network around the pre-organized complex. Once the target molecules were removed from the MIPs, the target-specific recognition sites were obtained, with memories of the shape and functional group. The molecular imprinting technique enables the production of selective, cost effective, and stable materials for selective recognition of the target molecules (CitationBaydemir et al. 2007, CitationTakeuchi et al. 1999, CitationDerazshamshir et al. 2010, CitationAndaç and Denizli 2014, CitationBaydemir and Denizli 2014). There are a lot of studies reported on molecular imprinted cryogels for different applications (CitationLozinsky et al. 2003, CitationErgün et al. 2012, CitationPerçin et al. 2013, CitationBaydemir et al. 2014). Cryogels are novel polymeric matrices that are constructed with large interconnected pores. Their macropores make them attractive materials for studying with viscous samples (e.g. blood, plasma or plant/animal tissue extracts), and they have gained great attention in the fields of biotechnology, biomedicine and pharmaceuticals. From the point of view of the current study, the molecular imprinting technique was used for the selective recognition of Cs in aqueous solutions. Cs-imprinted poly(2-hydroxyethyl methacrylate)-based (PHEMA-based) cryogel columns were newly synthesized in the presence of the Cs molecules, and the Cs recognition sites were generated on a PHEMA cryogel column by using vinyl imidazole-Cu2+ pre-organized monomers [(PHEMA-VIM-Cu2+)]. The characterization studies were performed using swelling tests, FTIR, and SEM studies. The efficiency of selective recognition of Cs from aqueous solutions was investigated by FPLC studies.
Experimental
Materials
Chondroitin sulfate B (Cat No: 4384), was obtained from Sigma (St. Louis, MO, USA), Vinyl 2-hydroxyethyl methacrylate (HEMA) was purchased from Sigma, N,N,N,N-tetramethyl ethylene diamine (TEMED) and ammonium per sulfate (APS) were supplied by Bio-Rad (Hercules, CA, USA), methylene-bis acrylamide (MBAAm) was from Acros (Geel, Belgium). Heparin Sodium İnj. Braun (25.000 IU/5mL, Melsungen, Germany). All chemicals used in this study were of analytical reagent grade, and all water used in experiments was deionized (DI) water (Barnstead (Dubuque, IA) ROpure LP® reverse osmosis unit). All buffers and the solutions were prefiltered using a 0.2 μm membrane (Sartorius, Gottingen, Germany).
Synthesis of CsMIP/NIP columns
Cryogels were synthesized in the presence of excess of water molecules in a monomer solution. The cryogelation occurs in semi-frozen media. At first, the water molecules are frozen and form ice crystals. Then, the monomers start to gelate around them. After the cryogelation reactions are complete, the ice crystals are melted to form interconnected macropores of the cryogel column (CitationLozinsky et al. 2003, CitationBaydemir and Denizli 2014). Initially, the VIM/Cu2+ complex is pre- organized with Cs molecules (Chondroitin Sulfate B); 2 mmol of VIM and 1 mmol of copper nitrate (Cu(NO3)2. 5H2O) were dissolved in 1 mL of deionized water and mixed magnetically for 2 h, and then 0.02 mmol of Cs was added. The final precomplexation solution was stored at + 4°C over night for completing the complexation. The HEMA-based cryogels were synthesized according to the previously published procedure (CitationBaydemir and Denizli 2014). 10.70 mmol of HEMA monomer and 1.80 mmol of MBAAm cross-linker were dissolved in DI water. The VIM/Cu2+-Cs complex was added into the HEMA/MBAAm monomer solution in an ice bath. The monomer mixture included 20 mg of Cs, with a final monomer ratio of 10% (w/v). Then, free radical polymerization was initiated by TEMED (1% w/w) and APS (1% w/w) initiator couples. It is important to mix all reagents in an ice bath. This mixture was poured into plastic syringes (3 mL, ID 1.5 cm) immediately, and frozen at − 12°C. After 16 h, the ice crystals in the CsMIP cryogel column were defrosted at room temperature to form interconnected macropores in the cryogel structure. In order to remove unreacted monomers, the synthesized CsMIP columns were washed with an ethanol/water solution (25/75, v/v), and water. Then, the columns produced were stored at + 4°C, in swollen form, until use. The non-imprinted polymer (NIP) columns were synthesized using the same procedure, without using Cs molecules. The NIP columns were used to investigate the amount of Cs adsorption onto columns without specific cavities.
It is very important to monitor Cu2+ leakage from both the CsMIP and NIP columns at study conditions, to ensure the stability of the synthesized columns. Cu 2+ amounts were detected using Dionex BioLC and the Post Column Reactor (IonPac CG5A Guard (P7N 046104) and CS5A Analytical Column (P/N 046100) with G550 Gradient Pump, LC25 Column Oven (USA)).
Template removal studies
Template removal studies are one of the most important areas of molecular imprinting studies, to obtain the desired amounts of the specific cavities. The Cs molecules were removed from the CsMIP columns using acetate buffer (pH 4, 100 mM). The CsMIP column was connected to a peristaltic pump (Watson-Marlow, Wilmington, MA, USA), and 20 mL of acetate buffer was passed through the column for 2 h. Then, the column was washed with 20 mL of water for 30 min. The amount of Cs, in both elute and washing solutions, was determined using a UV spectrophotometer at 280 nm. This procedure was repeated until no Cs was detected in the washing solution.
Characterization studies
The newly synthesized CsMIP/NIP columns were characterized using swelling tests, scanning electron microscope (SEM), Fourier Transform Infrared Spectroscopy (FTIR), and Brunauer–Emmett–Teller (BET) studies. The swelling behavior was determined in DI water. The CsMIP was allowed to swell in DI for 24 h, and the weight of the swollen column was recorded. Then, the swollen cryogel was freeze dried at − 50°C (Christ-Alpha 1-2 LD freeze dryer, Maryland, USA), and the weight of the dried cryogel was recorded as well. The swelling ratio of the CsMIP cryogel was calculated according to following equation:
Here, W0 and Ws are the weights of cryogel before and after water uptake, respectively. The specific surface area of CsMIP and NIP columns in the dry state was determined by multipoint BET apparatus (Quantachrome Nova 2200e, USA). The morphology of CsMIP and NIP cross sections was investigated by SEM, using a JEOL JSM 5600 scanning electron microscope (JEOL, JSM 5600, Tokyo, Japan). FTIR spectra of Cs, VIM/Cu2+ and VIM/Cu2+-Cs precomplex, and the CsMIP and NIP columns, were obtained using the FTIR spectrophotometer (FTIR 8000 Series, Shimadzu, Japan).
Adsorption studies
The adsorption of Cs onto the CsMIP and NIP cryogel columns was studied in a continuous system of. 20 mL of deionized water passed through the column for 10 min before applying the Cs solutions to the columns. The effect of the initial Cs concentration on the Cs adsorption capacity was investigated, to obtain the maximum adsorption capacities of both CsMIP and NIP columns. Ten milliliter samples of Cs solutions were pumped through the columns for 2 h at room temperature, and the initial Cs concentrations were changed in the range of 0.1 to 3.0 mg/mL. All adsorption experiments were repeated at least three times, all Cs amounts were determined using a spectrophotometer at 280 nm, and the averages of the data obtained were used. The adsorption amounts were calculated according the following equation:
Where Q is the amount of Cs adsorbed onto the CsMIP/NIP columns (mg/g); Ci and Cf are the initial and the final Cs concentrations of the aqueous solutions (mg/mL), respectively; V is the volume of aqueous Cs solution (mL), m is the dried mass of the CsMIP/NIP column (g).
Desorption studies
Desorption studies were performed by recirculating 15 mL of acetate buffer (pH 4, 100 mM) through the columns for 2 h at room temperature. The amounts of Cs in the initial and the final solutions were measured spectrophotometrically at 280 nm, and evaluated according to the following equation:
Selectivity and FPLC studies
The selectivity studies of CsMIP and NIP columns were performed using the binary aqueous solutions of Cs and Hp, where Hp was the competitor molecule. Solutions of 2.0 mg/mL of Cs and 2 mg/mL of Hp were prepared, and then 5.0 mL of each of these compound solutions was applied to the CsMIP and NIP columns separately. Once the equilibrium adsorption was achieved, the composition of the initial and final solutions was analyzed using the UV-Vis spectrophotometer. The selectivity constants were calculated according to these results (CitationDai et al. 1999).
The distribution coefficients (Kd, mL/g) of Cs with respect to Hp were calculated from the initial and final concentrations of compounds (mg/mL), volume of the solution (V) and dry weight of cryogel (Wdry), according to following equation:
The selectivity coefficient (k) for the adsorption of Cs with respect to competitor (HP) was determined by the following equation:
The relative selectivity coefficient (k′) describes the effect of imprinting on Cs selectivity, by comparing the selectivity coefficients of the CsMIP (kCsMip) and NIP (kNip) columns, and is calculated from the following equation:
Although the selectivity studies were performed using Cs and Hp solutions separately, it is very important to separate the Cs from the Cs/Hp binary solution using the CsMIP column, to show the selective adsorption of Cs by the CsMIP column. To achieve this purpose, the separation studies were performed using the FPLC system. The FPLC (AKTA-FPLC, Amersham Bioscience, Uppsala, Sweden) system was equipped with the CsMIP and NIP columns. It has a UV detector, M-925 mixer, P-920 pump, UPC-900 monitor and INV-907 injection valve. Separation was performed by appending the CsMIP and NIP columns into the GE Healthcare column (10/10, 19-001-01) of the FPLC system. The standard solutions of Cs and Hp were applied to the CsMIP and NIP columns first, and once the retention times were obtained separately, the separation of Hp and Cs was performed using the solutions including both Hp and Cs. All measurements were performed at 280 nm. Phosphate buffer at pH 7.4 was used as the mobile phase A and acetate buffer at pH 4 containing 1 M NaCl solution was used as the mobile phase B, and filtered before use. The chromatographic separation was performed using a linear gradient method. All the FPLC studies were performed at a flow rate of 4.0 mL/min. The starting period was applied by passing mobile phase A for 7 min; the linear gradient was started by applying mobile phase B for 10 min (mobile phase B was reached from 0% to 100% in 1 min), continued for 10 min, and equilibrated by mobile phase A 100% in the last 3 min. The separation was performed at room temperature. Void volume was determined using KBr solution. All retention times reported in this study are the average of three measurements of the CsMIP and NIP columns.
Capacity factors (k’) for both CsMIP and NIP columns were calculated using the following equation:
Where tR is the retention time of compounds and t0 is the retention time of non-retained compounds corresponding to void volume of the column. The separation factor (〈) is the ratio of the capacity factor of Cs (k’Cs) to the capacity factor of the competing Hp compound, and can be expressed as follows:
The theoretical plate number (N) gives valuable information on the efficiency of the CsMIP and NIP columns, and it was calculated as follows:
Here, N is the theoretical plate number, tR is the retention time, W0.5 is the peak width at half height (in units of time).
The Rs value, which describes the resolution between two peaks in the chromatogram, was calculated using the Purnell equation, as follows:
Here, N2 is the plate number of the second peak; α is the separation factor between the two peaks and Cf2 is the capacity factor of the second peak.
Results and discussions
Characterization studies
Cryogels have spongy structures with their interconnected macropores that have excellent swelling property. According to water sorption studies, the CsMIP cryogels have a swelling ratio of 93%, and this value was calculated as 90% for the NIP cryogels. The specific surface area was determined using the multipoint BET apparatus, and determined as 38 m2/g for CsMIP and 35 m2/g for NIP cryogels. The high surface areas increase the binding capacity of an adsorbent by increasing the interaction points on the adsorbent's surface. The surface morphology of the CsMIP and NIP cryogels were exemplified using SEM photos (). The interconnected macropores and the thin polymeric walls can be seen easily in the SEM images. The macropores have a diameter of about 100 μm.
Figure 1. SEM images of A) CsMIP, B) NIP cryogel.
The FTIR studies were performed to estimate the interactions between molecules in the pre-complex, and to investigate the structures of the synthesized polymers. represents the FTIR spectra of VIM and VIM-Cu–Cs complex. The OH peak at 3345 cm− 1 in the VIM–Cu–Cs complex originated from the Cs molecules in the pre-complex. In the VIM spectrum, the amide band observed at 1639 cm− 1, C–C at 1511 cm− 1, and the C–N ring stretching peak at 1421 cm− 1,, were shifted to higher frequencies in the VIM–Cu–Cs spectrum, at 1650, 1518, and 1448 cm− 1 respectively, due to the complexation with Cu and Cs. The peaks belonging to VIM at finger print points (700–800 cm− 1) were broadened in the VIM–Cu–Cs spectrum, due to the presence of C–O–S bands from Cs in the pre-complex.
Figure 2. FTIR spectrum of Cs, VIM and VIM-Cu(II)-Cs precomplex.
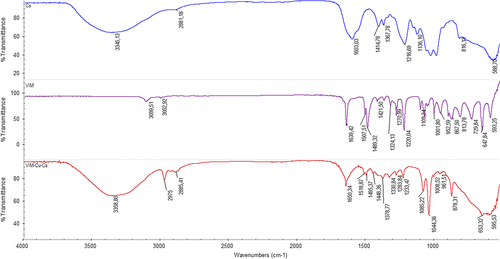
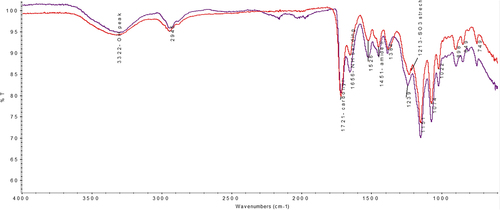
In , in the FTIR spectrum of CsMIP (bottom) and NIP cryogel column (upper), the characteristic NH bending and SO3− stretching vibrations were observed at 1656 and 1213 cm− 1 in the CsMIP cryogel. The strength of the OH peak in the CsMIP spectrum is higher than that of the NIP cryogel, which may be due to the contribution of the OH groups of Cs molecules. All characteristic peaks belonging to PHEMA cryogels can be seen from the spectrums of CsMIP and NIP croyogels; amide I at 1657 cm− 1, amide II at 1433 cm− 1, amide III at 1387 cm− 1, C = O stretching from PHEMA at 1717 cm− 1, C–H asymmetric and symmetric stretching at 2946 and 2878 cm− 1.
Figure 3. FTIR spectrum of CsMIP and NIP columns.
Template removal studies
Cs was removed from the CsMIP cryogel using 100 mM acetate buffer of pH 4 to obtain Cs-selective cavities. After elution and washing cycles, the Cs amount was determined at 280 nm (UV spectrophotometer), and the removal amount was determined as 77%.
Adsorption studies
Adsorption studies were performed for both CsMIP and NIP cryogel columns. The Cs amounts adsorbed were investigated using aqueous solutions of Cs in different concentrations (0.1, 0.2, 0.3, 0.5, 1.0, 1.5, 2.0, and 3.0 mg/mL). The maximum adsorption amount was observed at the point corresponding to 2.0 mg/mL of initial concentration of Cs as 3.38 mg/g dry CsMIP (). Once the maximum Cs adsorption was achieved, the adsorption capacity remained the same for higher initial Cs concentrations, because all the Cs-imprinted cavities were occupied by Cs molecules, and a plateau was obtained after this point in graph. The control experiments were performed using NIPs, and the maximum Cs adsorption amount was obtained as 0.42 mg/mL. As mentioned previously, the NIP column has Vim-Cu functional groups, and Cs was nonspecifically adsorbed by these functional groups. The Langmuir and Freundlich adsorption isotherms were calculated to understand the behavior of Cs adsorption onto CsMIP columns (). The Langmuir isotherm defines the monolayer adsorption of analyte onto a surface, and it can be expressed as follows:
Figure 4. Effect of equilibrium concentration of Cs on the Cs adsorption amount, and the Langmuir and Freundlich adsorption isotherms. V: 5 mL, Mdry: 0.263 g.
Where Qmax is the maximum Langmuir adsorption capacity (mg/g), and b is the Langmuir constant, which is the measure of the monolayer adsorption. Ceq is the equilibrium concentration of Cs (mg/g) (CitationLabrou and Clonis 1995). The Freundlich isotherm is used to describe heterogeneous adsorption behavior, it can be expressed as follows:
Where Qf is the maximum Freundlich adsorption capacity (mg/g), Ce is the equilibrium Cs concentration (mg/mL), and n is the Freundlich constant, which is the measure of the heterogeneity of the system (CitationFinette et al. 1997). The effect of equilibrium Cs concentration on the amount of Cs adsorption, using the Langmuir and Freundlich adsorption isotherms, are summarized in and . As can be seen from , the correlation coefficient of the Langmuir adsorption isotherm (0.97) is higher than the Freundlich isotherm (0.91), and the maximum adsorption capacity seen in the experiments was closer to the Langmuir adsorption isotherm. In homogeneous systems, the Freundlich constant, n, approaches zero; n was calculated as 0.64, and it is another evidence of the monolayer adsorption tendency of the system (CitationUmpleby et al. 2001). According to experimental data and calculations, it can be concluded that the Langmuir adsorption isotherm is well-fitted with the Cs adsorption system, rather than the of Freundlich adsorption isotherm.
Table I. Langmuir and Freundlich adsorption isotherm constants and correlation coefficients for Cs.
Desorption and reusability studies
Desorption studies were performed by recirculating 15 mL of acetate buffer (pH 4, 100 mM) through the columns for 2 h at room temperature. The amounts of Cs in the initial and the final solutions were measured spectrophotometrically at 280 nm, and the ratio of desorption was obtained as 87.0%. The reusability experiments were performed using the same CsMIP column, and after 10 adsorption-desorption cycles, the loss in adsorption capacity was measured as only 5.4% (). The CsMIP column can be used several times, which makes the production of CsMIP columns for Cs recognition cost effective.
Figure 5. Reusability of the CsMIP cryogel column. Cycle number 10, V: 5 mL, Cs: 0.2 mg/mL, Mdry: 0.263 g.
FPLC and selectivity studies
Selectivity is the most important parameter to express the molecular recognition ability of the synthesized polymer. Selectivity studies were carried out for the continuous system using four different competing compounds, using PBS at pH 7.4. This study was performed by applying the compounds in PBS solution separately. The equilibrium concentrations of the solutions were measured separately using the UV-spectrophotometer at 280 nm (). The distribution coefficient (kd) of Cs was calculated, and found to be higher than that of Hp, for both the CsMIP and NIP columns. The important point is that the kd values of CsMIP are greater than those of the NIP column. The selectivity of the CsMIP column can be compared with that of the NIP column using the relative selectivity coefficient. The selectivity coefficients give valuable information on selective adsorption of Hp with respect to the Cs molecule. The selectivity coefficient (k) of the CsMIP column was calculated as 1.81 mL/mg for CsMIP, which shows that the CsMIP column can adsorb Cs 1.81 fold higher than its competitor Hp, due to the shape and structure memory of the cavities in the CsMIP column. The relative selectivity coefficient k’ allows the comparison of the selectivity of the CsMIP column with respect to the NIP column. When the relative selectivity coefficient is greater than unity, the selective adsorption of the MIP is proven (CitationBaydemir et al. 2014). According to , k’ was calculated as 2.03, and it is an important evidence to prove the selectivity of the CsMIP column with respect to the NIP column.
Figure 6. Amount of compounds adsorbed onto the CsMIP and NIP columns. Ceq: 2 mg/mL, V: 5 mL, t: 120 min, Mdry: 0.63 g.
Table II. Selectivity constant values (k, Kd, k’) of Cs.
The selective separation of Cs from the binary aqueous Cs/Hp solution was studied using the FPLC system. The Cs peak was observed at 10.45 min, while the Hp peak was observed at 2.63 min (). The tr, N, k’ and Rs values were calculated for this chromatogram and have been reported in . The resolution of peaks (Rs) in a chromatogram gives valuable information on the separation of the compounds, and if separation occurs, the Rs value should be higher than unity. As shown in , the Rs value was calculated as 14.7, which is accepted as a good resolution (separation) value. The theoretical plate number (N), that defines the chromatographic efficiency of the columns, was calculated for both the CsMIP and NIP columns. As can be seen from the , N value obtained was higher for the CsMIP column (6744) than for the NIP column (447). As the results obviously show, the CsMIP column can significantly separate Cs from the competing Hp molecule.
Figure 7. Fast protein liquid chromatography (FPLC) system separation of Cs from aqueous Cs-Hp solution.
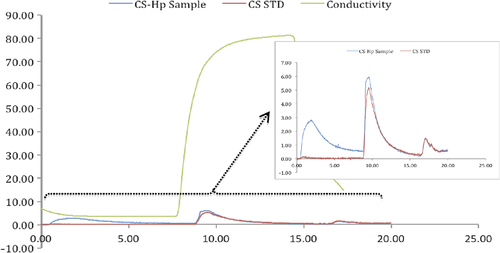
Table III. Chromatographic separation data of the FPLC study.
Conclusions
In recent years, the direct analysis of GAG samples has been the focus of great attention due to the side effects of the GAG-based drugs which are widely used. To date, there have been a lot of studies reported in literature related to the detection of Cs in drugs (CitationBendazzoli et al. 2010). However, to the best of our knowledge, this is the first time that the molecular imprinting technique for Cs detection is being reported, through the current study. The newly synthesized PHEMA-based cryogel column was used for the separation of Cs from Hp in aqueous solution, in the presence of specific Cs cavities, which were constructed by Vim-Cu2+ functional groups. All the selectivity and FPLC studies showed that the Cs successfully separated from the competing Hp molecules, and it can be concluded that the suggested method can be used alternatively and can be developed to detect Cs molecules in order to investigate the impurities in GAG drugs, and may be developed for the other GAG species as well.
Declaration of interest
The authors report no declarations of interest. The authors alone are responsible for the content and writing of the paper.
References
- Andaç M, Denizli A. 2014. Affinity-recognition-bades polymeric cryogels for protein depletion studies. RCS Adv. 4:31130–31141.
- Baydemir G, Andaç M, Bereli N, Say R, Denizli A. 2007. Selective removal of Bilirubin with bilirubin-imprinted particles. Ind Eng Chem Res. 46:2843–2852.
- Baydemir G, Andaç M, Perçin I, Derazshamshir A, Denizli A 2014. Molecularly Imprinted composite cryogels for hemoglobin depletion from human blood. J Mol Recognit. 27:528–536.
- Baydemir G, Denizli A. 2014. Heparin removal from human plasma using molecular imprinted cryogels Artif Cells Nanomed Biotechnol. doi:https://doi.org/10.3109/21691401.2014.897631.
- Bendazzoli C, Liverani L, Spelta F, Prandi M, Fiori J, Gotti R. 2010. Determination of dermatan sulfate and chondroitin sulfate as related substances in heparin by capillary electrophoresis. J Pharm Biomed Anal. 53:1193–1200.
- Bitter T, Muir HM. 1962. A modified uronic acid carbazole reaction Anal Biochem. 4:330–334.
- Capila I, Linhardt RJ. 2002. The structure of glycosaminoglycans and their interactions with proteins. Angew Chem Int Ed Engl. 41:391–412.
- Choi DW, Kim MJ, Kim HS, Chang SH, Jung GS, Shin KY, Chang SY. 2003. A size-exclusion HPLC method for the determination of sodium chondroitin sulfate in pharmaceutical preparations J. Pharm. Biomed. Anal. 31:1229–1236
- Chong BH 2003. Heparin-Induced thrombocytopenia J Thromb Haemost. 1:1471–1478.
- Dai S, Burleig MC, Shin Y, Morrow CC, Barnes CE. 1999. Imprint coating: a novel synthesis of selective functionalized ordered mesoporous sorbents. Angew Chem Int Ed Engl. 38:1235–1239.
- Derazshamshir A, Baydemir G, Andaç M, Say R, Galaev IY, Denizli A 2010. Molecularly imprinted PHEMA based cryogels for depletion of hemoglobin. Macromol Chem Phys. 221:657–668.
- Ergün B, Baydemir G, Andaç M, Yavuz H, Denizli A. 2012. Ion imprinted cryogels for in vitro removal of iron from beta-thalassemic human plasma. J Appl Polym Sci. 125:254–262.
- Esko JD, Selleck SB. 2002. Order out of chaos: assembly of ligand binding sites in heparan sulphate Annu Rev Biochem 71, 435–471.
- Finette GM, Qui-Ming M, Hearn MT 1997. Comparative studies on the isothermal characteristics of proteins adsorbed under batch equilibrium conditions to ion-exchange, immobilised metal ion affinity and dye affinity matrices with different ionic strength and temperature conditions J Chromatogr A. 763:71–90.
- Gallagher JT, Turnbull JE. 1992. Heparan sulphate in the binding and activation of basic fibroblast growth factor. Glycobiology 2: 523–528.
- Jang IK, Hursting MJ 2005. When heparins promote thrombosis: review of heparin-induced thrombocytopenia Circulation 111: 2671–2683.
- Labrou NE, Clonis YD. 1995The interaction of Candida boidinii formate dehydrogenase with a new family of chimeric biomimetic dye-ligands Arch Biochem Biophys 316:169–178.
- Liang Z, Bonneville C, Senez T, Henderson T 2002. Development and validation of a photometric titration method for the quantitation of sodium chondroitin sulfate (bovine) in Cosequin DS chewable tablet J Pharm Biomed Anal. 28:245–249.
- Lozinsky VI, Galaev IY, Plieva FM, Savina IN, Jungvid H, Mattiasson B. 2003. Polymeric cryogels as promising materials of biotechnological interest. Trends Biotechnol. 21:445–451.
- Malavaki JC, Asimakopoulou AP, Lamari FP, Theocharis AD, Tzanakakis GN, Karamanos NK. 2008Capillary electrophoresis for the quality control of chondroitin. Anal Biochem. 374:213–220.
- Murugesan S, Xie J, Linhardt RJ, 2008. Immobilization of heparin: approaches and applications Curr Top Med Chem 8:80–100.
- Perçin I, Baydemir G, Ergün B, Denizli A 2013. Macroporous PHEMA-based cryogel discs for bilirubin removal. Artif Cells Nanomed Biotechnol. 41:172–177.
- Rabenstein DL. 2002. Heparin and heparin sulphate: structure and function Nat Prod Rep 19:312–331.
- Rostand KS, Esko JD. 1997. Microbial adherence to and invasion through proteoglycans. Infect Immun. 65:1–8.
- Spillmann D, Lindahl U 1994. Glycosaminoglycan-protein interactions. A question of specificity sulfates in raw materials and formulations . Curr Opin Struct Biol. 4:677–682.
- Takeuchi T, Fukuma D, Matsui J. 1999. Combinatorial molecular imprinting: an approach to synthetic polymer receptors. Anal Chem. 71:285–290.
- Toido T, Linhardt RJ 1996Detection of glycosaminoglycans as a copper (II) complex in capillary electrophoresis Electrophoresis 17: 341–346.
- Trowbridge JM, Gallo RL. 2002. Dermatan sulphate: new functions from an old glycosaminoglycan. Glycobiology 12:117–125.
- Tyler T, Khandelwal B, Norden D, Rolle FR. 2002. Determination of chondroitin sulfate in raw materials by liquid chromatography J. AOAC Int. 85:567–571.
- Umpleby RJ, Baxter SC, Chen Y, Shah RN, Shimizu KD 2001. Characterization of MIPs using heterogeneous binding models. Anal Chem 73:4584–4591.