
 ?Mathematical formulae have been encoded as MathML and are displayed in this HTML version using MathJax in order to improve their display. Uncheck the box to turn MathJax off. This feature requires Javascript. Click on a formula to zoom.
Abstract
Cyanide is one of the most widespread of compounds measured in environmental analysis due to their toxic effects on environment and health. We report a highly sensitive, reliable, selective amperometric sensor for determination of cyanide, using a polyaniline conductive polymer. The enzyme catalase was immobilized by electropolymerization. The steps during the immobilization were controlled by electrochemical impedance spectroscopy. Optimum pH, temperature, aniline concentration, enzyme concentration, and the number of scans obtained during electropolymerization, were investigated. In addition, the cyanide present in artificial waste water samples was determined. In the characterization studies of the biosensor, some parameters such as reproducibility and storage stability, were analyzed.
Introduction
Catalase (E.C. 1.11.1.6) (CAT) is present in almost all aerobic living organisms. CAT is a heme enzyme with a ferritoprotoporphyrin IX at its redox center, which belongs to the oxidoreductase family class (CitationNicholls et al. 1963). It catalyzes the disproportionation of H2O2, to produce oxygen and water. This reaction is mainly catalyzed by CAT present in the red blood cells of mammals. CAT serves to protect cells from the toxic effects of H2O2, by catalyzing its decomposition into molecular oxygen and water without the production of free radicals, and is therefore known as an antioxidative enzyme (CitationMurthy et al. 1981, CitationFita and Rossmann 1985, CitationJouve et al. 1991).
CAT from bovine liver is a tetramer consisting of four equal subunits with a molecular weight of 60 kDa each. Each subunit contains iron bound to a protoheme IX group. CATs have a wide range of industrial applications. The enzyme is used in the dairy industry for milk and cheese sterilization, and in textile for the degradation of peroxide used for bleaching, to avoid any problems in next dyeing process (CitationBetancor et al., 2003). It is one of the first enzymes to have been purified and crystallized. In recent years, its importance has gained more attention because of its relation to cancer, diabetes and ageing, both in humans and animals (CitationMelov et al. 2000, CitationPreston et al. 2001).
An important regulatory mechanism of some biological pathways is the interaction between the enzyme and different small molecules present in the enzyme‘s surrounding. Some of them may act as inhibitors, and some of them as activators. CAT activity is inhibited by 2-mercaptoethanol, 3-amino-1-H-1,2,4 triazole, cyanide, hydroxylamine, azide (CitationLoewen and Switala 2002), nitrite, nitrate, and S-nitrosocysteine (CitationTitov et al. 2007).
Cyanide is one of the most remarkable and competitive inhibitors of CAT. Cyanide is a chemical known to be a hazardous and toxic environmental contaminant. It is related to industrial waste from activities like gold mining, metal electroplating, nitrile manufacturing, herbicide production, and plastic industries (CitationBehnamfard and Salarirad 2009, CitationYu et al. 2010, CitationYeddou et al. 2011). Cyanide also pollutes the water in areas which are used for fishing exotic fish (CitationMak et al. 2005). Cyanide is a component of chemical warfare agents (CitationKim et al. 2011). The maximum level for cyanide contamination in drinking water has been set by the United States Environmental Protection Agency at 0.1 ppm. Due to these deleterious effects of cyanide, developing selective, sensitive sensors for its monitoring is exceptionally important.
Approaches to detect cyanide include spectrophotometry (CitationGeetha and Balasubramanian 2001, CitationDeep et al. 2003), titrimetry (CitationPohlandt et al. 1983, CitationSun et al. 2012), the use of optical sensors (CitationJawad and Alder 1991), ion-selective electrodes (CitationClysters and Adams 1976), chromatographic (CitationChristison and Rohrer 2007), fluorimetry (CitationLee et al. 2008) and flow injection (CitationSurleva et al. 2007), electrochemical (CitationLindsay and O’Hare 2006) and luminescent analyses techniques (CitationVarela et al. 2008). All these techniques currently exist for cyanide detection. However, some of them are time-consuming or require expensive equipments or complicated protocols. For the detection of various chemicals and ions, the electrochemical techniques prove to be faster, cheaper, reliable and reproducible, involving cathodic reduction and anodic oxidation of analytes at various solid electrodes (CitationMehta et al. 2012).
In the present work, an amperometric biosensor has been fabricated for the determination of cyanide, based on cyanide's inhibitory effect on the activity of CAT, and the enzyme immobilization on the surface of the electrode was controlled by electrochemical impedance spectroscopy. The studies were based on the measurement of the differences in the responses of the biosensor, both in the absence and in the presence of cyanide. This biosensor includes three electrodes (working, reference and counter electrodes), and an enzyme component (CAT). There are a lot of materials for immobilization of enzyme on the electrode surface. Some of the materials easily crack and fall from the electrode surface, and this leads the loss of enzyme stability. When conducting polymers, such as polypyrrole (PPY), polyaniline (PANI), and polythiophene (PTH) arrived, they began to be used for immobilizing the enzyme to form reliable biosensors (CitationFoulds and Lowe 1986, CitationBartlett and Whitaker 1988).
The biosensor uses the CAT on a cross-linked redox polymer like PANI, which may act as a mediator to decrease interference in the H2O2 signal, or a PANI film, which blocks interference from endogenous reducing agents. PANI is one of the conducting polymers used in optical sensors, chemical sensors, and biosensors, which has optical and electrochemical properties. It shows changes in the electrical and optical properties when chemically treated with oxidizing or reducing agents (CitationVirji et al. 2004). PANI is an attractive material, due to its low cost, environmental stability, and reversible redox activity. Moreover, it is easily processed from solution to create uniform thin films. Its conductivity depends on the ability to transport charge carriers, both along the polymer backbone and between the polymer chains (CitationOh et al. 2004, CitationHarsha et al. 2005, CitationLi and Kaner 2006).
Among the various biosensors, the inhibition-based biosensors are very appealing for use in environmental monitoring, especially for field applications. Some of them have been used successfully to determine the concentration of inhibitors like toxic compounds, pollutants such as insecticides, and heavy metals at lower concentrations (CitationEvtugyn et al. 1998, CitationChen et al. 2008). The advantages of inhibition-based biosensors are the savings in time and cost, reduction in the need for pretreatment of the sample, high selectivity, and sensitivity.
Methods
Chemicals and apparatus
All reagents used were of analytical grade, unless stated otherwise, and were purchased from Sigma-Aldrich (St. Louis, MO, USA). Catalase (CAT) E.C. 1.11.1.6, from bovine liver (≥ 10,000 units/mg protein), was purchased from Sigma-Aldrich (St.Louis, MO, USA). CAT portions were prepared at certain concentrations and were stored at − 20°C until use. The composition of the synthetically concocted waste water was as follows: (NH4)2SO4 (0.5g), MgSO4 (0.1 g), MnSO4 (0.01 g), FeSO4 (0.0005 g), and known amounts of cyanide in tap water (100 mL), at a pH of 7.2 (CitationLivingston 1993).
In this study, the Palmsense potentiostat/galvanostat (the Netherlands), a triple-electrode system containing a platinum working electrode (with a surface area of 2.01 mm2), Ag/AgCl reference electrode, and a platinum wire counter electrode (Basi, W. Lefayette, USA), were used for amperometric detection of cyanide. To prepare the buffer solution, a magnetic stirrer (RCA, UK) and a pH meter with an electrode (Schott Handylab, Spain) were used. All the measurements were carried out at a constant temperature maintained using a thermostat (Nüve BM 302, UK). Electrochemical impedance experiments were performed using a Gamry Interface 1000 potentiostat/galvanostat (Gamry Instruments, Warminster, USA), interfaced with a PC via an EChem Analyst containing software for physical electrochemistry and electrochemical impedance spectroscopy (Gamry Instruments, Warminster, USA). In all electrochemical experiments, a Faraday cage (from iBAS, Warwickshire, UK) was used to block out external static electric fields.
Preparation of the biosensors
Prior to the electrochemical polymerization of aniline, the working surface of the Pt electrode was polished on a microfiber cloth using alumina powder, until a shining surface was obtained. After that, it was thoroughly rinsed with distilled water and then by sonication, first with absolute ethanol for 10 min and finally with distilled water for 5 min, to remove undesirable adsorbed particles. Then, it was electrochemically cleaned by cycling the electrode potential between − 0.4 and + 1V vs Ag/AgCl, at a scan rate of 250 mVs− 1 in 1M HCl, until a constant current–voltage relationship was observed.
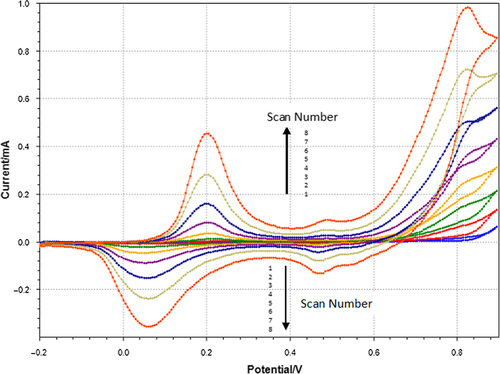
In the electrochemical polymerization step, a layer of polyaniline film was grown on the surface of the Pt electrode by cyclic voltammetry, in a cell containing 0.1M aniline, 0.1M HCl and 0.1M KCl. The electrochemical polymerization of aniline is shown in . The peaks due to the oxidation and reduction of the film increase in intensity as the film grows. Eight cycles were scanned, with a scan rate of 50 mV/s at a potential ranging from − 0.2 V to 0.9 V, until the electrode surface was changed to dark green. This clearly indicated the formation of a conductive polyaniline film on the surface of the Pt electrode. In the next step, the PANI-Pt electrode was washed with distilled water and dried with an ultra-pure argon stream.
Figure 1. Cyclic voltograms of electropolymerization of aniline.
After polymerization, 2.5% glutaraldehyde was first poured onto the surface of the modified PANI/Pt electrode and incubated for 30 min at room temperature, to form a bond between the free NH2 groups of the polyaniline film and the aldehyde groups of the cross-linker.
The treated electrode was then washed with distilled water to remove the loosely-bound glutaraldehyde from the surface, and dried by using the ultra-pure argon stream. For physically adsorbed CAT, the PANI/Pt electrode was immersed in a 1 mL solution containing CAT for 1 h, immediately washed to remove unbound enzyme, and again dried by using an ultra-pure argon stream. Thus, the fabricated biosensor system was used for the experimental measurements and stored at 4°C until further use.
Principle of the measurement
CAT is a very fast biocatalyst that uses hydrogen peroxide as a substrate, forming oxygen and water. The enzyme can also act on alkyl hydrogen peroxides, and several organic substances can replace the second hydrogen peroxide molecule as the hydrogen donor (ethanol, thiol, etc.). Cyanide is one of the competitive inhibitors of CAT, and was added to inhibit the enzyme activity.
The determination of hydrogen peroxide is based on the measurement of the oxygen produced during the enzymatic reaction according to the accepted mechanism (CitationLópez et al. 2006):
Amperometric measurements were performed with the Palmsense Electrochemical Analyzer, with a three electrode system – a modified Pt electrode as the working electrode, a platinum wire as the counter electrode, and an Ag/AgCl (3.0 M KCl) electrode as the reference electrode. Measurements were done in an electrochemical thermostatic cell, with stirring at 30°C. A series of H2O2 solutions were diluted from the stock solution, with different concentrations. All solutions were prepared with a phosphate buffer (0.1 M, pH 7); other chemicals were of analytical grade and used without further purification.
The measurements were carried out in 15 mL of 0.1 M phosphate buffer solution. A solution with a known concentration of H2O2 was added as substrate, and the steady state current was recorded and noted as I0. Standard working solutions of cyanide were prepared daily from potassium cyanide (KCN) in phosphate buffer (0.1 M, pH 7). Finally, each cyanide concentration was added to inhibit the enzyme activity, and the decreasing values of current were noted as I1. This current is proportional to the final concentration of inhibitor in the solution. The inhibition percentage (I %) due to selected levels of cyanide was calculated using the following equation (CitationNwosu et al. 1992):
Impedance measurements
Electrochemical impedance spectra provide an effective method to analyze the interface properties of surface-modified electrodes. The impedance measurements of electrodes were carried out at the open circuit potential in a phosphate buffer (pH 7.0) containing 5 mM K3[Fe(CN)6]/K4[Fe(CN)6] over a frequency range of 1 × 10− 2 to 1 × 10⁵ Hz. It can be seen that curve (a) in has a small semicircle, implying very low electron-transfer resistance (Rct). The lowest Rct (curve (a)) indicates the fastest electron-transfer rate between the Pt electrode and the PANI film. According to the impedance spectra, the Rct values were calculated for the PANI electrode, the PANI- Glutaraldehyde (PANI-GLT) electrode, and the PANI-Glutaraldehyde-Catalase (PANI-GLT-CAT) electrode, and were 0.245, 1.031 and 2.049 kohm, respectively. The PANI-GLT-CAT electrode shows a higher Rct value, which may be ascribed to the bond of non- conductive glutaraldehyde on the polyaniline surface. After enzyme immobilization, an obvious increase in the interfacial resistance is observed (curve (c)). This result is very similar to that of the polyaniline–uricase biosensor (CitationArora et al. 2007). The increase in the Rct might be attributed to the non-conductive properties of PPO, which hinders electron transfer of the electrochemical probe. It confirms successful immobilization of the enzyme on PANI.
Figure 2. Impedance spectra of the immobilization steps [a) -▲-▲-(blue): PANI electrode, b) -•-•-(green): PANI–GLT electrode, -■-■-(red): PANI–GLT–CAT electrode].
![Figure 2. Impedance spectra of the immobilization steps [a) -▲-▲-(blue): PANI electrode, b) -•-•-(green): PANI–GLT electrode, -■-■-(red): PANI–GLT–CAT electrode].](/cms/asset/4030ad33-6f8e-42ce-aabf-da6f23857dfb/ianb_a_978979_f0002_oc.jpg)
Results and discussion
Optimization of construction of the biosensor
Effect of the amount of aniline on the biosensor response
To determine the effect of the amount of aniline on the response of the biosensor, different amounts of aniline were used. Standard cyanide solutions of concentrations ranging from 0.25–7.5 mM were separately analyzed by biosensors prepared with different concentrations of aniline (0.1, 0.2 and 0.4 mM). Polymerization of aniline in an acidic solution yields conductive polyaniline. The conductivity of polyaniline decreases with an increase in the pH of the solution (CitationGarjonyte and Malinauskas 2000). The results are given in . According to the linear response of biosensors, the optimal biosensor responses were achieved by the biosensor which contained aniline at a concentration of 0.2M. When we used 0.4M aniline, responses were very low, because the increase in aniline leads to thicker diffusion barriers in between the surface of the electrode and the bioactive layer. A thicker diffusion barrier hinders the effective working of the enzyme as well as the diffusion of substrate and inhibitor from the bioactive layer to interval surface. An aniline concentration of 0.1M showed a swerve on the curve along with a decrease in the response of the biosensor. The most important reason for this effect was the escape of enzyme from the surface of the electrode, due to insufficient tightness of the electropolymerization.
Figure 3. The effect of aniline concentration on the biosensor response.
The effect of the percentage of glutaraldehyde on the biosensor response
In the study to determine the effect of the percentage of glutaraldehyde on the biosensor response, biosensors were prepared with 0.5%, 1%, and 2.5% glutaraldehyde solutions for cross-linking. The results are given in . The values of R2 were calculated as 0.9071, 0.9003 and 0.9925, respectively.
Figure 4. The effect of GLT concentration on the biosensor response.
Due to the linear response profile of the biosensor, a concentration of 2.5% glutaraldehyde was chosen as the optimum value. At this concentration, the responses of the biosensor are higher than those obtained using 0.5% and 1.0% glutaraldehyde. Lower concentrations of glutaraldehyde were not sufficient to allow adequate cross-linking. Therefore, the most useful and best responses were obtained by using the biosensor prepared using 2.5% glutaraldehyde.
Effect of the incubation time of glutaraldehyde on the biosensor response
To study the effect of incubation period of glutaraldehyde on the biosensor response, the amount of CAT, the percentage of glutaraldehyde, and concentration of aniline were kept constant at 1mg/mL, 2.5%, and 0.2M, respectively, and the incubation period of GLT immobilization was changed 30, 60 and 90 min. The results can be seen in . R2 values were calculated as 0.9902, 0.9018 and 0.9400, respectively. According to the linearity of the response, the incubation period of 30 min was chosen as the optimum incubation period for GLT immobilization.
Figure 5. The effect of GLT incubation period on the biosensor response.
Effect of the amount of enzyme on the biosensor response
Different amounts of CAT were studied to determine the effect of the amount of enzyme on the biosensor response. Three different biosensors were prepared with CAT concentrations of 0.5, 1, and 2 mg/mL, using GLT (2.5%) and aniline (0.2 M). The results are shown in .
Figure 6. The effect of enzyme amount on the biosensor response.
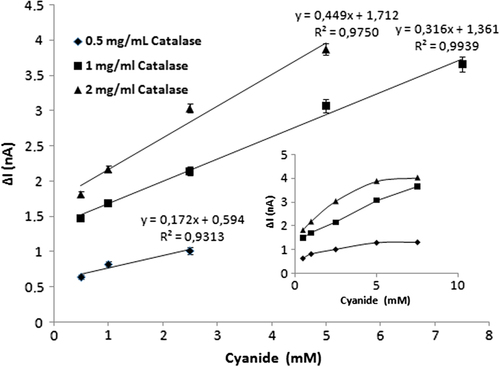
The results indicate that the best responses and linear range were obtained by the biosensor prepared with a CAT concentration of 1mg/mL. A narrow linear response region was observed with the biosensor which contained CAT amounting to 0.5mg/mL. On the other hand, when an enzyme concentration of 2mg/mL was used in biosensor construction, some deformations and diffusion barriers occurred on the surface layer. According to the response profile of the biosensor, the CAT amount of 1mg/mL was chosen as the optimum amount of enzyme for construction of the biosensor.
Effect of the number of electropolymerization scans on the biosensor response
To determine the effect of the number of electropolymerization scans on the biosensor response, the amount of CAT, the percentage of glutaraldehyde, and the concentration of aniline were kept constant at 1mg/mL, 2.5%, and 0.2M, respectively, and the number of scans was changed to 6, 8, and 10. It can be seen in that the highest biosensor response and best linearity were obtained at 8 scans. Therefore the optimum number of scans was chosen as 8.
Figure 7. The effect of the number of scans on the biosensor response.
Optimization of experimental conditions
Effect of temperature on the biosensor response
The electrocatalytic activity of enzymes or proteins is strongly affected by temperature. In this part of the optimization studies, measurements of the prepared biosensor were carried out in media of different temperatures (20°C, 25°C, 30°C, 35°C, 40°C). The determination of the effect of temperature on the biosensor response is very important, due to the nature of the biocomponents, and also to obtain the best biosensor responses. The results obtained from the experiments are shown in . It can be said that the highest biosensor responses were obtained at a temperature of 30°C.
Figure 8. Effect of temperature on the biosensor response.
Effect of pH on the biosensor response
Another parameter affecting the amperometric response of the biosensor is the pH of the solution. The experiments were carried out in different buffer systems to determine the effect of pH value on the biosensor response. For this purpose, 100mM concentrations of phosphate (pH 6.0, 6.5, 7.0, 7.5, 8.0) buffers were prepared and used. The results obtained from these experiments are shown in . According to the findings, the optimum pH value was determined as 7.0. Apparently, the response current increases as the pH changes from 6.0 to 7.0. At the pH range from 7.0 to 8.0, the response current decreases as the pH value increases. However, the change in the response current of the PANI biosensor may not be ascribed to the decrease of conductivity of the PANI with increasing pH, because the PANI synthesized in an acidic solution containing HCl has good electroactivity and high conductivity at high pH (CitationSingh et al. 2009).
Figure 9. Effect of pH on the biosensor response.
Analytical characteristics of the biosensor
Linear range of the biosensor
After optimization of the biosensor, experiments were carried out to achieve a calibration curve for cyanide at optimal conditions. From the results obtained, it can be said that the biosensor responses correlated linearly at a concentration of potassium cyanide ranging between 16.3 × 10− 3–0.65 mg/L. From the experiments, a linear regression equation and R2 value were obtained as y = 4.956x + 1.162 and 0.9978, respectively. The calibration curve and comparison of some methods reported for cyanide detection are given in and .
Figure 10. Calibration curve of the biosensor.
Table I. Comparison of the methods developed and some of the reported methods for the cyanide determination.
Reproducibility
The reproducibility of the biosensor was tested by 12 average standard solutions containing equal amounts of cyanide (0.32 mg/L). The standard deviation (SD), variation coefficient (CV), and average value (X) were calculated as ± 0.0077 mg/L, 2.43% (n = 12), and 0,3179 mg/L respectively.
Storage stability
The new PANI biosensor was stored at − 4°C, to observe the storage stability of the biosensor. Measurements were carried out in the presence of cyanide and 5mM H2O2 on every third day, for a period of 15 days. The results are shown in . Although 9 days passed, there was only a 24.5% loss in the activity. After 15 days, there was a 35% loss in the activity and also in the responses of the biosensor to cyanide.
Figure 11. Storage stability of the biosensor.
Interference studies
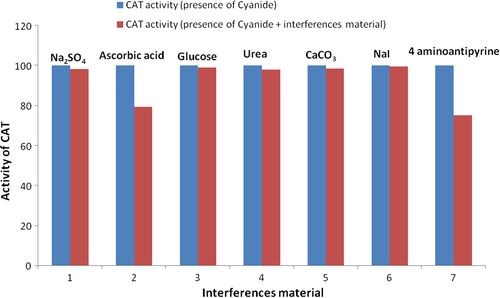
In order to determine the effect of different compounds on the biosensor response, some experiments were carried out using various substances such as Na2SO4, ascorbic acid, glycose, urea, CaCO3, NaCl, KCI and 4-aminoantipyrine, at concentrations of 5 mM, in the presence of 5 mM hydrogen peroxide. Average activities were calculated from five measurements for each of the compounds.
surveys the observations obtained by studying selected ions and salts as species that could interfere with the biosensor. As expected, ascorbate and 4-aminoantipyrine caused an interference effect. This result agreed with the data in the literature, because ascorbate and 4-aminoantipyrine had an inhibitory effect on CAT (CitationAkyılmaz and Kozgus 2009). Besides these, the other substances such as glucose and urea which were tested, caused no or negligible interference effect, as seen in .
Figure 12. Effect of interference materials on biosensor response.
Application in artificial waste water
In addition, the biosensor was applied to the artificial waste water samples spiked with cyanide. The results from 5 different measurements which were averaged can also be seen in . The results presented here show that cyanide levels in the artificial waste water samples analyzed by the present biosensor agreed with that of the artificial waste water samples with the spiked amounts.
Table II. Results of analysis of artificial waste water samples (*Average values of 5 measurements).
Conclusions
In this paper, a new inhibition-based biosensor for cyanide detection has been described. The biosensor was prepared by using CAT/PANI film-modified Pt electrode which can be used for the immobilization of CAT. This proposed new biosensor is economical due to the low cost, high sensitivity, good selectivity, simple and fast fabrication of the sensor.
We described immobilization steps by using electrochemical impedance spectroscopy for inhibition-based biosensors for the first time in literature. Also, some parameters such as optimum temperature, pH, and the effect of the number of electropolymerization scans, the amount of aniline, amount of enzyme, and the effect of the incubation time of glutaraldehyde, were investigated in the optimization studies of the biosensor. We found that the best conditions were determinated to be as follows: temperature: 30°C, phosphate buffer: pH 7.0, 100 mM, scan number: 8, aniline: 0.2 M, CAT: 1mg/mL and incubation period: 30 min.
Thus, this work, based on the inhibition of cyanide, has good analytical properties such as fast response time (6 min), long-time stability, and a good detection range, and it is suitable for routine analysis of H2O2 and cyanide at the same time.
Declaration of interest
The authors report no declarations of interest. The authors alone are responsible for the content and writing of the paper.
References
- Akyılmaz E, Kozgus O. 2009. Determination of calcium in milk and water samples by using catalase enzyme electrode. Food Chem. 115:347–351.
- Arora K, Sumana G, Saxena V, Gupta RK, Gupta SK, Yakhmi JV, et al. 2007. Improved performance of polyaniline-uricase biosensor. Anal Chim Acta. 594:17–23.
- Bartlett PN, Whitaker RG. 1987/1988. Strategies for the development of amperometric enzyme electrodes. Biosensors. 3:359–379.
- Behnamfard A, Salarirad MM. 2009. Equilibriumand kinetic studies on free cyanide adsorption from aqueous solution by activated carbon. J Hazard Mater. 170:127–133.
- Betancor L, Hidalgo A, Fernández-Lorente G, Mateo C, Fernández-Lafuente R, Guisan JM. 2003. Preparation of a stable biocatalyst of bovine liver catalase using immobilization and postimmobilization techniques. Biotechnol Prog. 19:763–767.
- Chen H, Mousty C, Chen L, Cosnier S. 2008. A new approach for nitrite determination based on a HRP = catalase biosensor. Mater Sci Eng C. 28:726–730.
- Christison TT, Rohrer JS. 2007. Direct determination of free cyanide in drinking water by ion chromatography with pulsed amperometric detection. J Chromatogr A. 1155:31–39.
- Clysters H, Adams F. 1976. Potentiometric determination with the silver sulfide membrane electrode. Part I Determination of cyanide. Anal Chim Acta. 83:27–58.
- Deep B, Balasubramanian N, Nagaraja KS. 2003. Spectrophotometric determination of cyanide based on Berthelot reaction. Anal Lett. 36:2865–2874.
- Evtugyn GA, Budnikov HC, Nikolskaya EB. 1998. Sensitivity and selectivity of electrochemical enzyme sensors for inhibitor determination. Talanta. 46:465–484.
- Fita I, Rossmann MG. 1985. The active center of catalase. J Mol Biol. 185:21–37.
- Foulds NC, Lowe CR. 1986. Enzyme entrapment in electrically conducting polymers. J Chem Soc, Faraday Trans I. 82:1259–1264.
- Garjonyte R, Malinauskas A. 2000. Amperometric glucose biosensors based on Prussian Blue- and polyaniline-glucose oxidase modified electrodes. Biosens Bioelectron. 15:445–451.
- Geetha K, Balasubramanian N. 2001. Determination of cyanide by an indirectspectrophotometric method using formaldehyde and 3-methyl-2-benzothiazolinone hydrazone. Anal Lett. 34: 2507–2519.
- Hamza A, Bashammakh AS, Al-Sibaai AA, Al-saidi HM, El-Shahawi MS. 2010. Dual-wavelength β-correction spectrophotometric determination of trace concentrations of cyanide ions based on the nucleophilic addition of cyanide to imine group of the new reagent 4-hydroxy-3-(2-oxoindolin-3-ylideneamino)-2-thioxo-2H–1,3-thiazin-6(3H)-one. Anal Chim Acta. 657:69–74.
- Harsha SK, Surwade SP, Zhang X, MacDiarmid AG, Manohar SK. 2005. Absolute molecular weight of polyaniline. J Am Chem Soc. 127:16770–16771.
- Infante CMC, Masini JC, Rocha FRP. 2008. A green flow-based procedure for fluorimetric determination of acid-dissociable cyanide in natural waters exploiting multicommutation. Anal Bioanal Chem. 391:2931–2936.
- Jawad SM, Alder JF. 1991. Optical fibre sensor for detection of hydrogen cyanide in air. Part. 2. Theory and design of an automatic detection system. Anal Chim Acta. 246:259–266.
- Jermak S, Pranaityte B, Padarauskas A. 2006. Headspace single-drop microextraction with in-drop derivatization and capillary electrophoretic determination for free cyanide analysis. Electrophoresis. 27:4538–4544.
- Jouve HM, Gouet P, Boudjada N, Buisson G, Kahn R, Duee E. 1991. Crystallization and crystal packing of Proteus mirabilis PR catalase. J Mol Biol. 221:1075–1077.
- Kim K, Tsay OG, Atwood DA, Churchill DG. 2011. Destruction and detection of chemical warfare agents. Chem Rev. 111:5345–5403.
- Lee KS, Kim HJ, Kim GH, Shin I, Hong JI. 2008. Fluorescent chemodosimeter for selective detection of cyanide in water. Org Lett. 10:49–51.
- Li D, Kaner RB. 2006. Shape and aggregation control of nanoparticles: not shaken, not stirred. J Am Chem Soc. 128:968–975.
- Lindsay AE, O’Hare D. 2006. The development of an electrochemical sensor for the determination of cyanide in physiological solutions. Anal Chim Acta. 558:158–163.
- Livingston AG. 1993. A novel membrane reactor for detoxifying industrial waste water: I. Biotechnol Bioeng. 41:915–926.
- Loewen PC, Switala J. 2002. Diversity of properties among catalases. Arch Biochem Biophys. 401:145–115.
- López MSP, Cabarcos EL, Ruiz BL. 2006. Organic phase enzyme electrodes. Biomol Eng. 23:135–147.
- Mak KKW, Yanase H, Renneberg R. 2005. Cyanide fishing and cyanide detection in coral reef fish using chemical tests and biosensors. Biosens Bioelectron. 20:2581–2593.
- Mehta SK, Salaria K, Umar A. 2012. Highly sensitive and selective cyanide ion sensor based on modified ZnS nanoparticles. Electrochim Act. 81:308–312.
- Melov S, Ravenscroft J, Malik S, Gill MS, Walker DW, Clayton PE. 2000. Extension of life-span with superoxide dismutase/catalase mimetics. Science. 289:1567–1569.
- Murthy MRN, Reid TJ, Sicignano A, Tanaka N, Rossmann MG. 1981. Structure of beef liver catalase. J Mol Biol. 152:465–499.
- Nicholls P, Schonbaum GR, Boyer I, Lardy PD, Myrback H. 1963. The Enzymes, Volume 8. Orlando: Academic Press; pp. 158–159.
- Nwosu TN, Palleschi G, Mascini M 1992. Comparative studies of immobilized enzyme electrodes based on the inhibitory effect of nicotine on choline oxidase and acetylcholinesterase Anal Lett. 25:821–835.
- Oh SY, Oh IS, Choi JW. 2004. Patterning of electrically conductive poly (aniline-co-aniline sulfonicacid) and its application in the immobilization. Mater Sci Eng C. 24:307–309.
- Pohlandt C, Jones EA, Lee AF. 1983. A critical evaluation of methods applicable to the determination of cyanides. J S Afr Inst Min Metall. 83:11–19.
- Preston TJ, Muller WJ, Singh G. 2001. Scavenging of extracellular H2O2 by catalase inhibits the proliferation of HER-2/Neu-transformed Rat-1 fibroblasts through the induction of a stress response. J Biol Chem. 276:9558–9564.
- Santelli RE, Micelli AS, Batista de Carvalho MF. 2006. Automated flow injection method for monitoring total cyanide concentration in petroleum refinery effluents using ninhydrin as color reagent. Spectr Lett. 39:605–618.
- Singh RP, Kang DY, Oh BK, Choi JW. 2009. Polyaniline based catalase biosensor for the detection of hydrogen peroxide and azide. Biotechnol Bioproc Eng. 14:443–449.
- Sun Y, Wang Y, Cao D, Chen H, Liu Z, Fang Q. 2012. 3-Amidocoumarins as chemodosimeters to trap cyanide through both Michael and intramolecular cyclization reaction. SensActuators B: Chem. 174:500–505.
- Surleva AR, Nikolova VD, Neshkova MT. 2007. A new generation of cyanide ion-selective membranes for flow injection application: part II. Comparative study of cyanide flow-injection detectors based on thin electroplated silver chalcogenide membranes. Anal Chim Acta. 583:174–181.
- Themelis DG, Karastogianni SC, Tzanavaras PD. 2009. Selective determination of cyanides by gas diffusion-stopped flow-sequential injection analysis and an on-line standard addition approach. Anal Chim Acta. 632:93–100.
- Titov VY, Petrenko YM, Vanin AF. 2007. Mechanism of inhibition of catalase by nitro and nitroso compounds. Biokhimiya. 73–1:113–118.
- Varela T, Stevenson EI, Galve-Gasion JA, Dryden DTF, Mareque-Rivas JC. 2008. Selective turn-on fluorescence detection of cyanide in water using hydrophobic CdSe quantum dots. Chem Commun. 17:1998–2000.
- Virji S, Huang J, Kaner RB, Weiller BH. 2004. Polyaniline nanofiber gas sensors: examinationof response mechanisms. Nano Lett. 4: 491–496.
- Yeddou AR, Chergui S, Chergui A, Halet F, Hamza A, Nadjemi B, et al. 2011. Removal of cyanide in aqueous solution by oxidation with hydrogen peroxide in presence of copper-impregnated activated carbon. MinerEng. 24:788–793.
- Yu H, Zhao Q, Jiang Z, Qin J, Li Z. 2010. Aratiometric fluorescent probe for cyanide: convenient synthesis and the proposed mechanism. Sens Actuators B Chem. 148:110–116.