
Abstract
In this paper, we demonstrate a simple, sensitive, inexpensive, disposable and label-free electrochemical nucleic acid biosensor for the detection of the hepatitis C virus genotype 1a (HCV1a). The nucleic acid biosensor was designed with the amino-linked inosine-substituted 20-mer probes, which were immobilized onto a disposable pencil graphite electrode (PGE) by covalent linking. The proposed nucleic acid biosensor was linear in the range of 0.05 and 0.75 μM, exhibiting a limit of detection of 54.9 nM. The single-stranded synthetic PCR product analogs of HCV1a were also detected with satisfactory results under optimal conditions, showing the potential application of this biosensor.
Introduction
The hepatitis C virus (HCV), a common chronic blood borne infection, causes severe diseases in humans, such as cirrhosis and hepatocellular carcinoma (CitationWilkins et al. 2010). About 170 million people are infected with the HCV (CitationPournaghi-Azar et al. 2009). Testing for HCV is offered for at-risk populations, and the polymerase chain reaction is used for the quantification of the virus for confirmatory testing. Ribavirin and pegylated interferon are the recommended current therapy for chronic HCV. Nine genetically distinct HCV genotypes have been shown worldwide so far. In the United States, the ratio of genotype 1 is 72% of the patients with HCV infection; the ratio of genotype 2 is 16% to 19%; the ratio of genotype 3 is 8% to 10%; and the ratios of other genotypes are 1% to 2% (CitationWilkins et al. 2010).
Label-free electrochemical detection techniques have recently received increased attention (CitationLin et al. 2014, CitationLucarelli et al. 2004, CitationWu et al. 2011). The peak heights of guanine and adenine signals are used to develop label-free electrochemical genosensors (CitationErdem et al. 2004, CitationMeric et al. 2002). Such direct detection can be carried out by evaluating the differences in some electrical parameters obtained after the hybridization event. Because these kind of strategies can eliminate the usage of indicators, they make the sensing protocol easier. In addition, the assay is safer, since the indicators used for genosensors are generally toxic or carcinogenic compounds (CitationLucarelli et al. 2004).
Guanine is more easily oxidized and more suitable for indicator-free hybridization detection when compared to other nucleic acid bases (CitationWang 2002). The first indicator-free protocol was developed by Wang et al. (CitationWang et al., 1996b). The hybridization event was observed by recording the decrease of the guanine signal of the immobilized probe, following the addition of the complementary target (CitationLucarelli et al. 2004).
It was reported in the literature that, in comparison with other techniques, the advantages of the label-free electrochemical DNA biosensors using the guanine oxidation signal of oligonucleotides on carbon electrodes are that the strategy is applicable, simple, and less time consuming. However, this method cannot be used for some cases (e.g. increase of the electrochemical guanine signal bases on the electrode after hybridization of the probe with DNA targets having guanine (CitationPournaghi-Azar et al. 2009) ii.) Both probes and target oligonucleotides generally include guanine bases, which make it difficult to determine whether the guanine oxidation signal stems from the targets or the probes. Such limitations were solved by using an inosine-substituted probe (guanine-free) (CitationTosar et al. 2010).
Inosine is a base which is not naturally present in DNA, but it binds to cytosine, as guanine does (CitationTosar et al. 2010). Moreover, it doesn't give any oxidation signal within the potential range of guanine oxidation (CitationWang et al. 1998). Thus, no guanine signal is observed after immobilization with the inosine-substituted probe. Once the target oligonucleotide is hybridized to the immobilized inosine-substituted probe, the guanine oxidation peaks originating from the target DNA are measured by using voltammetric methods (CitationOdenthal and Gooding 2007).
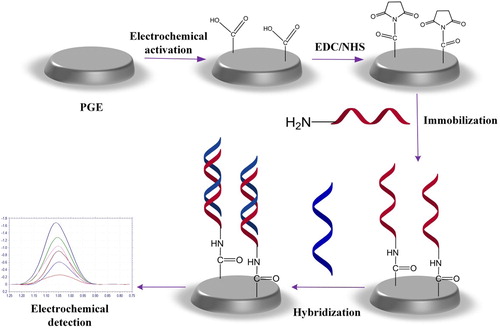
In the work reported here, we present a label-free electrochemical nucleic acid biosensor for the detection and discrimination of HCV1a by using the inosine-substituted probe. First, the electrochemical activation of PGE was carried out. Then, the probes modified with amino groups were immobilized onto a PGE surface by covalent bonding. After probe immobilization, the hybridization with complementary sequences was performed; furthermore, optimal conditions were determined for the biosensor. Square wave voltammetry (SWV) was also used as a monitoring method. Discrimination between the synthetic PCR analogs of HCV1a and HCV3a was demonstrated, exhibiting the suitability of the proposed genosensor for the rapid and specific detection of the HCV1a.
Materials and methods
Apparatus
The CHI 1230B electrochemical analyzer with a three- electrode cell was used to measure the guanine oxidation signal. Three-electrode systems consist of a platinum electrode as an auxiliary electrode, a disposable pencil graphite electrode (surface area of 0.322 cm2) as the working electrode, and an Ag/AgCl reference electrode. The CHI 11.11 software package was also used for the SWV technique.
Chemicals
The pencil graphite was obtained as pencil leads of type HB, from Tombow, which were purchased from a local bookstore. N-(3-dimethylamino) propyl)-N -ethylcarbodiimide hydrochloride (EDC) and N-hydroxysulfosuccinimide (NHS) were purchased from the Sigma-Aldrich Chemical Company. All other chemicals were also obtained from Sigma. Double distilled water was used to prepare all the solutions.
In this paper, the inosine-substituted 20-mer oligonucleotide called pHCV1a, which is complementary to the consensus sequence of HCV1a core protein gene served as the probe, and its complementary DNA oligonucleotide (cHCVa1), related to the consensus sequence of HCV1a, served as the target DNA. Oligonucleotides of 3 mm-HCV1a and ncHCV3a, corresponding to two different nucleotide tree-base mismatch targets of the HCV1a sequence and the universal sequence of HCV3a core/E1 region, respectively, were used. All of the oligonucleotides were supplied as lyophilized powder from Ella Biotech Company (Germany) ().
Table I. Oligonucleotide sequences employed (mismatches are indicated by bold and underlined characters).
The stock solutions of the oligonucleotides (500 mg/mL) were prepared with ultra-pure distilled water and kept frozen. More dilute solutions of the capture probes were prepared using 0.50 M acetate buffer solution (ABS) (pH 4.80) containing 20 mM NaCl. More dilute solutions of the targets were prepared using a 2xSSC buffer solution (pH 7.0). Distilled and deionized water was used in the preparation of all solutions. A fresh PGE surface was used for each measurement composed of the immobilization/detection cycle. Experiments were carried out at room temperature in an electrochemical cell.
Electrode preparation
Electrical contact with the lead was achieved by using a copper drill chuck (the diameter of the inner hole was 0.5 mm). The pencil lead was vertically placed onto the holder and immersed in the solution. All leads had a total length of 50 mm and a diameter of 0.5 mm. A total of 10 mm of lead was immersed in the solution per measurement. The surface was polished on a weighing paper to a smooth finish before each use.
The electrochemical activation of the PGEs was carried out at + 1.4 V for 30 s in 0.5 M ABS (pH 4.8). The aim of the electrochemical activation was to increase the hydrophilic properties of the electrode surface and produce carboxyl groups on the PGE surfaces (CitationWang et al. 1996a).
Probe immobilization
Carboxylic groups were generated onto the PGEs’ working electrode surfaces by electrochemical oxidation (+ 1.4 V for 30 s), in a slightly acidic environment (0.5 M ABS, pH 4.8). Afterwards, an aqueous solution containing 5 mM NHS and 8 mM EDC was used to activate carboxylic groups of the PGEs for 60 min. The probe oligonucleotides, having the 5′NH2(CH2)6 link, were immobilized onto the PGE surface by covalent linking. Immobilization was carried out through the formation of amide bonds between the carboxylic functionality at PGE surfaces and the amino-terminal ends of the probe oligonucleotides (CitationKara et al. 2007).
Hybridization
The nucleic acid biosensor was immersed into the hybridization solution (2xSSC solution of pH 7.0 containing the target or non-complementary sequences) for the desired time. Subsequently, in order to prevent unspecific bonding, the nucleic acid sensors were washed with a washing buffer containing 2 × SSC and % 0, 1 SDS for 5 min.
Voltammetric transduction
The nucleic acid biosensor was then immersed into the ABS (pH 4.8) for voltammetric measurement. The guanine oxidation signal was measured using SWV in ABS, by scanning from + 0.75 V to + 1.25 V with the following experimental conditions: a frequency of 25 Hz, an amplitude of 25 mV, and a step potential of 10 mV. The experimental procedures are illustrated in .
Results and discussion
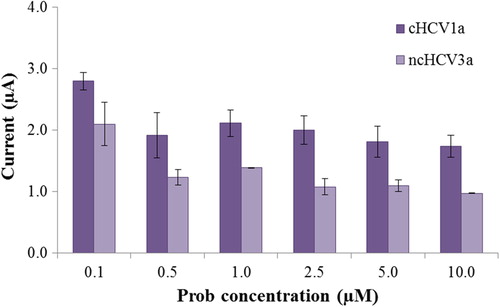
Firstly, in order to determine an optimal probe density for efficient hybridization, we used a series of concentrations of the probe solution, varying from 0.1 to 10 μM. The guanine oxidation signal was measured at about + 1.05 V in the presence of full hybridization between the probe HCV1a and its complementary DNA target. The optimal probe concentration can be determined by comparing the ratio of the complementary signal to noncomplementary signal (c/nc) (CitationKara et al. 2009). As seen in , the highest ratio for c/nc was obtained at a probe concentration of 2.5 μM. Thus, for our further experiments, the optimal probe concentration was selected as 2.5 μM.
Secondly, the hybridization was carried out at different target concentrations varying from 0.5 to 10 μM, and consequently, the c/nc ratio was calculated (data not shown). The concentration of 2.5 μM was chosen as the optimal target concentration for our further studies because of a higher c/nc ratio.
Optimization of probe immobilization and hybridization time
The sensitivity and selectivity of the nucleic acid biosensor was related to the surface coverage of probes on the electrode (CitationBo et al. 2011). Furthermore, one of the factors affecting surface coverage might be the immobilization time, besides probe concentration. With increasing time, DNA probes immobilized onto the surface may also increase. Thus, the optimal probe density can be also determined by optimizing time.
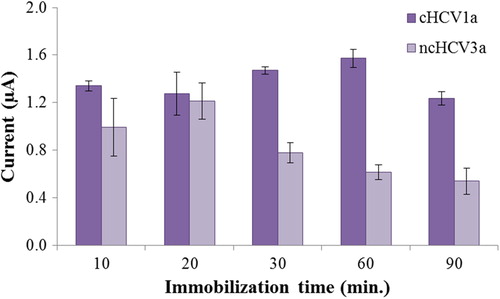
The immobilization time was changed from 10 to 90 min to find the optimal probe immobilization time, and the results were obtained by the oxidation signal of guanine. shows the SWV responses of the guanine increased with an increase in the immobilization time of the probe DNA, and then decreased after 60 min. In addition, the highest c/nc ratio was calculated at 60 min. Therefore, the optimal immobilization time of the biosensor was chosen as 60 min.
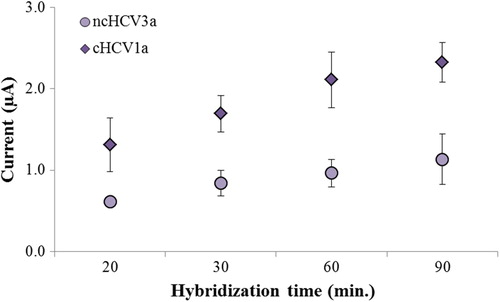
The effect of hybridization time on the detection of the HCV1a region was also evaluated with complementary and noncomplementary target oligonucleotides. Hybridization time is another significant factor in obtaining selectivity (CitationAbad-Valle et al. 2007). The hybridization time step was performed for 20, 30, 60 and 90 min. The best discrimination of hybridization was observed with 60 min of hybridization (). For that reason, the optimal hybridization time of the sensor was selected as 60 min. A time of 60 min has also been used by other authors as the optimal hybridization time for the best discrimination between complementary and mismatched targets (CitationLi et al. 2011, CitationTaufik et al. 2011).
The effect of hybridization buffer and hybridization temperature
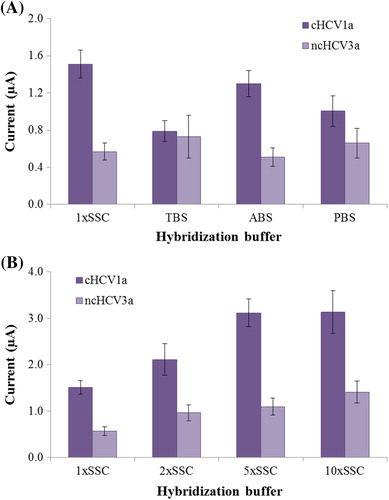
shows the influence of different buffers on the hybridization reaction with the use of optimal concentrations of probe and target. According to the results, the maximum discrimination ratio between the complementary and noncomplementary oligonucleotides was obtained with 1xSSC (pH: 7.0), hence it was selected as the hybridization buffer. Although the 1xSSC buffer was enough to achieve selectivity of the biosensor, the effect of ionic strength on hybridization was investigated in order to further improve the selectivity of the biosensor. As can be seen from , the highest c/nc was obtained as 5xSCC (pH: 7.0). Therefore, 5xSSC was used in our further experiments to achieve an effective hybridization response of the probe and its complementary target.
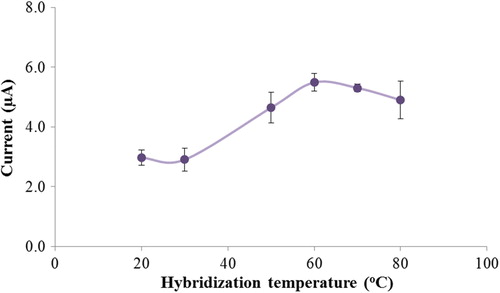
The effect of the hybridization temperature was investigated at temperatures ranging from 25°C to 80°C. By increasing the hybridization temperature up to 60°C, the guanine oxidation signal related to the complementary target increased, and after this temperature, it decreased because of DNA destabilization and denaturation () (CitationAbad-Valle et al. 2007). The temperature of 60°C was thus selected as the optimal hybridization temperature. Even at room temperature, the current response of the biosensor was enough for further biosensor studies.
Selectivity of hybridization in optimized condition
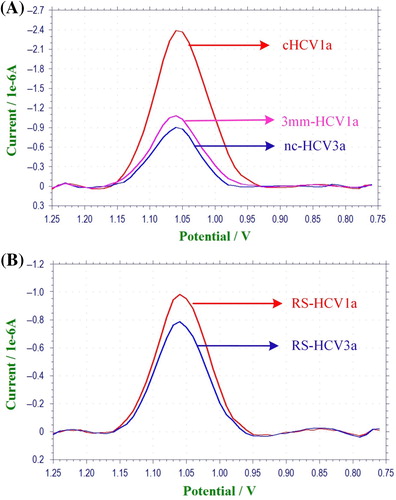
The investigation of the selectivity of hybridization was carried out with different oligonucleotide sequences including the perfect complementary target (cHCV1a), mismatch (ncHCV3a) and three-base mismatch (3 mm-HCV1a) target. The suggested sensor was also subjected to RS-HCV1a and RS HCV3a, which include 50 bases as synthetic PCR analogs of HCV.
The current of SWV of guanine on the 2.5 μM probe-modified PGE after hybridization with ncHCV3a and 3 mm-HCV1a oligonucleotides was − 0.98 ± 0.18 μA and − 1.03 ± 0.11 μA, respectively, which after hybridization with cHCV1a increased to − 2.45 ± 0.05 μA (). The significant current differences of the perfect complementary target DNAs indicate that the suggested sensor readily discriminates between perfectly-matched and mismatched or 3 mismatched oligonucleotides. The selectivity of the nucleic acid biosensor was also evaluated with synthetic PCR analogs which are related to the HCV1a and HCV3a gene regions. According to , nucleic acid biosensors successfully discriminated synthetic PCR analogs which are related to HCV1a and HCV3a. The current of SWV of guanine for RS-HCV1a and RS-HCV3a was − 1.03 ± 0.12 μA and − 0.77 ± 0.06 μA, respectively.
Guanine oxidation signals are lower than those obtained for shorter synthetic DNA. It could be due to the greater steric hindrance of these synthetic PCR sequences compared to the shorter oligonucleotides. In addition, hybridization in solution is easier compared to a solid support (CitationZhang et al. 2012). This could result in weaker electrochemical signals for longer sequences on a solid support.
Linearity and detection limits
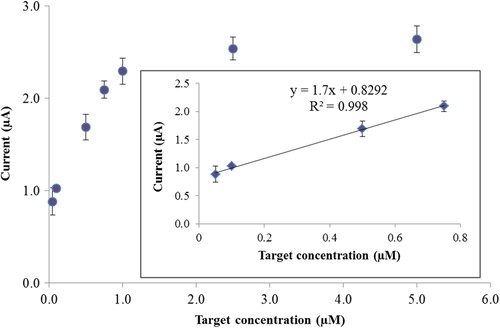
Under the optimized conditions, the diagnostic performance of the nucleic acid biosensor was investigated using the inosine-modified DNA probe to hybridize the different concentrations of HCV1a. As shown in , the peak SWV current is dependent on the concentration of HCV1a. When the concentration of HCV1a was increased from 0.05 to 5.0 μM, the SWV peak increased and leveled off at 2.5 μM. Linearity was obtained between 0.05 and 0.75 μM. The regression equation was y(∆I) = 0.829 + 1.7c (μM), and the regression coefficient (R2) of the linear curve was 0.998. The limit of detection was calculated as 54.9 nM by using the equation yLOD (I) = yB + 3Sy/x, where Sy/x is the standard deviation of blank (in this study, the standard deviation of the calibration graph), and yB is the signal of the blank (in this study, the intercept of the calibration graph). Such a detection limit is acceptable according to the limits reported for the other electrochemical nucleic acid sensors (CitationHuang et al. 2011, CitationLi et al. 2007, CitationLucarelli et al. 2002).
Conclusion
In this study, a simple, sensitive, and label-free electrochemical nucleic acid biosensor was developed for HCV1a detection by using an inosine-substituted probe. Inosine-substituted probes can be used for the label-free electrochemical nucleic acid biosensor screening of guanine oxidation of the target oligonucleotide, since the inosine base can pair with cytosine and it does not emit any signal in the range of the guanine oxidation signal.
Such use of inosine-substituted probes on the electrochemical nucleic acid biosensors has some advantages such as the ability to be used without any extra labeling, which means a decrease in the cost and time of hybridization screening. In addition, by using this label-free approach, there is no need for external indicators and labels such as carcinogenic organic dyes and antitumor drugs posing risks to health.
The nucleic acid biosensor established shows very clear discrimination between the fully complementary target sequence, the three-base mismatched sequence, and the noncomplementary target sequence. It also shows very good selectivity when synthetic single-stranded PCR analogs are used.
Declaration of interest
The authors report no conflicts of interest. The authors alone are responsible for the content and writing of the paper.
References
- Abad-Valle P, Fernández-Abedul MT, Costa-García A. 2007. DNA single-base mismatch study with an electrochemical enzymatic genosensor. Biosens Bioelectron. 22:1642–1650.
- Bo Y, Wang W, Qi J, Huang S. 2011. A DNA biosensor based on graphene paste electrode modified with Prussian blue and chitosan. Analyst. 136:1946–1951.
- Erdem A, Pividori MI, del Valle M, Alegret S. 2004. Rigid carbon composites a new transducing material. J Electroanal Chem. 567:29–37.
- Huang K-J, Niu D-J, Sun J-Y, Han C-H, Wu Z-W, Li Y-L, Xiong X-Q. 2011. Novel electrochemical sensor based on functionalized graphene for simultaneous determination of adenine and guanine in DNA. Colloids Surf B Biointerfaces. 82:543–549.
- Kara P, Cavdar S, Meric B, Erensoy S, Ozsoz M. 2007. Electrochemical probe DNA design in PCR amplicon sequence for the optimum detection of microbiological diseases. Bioelectrochemistry. 71:204–210.
- Kara P, Cavusoglu C, Cavdar S, Ozsoz M. 2009. Direct electrochemical genosensing for multiple point mutation detection of Mycobacterium tuberculosis during the development of rifampin resistance. Biosens Bioelectron. 24:1796–1800.
- Li XM, Ju HQ, Du LP, Zhang SS. 2007. A nucleic acid biosensor for the detection of a short sequence related to the hepatitis B virus using bis(benzimidazole)cadmium(II) dinitrate as an electrochemical indicator. J Inorg Biochem. 101:1165–1171.
- Li Z, Zeng G, Tang L, Zhang Y, Li Y, Pang Y, et al. 2011. Electrochemical DNA sensor for simultaneous detection of genes encoding two functional enzymes involved in lignin degradation. Biochem Eng J. 55:185–192.
- Lin C, Wu Y, Luo F, Chen D, Chen X. 2014. A label-free electrochemical DNA sensor using methylene blue as redox indicator based on an exonuclease III-aided target recycling strategy. Biosens Bioelectron. 59:365–369.
- Lucarelli F, Marrazza G, Palchetti I, Cesaretti S, Mascini M. 2002. Coupling of an indicator-free electrochemical DNA biosensor with polymerase chain reaction for the detection of DNA sequences related to the apolipoprotein E. Anal Chim Acta. 469:93–99.
- Lucarelli F, Marrazza G, Turner AP, Mascini M. 2004. Carbon and gold electrodes as electrochemical transducers for DNA hybridisation sensors. Biosens Bioelectron. 19:515–530.
- Meric B, Kerman K, Ozkan D, Kara P, Ozsoz M. 2002. Indicator-free electrochemical DNA biosensor based on adenine and guanine signals. Electroanalysis. 14:1245–1250.
- Odenthal KJ, Gooding JJ. 2007. An introduction to electrochemical DNA biosensors. Analyst. 132:603–610.
- Pournaghi-Azar MH, Ahour F, Hejazi MS. 2009. Differential pulse voltammetric detection of hepatitis C virus 1a oligonucleotide chain by a label-free electrochemical DNA hybridization biosensor using consensus sequence of hepatitis C virus 1a probe on the pencil graphite electrode. Electroanalysis. 21:1822–1828.
- Taufik S, Yusof NA, Tee TW, Ramli I. 2011. Bismuth oxide nanoparticles/chitosan/modified electrode as biosensor for DNA hybridization. Int J Electrochem Sci. 6:1880–1891.
- Tosar JP, Brañas G, Laíz J. 2010. Electrochemical DNA hybridization sensors applied to real and complex biological samples. Biosens Bioelectron. 26:1205–1217.
- Wang J. 2002. Electrochemical nucleic acid biosensors. Anal Chim Acta. 469:63–71.
- Wang J, Cai X, Jonsson C, Balakrishnan M. 1996a. Adsorptive stripping potentiometry of DNA at electrochemically pretreated carbon paste electrodes. Electroanalysis. 8:20–24.
- Wang J, Cai X, Tian B, Shiraishi H. 1996b. Microfabricated thick-film electrochemical sensor for nucleic acid determination. Analyst. 121:965–969.
- Wang J, Rivas G, Fernandes JR, Lopez Paz JL, Jiang M, Waymire R. 1998. Indicator-free electrochemical DNA hybridization biosensor. Anal Chim Acta. 375:197–203.
- Wilkins T, Malcolm JK, Raina D, Schade RR. 2010. Hepatitis C: diagnosis and treatment. Am Fam Physician. 81:1351–1357.
- Wu D, Yin B-C, Ye B-C. 2011. A label-free electrochemical DNA sensor based on exonuclease III-aided target recycling strategy for sequence-specific detection of femtomolar DNA. Biosens Bioelectron. 28:232–238.
- Zhang QD, March G, Noel V, Piro B, Reisberg S, Tran LD, et al. 2012. Label-free and reagentless electrochemical detection of PCR fragments using self-assembled quinone derivative monolayer: Application to Mycobacterium tuberculosis. Biosens Bioelectron. 32:163–168.