
Abstract
Recombinant proteins, particularly proteins used as therapeutics, are widely expressed for bioprocessing manufacturing processes. Mammalian cell lines represent the major host cells for bioproduction, according to their capacities of post-translational modifications and folding of secreted proteins. Many parameters can affect cell productivity, especially the rate of oxygen transfer. Dissolved oxygen, in high or low proportions, is a crucial parameter which can affect cell viability and thus productivity. HEMARINA has developed a new technology, commercially proposed as HEMOXCell®, to improve cell culture at a large production scale. HEMOXCell® is a marine oxygen carrier having properties of high oxygen sensitivity, to be used as an oxygen additive during cell culture manufacturing. In this study, we investigated the effects of HEMOXCell® on the culture of the commonly used CHO-S cell line. Two main objectives were pursued: 1) cell growth rate and viability during a batch mode process, and 2) the determination of the effect of this oxygen carrier on recombinant protein production from a CHO-transfected cell line. Our results show an increase of CHO-S cellular growth at a rate of more than four-fold in culture with HEMOXCell®. Moreover, an extension of the growth exponential phase and high cell viability were observed. All of these benefits seem to contribute to the improvement of recombinant protein production. This work underlines several applications using this marine-type oxygen carrier for large biomanufacturing. It is a promising cell culture additive according to the increasing demand for therapeutic products such as monoclonal antibodies.
Introduction
Biotechnology has gained interest over the last several decades, particularly in the field of recombinant proteins. The need for recombinant proteins is continuously increasing, both in fundamental research as well as for clinical applications. Indeed, the demand for the production of recombinant proteins by pharmaceutical companies served a global market of $32 billion in 2003 and reached $108 billion in 2010 (CitationPavlou and Reichert 2004, CitationWuest et al. 2012). Among the different existing production systems, mammalian cells are the more advantageous and represent developing new technology for biopharmaceutical companies. Although their cultivation is more expensive and takes longer than the other production systems, they are the only host cells that have the capacity to secrete proteins with proper folding, assembly, and post-translational modifications. About 50–60% of recombinant proteins for therapeutic use (and up to 80% for monoclonal antibodies (mAb)) are produced in mammalian cell systems (CitationOmasa et al. 2010, CitationWalsh 2006).
Immortalized Chinese Hamster Ovary (CHO) cell lines currently constitute the most-used expression system for large-scale production of recombinant proteins (CitationHu and Aunins 1997). Indeed, CHO cells have been widely studied and characterized through decades of research, and nowadays they represent a large database for bioproduction. Their suitability has led to safe production of numerous recombinant therapeutics for humans, like mAb production (CitationBirch and Racher 2006, CitationKelley 2009). Other advantages of these cells are their fast growth properties, their ease of transfection, their adaptability to serum-free medium, and their ability to perform complex post-translational modifications required for biological activity and compatibility with humans (CitationAlmo and Love 2014, CitationOmasa et al. 2010, CitationRita Costa et al. 2010). However, the growth of mammalian cells is slower than that of the microbial host systems, the cultivation processes are longer, and the engineering selection and construction of a mammalian cell line is more complex.
Generation time (or population doubling time (PDT)) is an important parameter for the evaluation of culture expansion. It was mentioned that the typical growth rate of mammalian systems is about 0.02 to 0.05 h− 1, which is less than the microbial growth rate (0.4 to 0.6 h− 1 for yeast and 1 to 3 h− 1 for bacteria) (CitationMuller et al. 2006, CitationOmasa et al. 2010).
The demand for biopharmaceutical proteins is continuously growing, hence the necessity to optimize production processes in order to reduce production time and increase productivity. Moreover, for CHO cells and other mammalian cell lines, the yields of recombinant protein are rather low. The process to scale-up production from cell bank to bioreactor at a production-scale (cell thawing, cell cultivation in bioreactors of sizes increasing by 5–8-fold until large production-scale cultivation) usually takes several weeks to months. Another disadvantage of mammalian cell cultivation is the low cell density, with a typical cell concentration of about 1 to 10 × 106 cells/ml (CitationOmasa et al. 2010, CitationWurm 2004). Over the past two decades, significant improvements have been made, contributing to dramatic increase in cell density and subsequently cell productivity. Culture conditions like stirring speed, osmolarity, temperature, partial pressure of oxygen, and pH variations can influence CHO cell growth. In a 1990 study, Kuranto and his team analyzed these different parameters and determined that pH and concentration of dissolved oxygen were the parameters with the most influence in the culture of the CHO non-adherent cell line (CitationKurano et al. 1990). Culture conditions can also affect the glycosylation potential of these mammalian cells (CitationJenkins et al. 1996). The use of serum-free media with a defined composition of amino acids seems to be a good substitute to serum-supplemented media, and provides a stable and xenogeneic-free environment (CitationCosta et al. 2013; CitationdeZengotita et al. 2002).
It is therefore important to maintain a sufficient cell density in order to enhance productivity, and that is why cell engineering targets cell viability. Cell death in the batch culture mode can have several origins; stirring and sparged bubbles can induce stresses and lead to apoptosis, as well as nutrient starvation, lack of oxygen, and waste products (CitationDhanasekharan et al. 2005, CitationKrampe and Al-Rubeai 2010). To delay stress-induced cell death, antiapoptotic engineering technologies were developed with the aim to overexpress antiapoptotic factors and suppress proapoptotic factors like the Bcl-2 and Bcl-xL proteins (CitationDorai et al. 2010, CitationFigueroa et al. 2007, CitationLee et al. 2013, CitationMajors et al. 2008, CitationMeents et al. 2002).
Recent research has been aimed at finding a way to replace the addition of oxygen by bubbling with a less lethal system for cells. Indeed, this process has created two major problems: (i) oxidative damages; (ii) shear stress-generated sparging air or pure oxygen. It was proposed that gases can be encapsulated in a thin polymer and can be released when the oxygen pressure decreases. This system does not induce cell death, but the oxygen-loaded particles present an inconvenience in the absorption of a significant quantity of secreted proteins (CitationSeth et al. 2006). In addition, an overlay intensive supply of oxygen can induce oxidative stress, leading to a secretion of reactive oxygen species (ROS) which can cause significant cellular damage like protein degradation (CitationCacciuttolo et al. 1993, CitationOller et al. 1989).
HEMARINA, a french company, has developed HEMOXCell®, as an oxygen carrier to bypass existing issues to transfer oxygen to cells. HEMOXCell® is a hemoglobin extracted from a marine worm, Nereis virens, with a high oxygen affinity (CitationChabasse et al. 2006, CitationRousselot et al. 2006). The binding and release of oxygen from this carrier occurs by simple diffusion along oxygen partial pressure gradients, according to the cellular needs. This oxygen carrier has a high molecular weight, natural extracellular properties, and the ability to be used within a wide temperature range. Other original characteristics of this oxygen carrier are its intrinsic SOD-like activity and its ability to bind over one hundred oxygen molecules at the same time (Franck CitationZal and Rousselot 2014).
The feasibility of using HEMOXCell® as an oxygen carrier to supply oxygen in a bubbling-free batch culture system was investigated. The CHO-S non-adherent cell line, derived from the parental CHO-K1 cell line, was chosen as the mammalian cell model for this study. The benefits of HEMOXCell® supplementation in serum-free medium was considered in terms of cell growth and cell viability, and for its ability to promote recombinant protein production in CHO-S transfected with Enhanced Green Fluorescent Protein (EGFP). The aim of this study was to find a bioprocess adaptable to high scale-up of protein production, limiting cell apoptosis, and increasing the amount of cell density and productivity.
Material and method
HEMOXCell®
The extracellular hemoglobin M201 has been used to create the product designated as HEMOXCell® (HEMARINA SA, Morlaix, France). This molecule is extracted from the marine lugworm Nereis virens. The extraction process is realized under gentle agitation of frozen worms at 4°C, followed by a purification step and a conditioning process. HEMOXCell® has been developed to replace the way oxygen is traditionally supplied to cells from early stage R&D studies to process development and finally production of recombinant proteins at commercial scale.
Cell culture methods
Culture conditions of cell lines
The CHO-S cell line was purchased from GIBCO® (GIBCO®, Invitrogen™, Fisher Bioblocks Scientific, Illkirch, France). The CHO-EGFP cell line was obtained by stable transfection of CHO-S cells with the expression vector pEGFP-N3 (Clontech, Saint-Germain-en-Laye, France) containing the improved reporter gene GFP (e-GFP). Both cell lines were cultured in CD-CHO medium supplemented with 8 mM L-glutamine, 100 μM sodium hypoxanthine, and 16 μM thymidine (GIBCO®) in Erlenmeyer flasks with a vent cap (Corning, Chorges, France). Cultures were maintained in a humidified atmosphere with 5% CO2 at 37°C until they reached a density of 2 × 10⁶ cells/mL, and they were reseeded twice a week by dilution at a density of 2 × 10⁵ cells/mL.
Transfection of CHO-S cells
CHO-S cells were plated at 3 × 10⁵ cells/mL on 6-well plates (Nunc™, Rochester, NY, USA) for 15 h, and cells were transfected by lipofection with the linearized plasmid vector pEGFP-N3. According to the manufacturer's instructions, a ratio per well of 5 μg of DNA to 25 μL of Lipofectamine LTX (Invitrogen™) was diluted in 250 μL of Opti-MEM (Invitrogen™). After 48 h, transiently transfected cells were grown in a culture medium supplemented with 500 μg/mL G418. The enrichment step of the stably transfected cells—the CHO-GFP cells—was performed for 11 days. The selection pressure was then maintained at 250 μg/mL of G418 in the growth medium.
Experimental conditions
For experimental studies, CHO-S and CHO-GFP cells were seeded at a density of 2 × 10⁵ cells/mL in 30 mL of supplemented growth medium dispensed in a 125-mL shaking flask (Costar™, Burladingen, Germany). The growth medium was also supplemented with various concentrations of HEMOXCell™ (from 0 to 2 mg/mL). The cultures were maintained under orbital stirring at 120 rpm in an incubator (IG 150, Thermo Scientific) with 5% CO2 at 37°C. They were maintained and studied until total loss of cell viability.
Parameters studied
Cell growth and cell viability
Cell quantification was carried out by two different methods: a manual counting performed with a Malassez hemocytometer and an optical microscope (Olympus, Hamburg, Germany); and an automated counting performed with Cellometer™ Auto T4 cell counter (Nexcelom Bioscience, Lawrence, Canada) coupling to the Cellometer™ Auto Counter software (Nexcelom Bioscience).
Cell viability was determined by the trypan blue exclusion method. PDT was calculated during the exponential growth phase using the following formula: tD = ln2/μmax with μmax = ln(Nt-N0)/∆t, where tD is the value of PDT (hour), μmax is the maximum growth rate (hour− 1), Nt is the cell density at the end of the exponential phase (cells/mL), and N0 is the cell density at the beginning of the exponential phase (cells/mL).
Cell death
Apoptosis detection assay
Cell death was evaluated using a co-staining procedure based on a commercial detection kit (Annexin V-FITC Kit, Miltenyi Biotec, Paris, France). Briefly, 1.106 cells were washed and resuspended in 100 μL of binding buffer 1X according to the manufacturer's instructions. Subsequently, cells were incubated with 10 μL of Annexin-V conjugated to FITC (AV-FITC) for 1 h in the dark and at room temperature. Then, cells were washed with 1 mL of binding buffer 1X and centrifuged at 300 g for 10 min. The cell pellet was resuspended in 200 μL of washing buffer. The fluorescence was measured using a microplate fluorescent reader (Safire2™, Tecan, Lyon, France) coupled to the Magellan® software (Tecan) (excitation/emission wavelengths: 488 nm/530 nm). Then, 0.5 μg of propidium iodide (PI) was added to each well and fluorescence was again measured (excitation/emission wavelengths: 535 nm/620 nm). Control cells were included in each set of experiments. The fluorescence intensity obtained for each condition was expressed as relative fluorescence unit (RFU).
Caspase activity
Measurement of caspase-3 activity was carried out using the Caspase-3 Fluorometric Assay Kit, according to manufacturer's instructions (R&D Systems Europe, Abingdon, UK). Briefly, 1.106 cells were analyzed in each condition. The cells were centrifuged at 250 g for 10 min and resuspended in 100 μL of lysis buffer with protease inhibitors (Roche, Meylan, France). The suspension was then incubated for 10 min at 4°C and stocked at − 20°C until assay. The caspase-3 substrate was added for the measure of activity. The resultant fluorescence was quantified with Safire2™ (excitation/emission wavelengths: 400 nm/550 nm) and analyzed with Magellan® software. The results were expressed as percentage of caspase-3 activity in cells during culture vs before experimentation.
GFP expression
The specific fluorescence of CHO-S cells transfected with EGFP was determined by fluorometry. Two hundred microliters of cell suspension were transferred to a 96-well plate. The fluorescence was collected using Safire2™ (excitation/emission wavelengths: 485 nm/515 nm). The background fluorescence of the cell culture medium and/or of non-transfected cultures was subtracted from each value, to give the RFU.
Gel filtration analysis
The structure of HEMOXCell® was analyzed by gel filtration using Fast Protein Liquid Chromatography (FPLC) (Ultimate® 3000, Dionex, Saint-Quentin-en-Yvelines, France). Briefly, an aliquot of CHO-S cells cultured with 0.75 g/L HEMOXCell® was taken each day during 10 days of culture and centrifuged at 10,000 g for 10 min, and the supernatant was conserved at − 80°C until use. Gel filtration was performed on a Superose six column (Superose TM 6, 10 × 300 nm; GE Healthcare, Velizy, France), with a fractional range of 5 to 5000 kDa and an elution flow rate of 0.5 mL/min. The separation was performed using the elution buffer composed of 10 mM TrisBase, 145 mM sodium chloride (NaCl), 4 mM potassium chloride (KCl), 0.2 mM magnesium chloride (MgCl2), and 2.5 mM calcium chloride (CaCl2). Chromatographic data were collected and processed using the Chromeleon® software (Dionex) for two wavelengths—280 nm and 414 nm. Kinetics were realized with a daily measurement with GraphPad® software.
UV-visible absorption spectrophotometry
The functionality of HEMOXCell® was defined by its capacity to reversibly bind dioxygen molecules. The functional state of Hb may be determined by the relative decrease in the intensity of the alpha and beta bands over time (). An aliquot of CHO-S cells cultured with 0.75 g/L HEMOXCell® was taken at various time-points during culture, during a period of 10 days. The cell suspension was centrifuged at 10,000 g for 10 min and supernatant was conserved at − 80°C until use. For analysis, samples were placed in a 96-well plate (Nunc™). Functional study was conducted by UV-visible spectrometry on wavelengths ranging from 250 nm to 700 nm using the spectrophotometer Synergy™ 2 (BioTek, Colmar, France) coupled to Gen 5™ software (BioTek). After acquisition, the percentage of oxidized HEMOXCell® was determined with UV-visible spectra normalized at 523 nm, the isoelectric point of the HEMOXCell®. Oxidation percentage was calculated using the following formula: Oxidized %HEMOXCell® = 100 – [AHb-A100] × 100/A0-A100, where AHb = A540 + A576 for the HEMOXCell® sample, A0 = A540 + A576 of 0% oxidized HEMOXCell®, and A100 = A540 + A576 of 100% oxidized HEMOXCell®.
Table I. Summary table of Hb conformations according to the characteristic absorption peaks. The Hb spectral signature contains three characteristic peaks: the alpha band and beta band are characteristic of the absorption of the complex consisting of the nucleus—heme, iron, and dioxygen; the Soret band is characteristic of the absorption of the heme nucleus and polypeptide chain complex.
Statistical analyses
Data were expressed as means ± SD of three to four independent experiments, using the paired Student’s t-tests and the non-parametric Dunnett's test to identify significant differences between experimental groups and control conditions. Statistical significance is achieved if p < 0.05. Statistics were generated using InStat® version 3.10 (GraphPad Software(r), La Jolla, USA).
Results
HEMOXCell® boosts cell growth
The growth of CHO-S cells showed four characteristic phases (): the lag phase until day 1, where cells grew slowly and adapted their metabolism to cell culture conditions; the exponential phase between day 1 and day 4, where cell growth was optimal, with the PDT of the culture calculated along this period being 24.1 h; the stationary phase, between day 5 and day 7, where cell growth had slowed and reached a plateau; and finally, the death phase, from day 8.
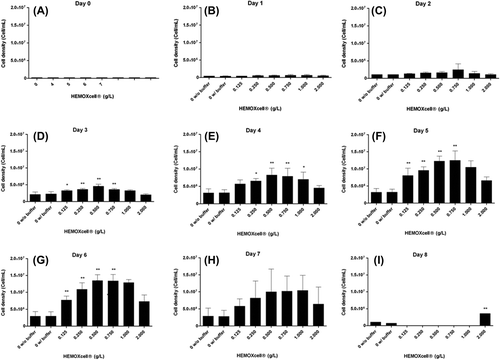
Figure 1. Analysis of the impact of HEMOXCell® concentration with CHO-S. CHO-S cells were cultivated in suspension for 8 days in the absence (A: 0 g/L without buffer) or with different concentrations of HEMOXCell® (B: 0 g/L; C: 0.125 g/L; D: 0.250 g/L; E: 0.500 g/L; F: 0.750 g/L; G: 1 g/L; H: 2 g/L) in the presence of the conditioning buffer. Cell density (cells/mL) was calculated for each condition during 8 days, PDT (tD) was determined during the exponential growth phase. The results correspond to the mean ± SD (n = 3 or 4 per group). P-value was calculated to control. *P < 0.05; **P < 0.01.
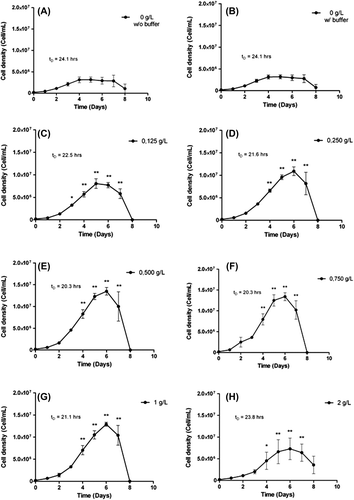
The culture of CHO-S in presence of the oxygen carrier storage buffer was similar to that of control cells (). No significant changes in cell density were observed, and the PDT was equivalent.
The addition of HEMOXCell® during cell culture had no effect on the lag phase (). However, HEMOXCell® significantly amplified the exponential phase: it lasted two more days than control, and cell density was increased. Cell density was amplified in a dose-dependent manner from 0.125 to 0.500 g/L, in a ratio from 2.5 to 4.6, respectively (). Conversely, when using higher concentrations than the effective dose of HEMOXCell®, it was found that the cell growth rate was decreased (). Indeed, cell density was similar at 0.750 g/L, and a slight decrease was drawn at 1 g/L, which was confirmed at 2 g/L. However, cell growth at these concentrations was still more potent than in the control conditions. Over this period, HEMOXCell® consequently reduced the PDT of the culture, which was decreased to 20.3 h at 0.500 g/L and remained unchanged at 0.750 g/L ().
Figure 2. Analysis of CHO-S cell density with HEMOXCell®. CHO-S cells were cultivated with different concentrations of HEMOXCell® (from 0 to 2 g/L) during 8 days. Two culture conditions were performed without HEMOXCell®, with or without the storage buffer to control its safety. The results correspond to the mean ± SD (n = 3 or 4 per group). P-value was calculated to control: *P < 0.05; **P < 0.01.
Then, from day 7, cell cultures showed a sharply declined process without going through a stationary phase, and no more cells were counted after day 8.
HEMOXCell® maintains cell viability
To ensure that the addition of HEMOXCell® did not negatively impact cell culture, we determined cell viability in batch culture using the trypan blue dye exclusion method. Firstly, the cell viability of control cells was maintained above 95% until day 5, that is, during the lag phase and the exponential phase of cell culture (). After the 5th day, viability decreased to below the 95% value and reached a value of around 80% on day 7 and less than 20% on day 10. No significant changes in cell viability were observed when cells were cultured with the storage buffer.
Figure 3. Profiles of cell viability and caspase-3 activation of CHO-S cells. (A) Viability of CHO-S cells was analyzed at various HEMOXCell® concentrations. CHO-S cells were cultured during 8 days, with HEMOXCell® concentrations ranging from 0.125 to 2 g/L. Viable cells were distinguished from dead cells using the trypan blue dye exclusion method. Results are expressed as mean ± SD of 3 or 4 independent experiments. (B) Caspase-3 activation in CHO-S cells. Caspase-3 activation was determined using fluorescent staining against cleaved caspase-3. Caspase-3 is an intracellular cysteine protease activated during the cascade of events associated with apoptosis. Caspase-3 activation was observed between days 6 and 7 after kinetic start. Results are expressed in relative fluorescence units (RFU) during 7 days of culture with three HEMOXCell® concentrations (0 g/L, 0.250 g/L, and 0.500 g/L). Results are expressed as mean ± SD of 2 independent experiments.
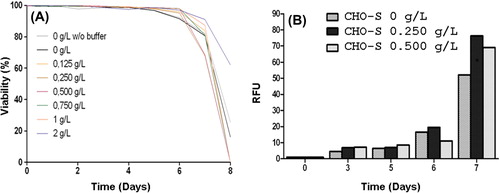
In the presence of HEMOXCell®, viability was maintained above 95% until day 6. On day 7, viability with 0.125 to 1 g/L HEMOXCell® was about 75–80%, slightly under that of the control cells. Then, the viability rapidly dropped and all cells were dead on day 8. Cell response with 2 g/L HEMOXCell® was different since viability decreased more slowly and was 60% on day 8, and more than 20% of cells on day 10 were still viable.
HEMOXCell® does not impact the cell death process
HEMOXCell® showed benefit on cell culture growth and viability. However, the decline phase and the loss of viability were evident. To ensure that HEMOXCell® did not negatively impact cell culture, we decrypted the cell death process. We chose to drive this study at HEMOXCell® levels of 0.250 and 0.500 g/L.
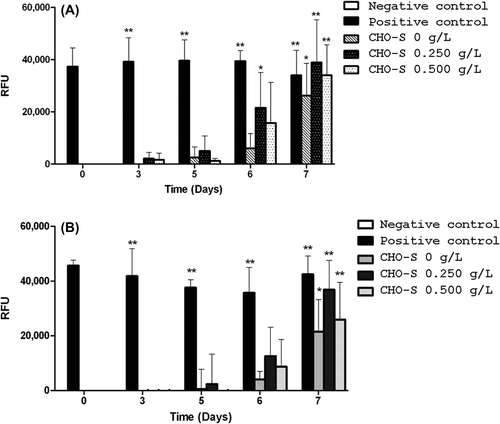
As shown in , AV-FITC and PI staining were low until day 5. Then, the intensity of AV-FITC fluorescence increased from day 6 to day 7, whereas the increase of PI staining was delayed at day 7. This suggests an apoptotic process that began at day 6, followed by a necrotic process at day 7. No connection between cell viability and HEMOXCell® concentration can be established. This was confirmed with caspase-3 activity, that exploded at day 7 (). Moreover, the apoptotic process occurring during cell culture was not modified with HEMOXCell®; the occurrence and the intensity were similar to the control conditions.
Figure 4. Apoptosis vs. necrosis detection. Fluorescent signals of annexin V (top) and propidium iodide (bottom) were measured in CHO-S cells cultivated with three HEMOXCell® concentrations (0 g/L, 0.250 g/L, and 0.500 g/L). Annexin V staining was used to detect translocation of phosphatidylserine (PS) from the internal to the external surface of the cell membrane, and propidium iodide (PI) was used to reveal necrotic cells. A positive control was obtained with an incubation of CHO-S cells with 100 μM valinomycin for 5 h, to induce cell death. Significant annexin V and PI staining were seen at the beginning of days 6 and 7 after kinetics began, respectively. The results corresponded to the mean ± SD (n = 3 or 4 per group). P-value was calculated to control: *P < 0.05; **P < 0.01.
HEMOXCell® boosts cell production
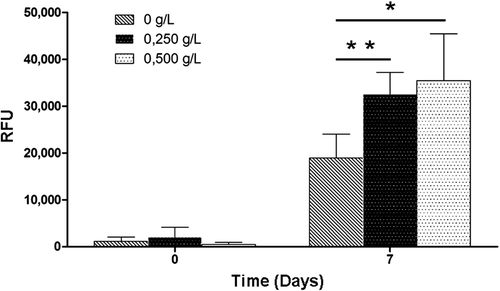
Protein production has been determined in CHO-S transfected with EGFP. The EGFP protein differs from the native protein by a few amino acids that ensure high purity and maximal GFP fluorescence. Fluorescence intensity reflects the production of recombinant proteins by the cells, and was measured at day 0 and day 7 of batch culture (). Here, we show that HEMOXCell® does not induce a non-specific fluorescence signal at day 0. At day 7, analysis revealed that HEMOXCell® significantly boosts recombinant protein production in the CHO-EGFP batch culture compared to the culture without the carrier. We can observe an increase of 70% of recombinant protein production in 0.250 g/L HEMOXCell®-supplemented medium (P = 0.006), and more than 80% with 0.500 g/L HEMOXCell® (P = 0.017). It seems that this increased fluorescence was relative to the tested concentration, and no significant difference was found; however, fluorescence appeared higher at 0.500 g/L than at 0.250 g/L.
Figure 5. Impact of HEMOXCell® for production of EGFP with CHO-EGFP cells. Transfected CHO-EGFP were cultured during 7 days with three HEMOXCell® concentrations (0 g/L, 0.250 g/L, and 0.500 g/L). EGFP-specific fluorescence was analyzed at day 0 and day 7 as relative fluorescence units (RFU). Results are expressed as mean ± SD of 4 experiments. P-value was calculated to control. *P < 0.05; **P < 0.01.
Functional and structural analysis of HEMOXCell®
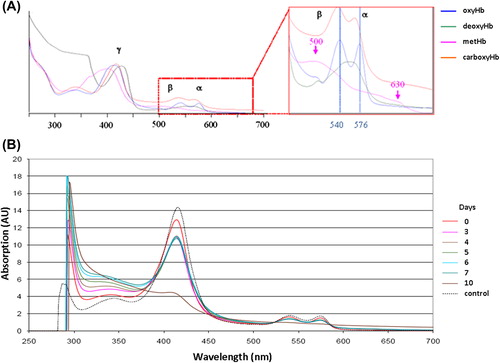
In order to characterize the functional evolution of HEMOXCell® during batch culture, we performed a functional analysis by UV-visible spectrometry and a structural analysis by fast protein liquid chromatography (FPLC). A spectral signature of 0.750 g/L HEMOXCell® solution was determined by UV-visible spectrometry using wavelengths ranging from 250 to 700 nm (). Data indicated that between day 0 and day 7, the maximum absorption ranged between 414 and 416 nm for the Soret band (characteristic of the absorption of the heme nucleus and polypeptide chain complex), between 539 and 541 nm for the alpha band, and between 574 and 575 nm for the beta band. The alpha and beta bands are characteristic of the complex heme nucleus/iron/dioxygen absorption. However we can note a diminution of the intensity of each peak over time, which underlines the oxidation of a part of the HEMOXCell®, as is evident on the UV-visible absorption spectra of HEMOXCell® under its different conformations (). The spectrum obtained at day 10 showed an offset of the maximum absorption for the Soret band at 460 nm. This observation indicates that molecules contained in HEMOXCell® are in a methemoglobin state and therefore unfunctional, and the disappearance of alpha and beta bands confirms this idea.
Figure 6. HEMOXCell® UV-visible spectra. (A) UV-visible absorption spectrum of HEMOXCell® under its different conformations. Soret band (γ) is between about 406 and 430 nm, beta band (β) and alpha band (α) are in the ranges of 500–555 nm and 555–630 nm respectively. (Blue: oxyhemoglobin; green: deoxyhemoglobin; pink: methemoglobin; orange: carboxyhemoglobin). (B) The absorbance of 0.750 g/L HEMOXCell® was determined as between 250 and 700 nm during the 10 days. The spectra obtained were superposed on a graphic representation. The control spectrum corresponds to HEMOXCell® diluted at 0.750 g/L in the conditioning buffer. Results were normalized at 523 nm and corresponding to one experiment. (AU = Absorption unit).
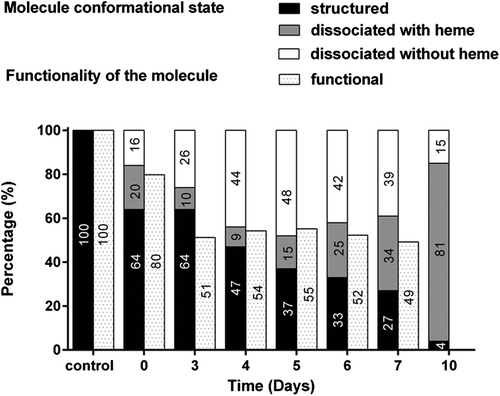
Concerning the structural evolution of 0.750 g/L HEMOXCell® solution over time, the analysis was performed by FPLC with two chromatograms. The first was performed at 280 nm and represented all the proteins contained in the medium, and the other at 414 nm was specific for heminic-proteins. The chromatogram evolution at 280 nm allows measurement of HEMOXCell® degradation, and that at 414 nm was used to determine the proportion of dissociation product containing heme, and thus the potentially functional molecules (). Chromatograms obtained during the 10-day culture were superposed for both wavelengths, and the percentage of functional molecules was calculated, which has been represented . A characteristic retention time of 17 min was obtained for the native state of the molecule (HEMOXCell® diluted at 0.750 g/L in storage buffer) (data not shown), associated with 100% of functional molecules (). The percentage of functional molecules decreases from 80% at day 0 to 51% at day 3, and remains stable until day 7. In parallel, 64% of HEMOXCell® molecules are structured in the CD-CHO medium, and over the culture period, a decrease of 4% of the structured molecule was observed at day 10.
Figure 7. Structural and functional evolution of HEMOXCell® during CHO-S batch culture. The evolution of the various conformational states of HEMOXCell® during culture is represented in percentage (%) per day. Results correspond to the percentage of the structured molecule, the molecule dissociated containing heme, and the molecule dissociated without heme, in comparison with the control conditions consisting of HEMOXCell® diluted at 0.750 g/L in the conditioning buffer. The evolution of HEMOXCell® functionality during culture is represented as percentage (%) per day. Results correspond to the percentage of unoxidized functional molecules in comparison with the control conditions consisting of HEMOXCell® diluted at 0.750 g/L in the conditioning buffer.
Discussion
This study consisted of investigating the effect of HEMOXCell® in a reference mammalian cell line, the CHO-S cell line (CitationHu and Aunins 1997, CitationWurm 2004). CHO cells have thereafter been largely used in pharmaceutical and medical purposes for the production of therapeutic proteins and antibodies for diagnostic purposes (CitationBirch and Racher 2006, CitationKaneko et al. 2010, CitationKelley 2009). The strong demand for recombinant biomolecules, such as monoclonal antibodies, requires optimized processes in order to produce a higher amount of recombinant proteins, save time, and finally achieve a reduction in the manufacturing cost. This study revealed that HEMOXCell® promotes the growth of a large number of cells per unit volume, with an enhanced productivity, using a simple and effective oxygen supply. The latter constitute the most important properties required for an efficient process and its scale-up. For this purpose, HEMOXCell® was selected due to its numerous advantages such as anti-oxidative properties and its ability to deliver a high amount of oxygen in a simple oxygen gradient.
In the first part of this project, we have demonstrated how HEMOXCell® increased cell density in the batch bioreactor system and extended the exponential phase of growth for one or two days. Our results on the growth follow-up revealed a dose-dependent effect of HEMOXCell® with an optimal concentration of 0.500 g/L. Higher concentrations gradually increase the PDT, probably due to an overdose of HEMOXCell® in the medium, inducing a reverse effect of the oxygen carrier. In addition, cell viability could be maintained for a longer period with the optimal dose and stay higher than 95% until day 6 of culture. It is crucial to maintain a high viability in order to enhance the production rate of cells (CitationBirch and Racher 2006, CitationWurm 2004). A closer study of cell death highlights an apoptotic process by the activation of caspase-3 apoptotic protein. This kind of cell death is characteristic of batch culture and is in major part due to a depletion of nutrients and a lack or an excess of dissolved oxygen, which induces modifications of the physiological environment (CitationArden and Betenbaugh 2004, CitationGoswami et al. 1999). HEMOXCell® has no impact on the induction of the apoptotic process, therefore a possible combination of this oxygen additive in cell medium with CHO cells transfected with the bcl-2 or bcl-x gene can be expected, according to other reports (CitationMajors et al. 2008). Chemical compounds such as Suramin (CitationZanghi et al. 2000) or proteins like transferrin and insulin have also shown anti-apoptotic effects on CHO cells cultured in the bioreactor (CitationSunstrom et al. 2000).
Indeed, in this study, we have shown that cells died via apoptosis until day 6, and an induced death was detected at day 7 in culture with or without HEMOXCell®. Considering the higher cell density with HEMOXCell®, observations could be correlated with an increase of nutrient consumption and therefore with an increase of apoptotic effects. The results show that cell density remains relatively constant during this period (6–7 days of culture), and this is why we observed the occurrence of cell death. This observation reflects a balance between cell division and cell death. However, these results are difficult to interpret because in our system, cell culture was maintained as a batch, without removal of medium. The decrease of viability, with only about 18% at day 10, corresponds to the phase of cellular decay. During this phase, cells no longer divide and die, causing an increasing degradation of culture conditions and accelerating the process of cell death (CitationCollins et al. 1997).
The second part of this work consisted of evaluating the impact of HEMOXCell® on recombinant protein production in the transfected CHO-S cell line. In our model, the calibration of fluorescence detection was required because we observed an auto-fluorescence of culture medium, probably linked to pyridines and flavines contained (CitationDrepper et al. 2010). However, this auto-fluorescence can constitute a limitation to the fluorometric detection of EGFP. Nonetheless, an analysis of EGFP production shows an increase by more than 70% in the presence of HEMOXCell®.
In parallel to these analyses, the structure and functionality of HEMOXCell® were monitored during culture. We observed a degradation of the molecule over time as well as a loss of functionality. These analyses have to be completed and experiments may need to be repeated in culture medium continuously buffered with carbon dioxide, which should be sufficient to limit the dissociation of molecules. HEMOXCell® is a naturally highly polymerized protein constituted of 198 polypeptide chains including 156 globin chains, each being able to bind one oxygen molecule (CitationZal et al. 1997). It has been reported that pH variations and temperature can improve the dissociation process (CitationRousselot et al. 2006), suggesting the use of a continuous culture system to ensure a stable structure of the molecule. An alternative could be the encapsulation of HEMOXCell®, as for example a dialysis system, to retain degradation products.
Indeed, oxygen supply in bioproduction is currently performed by direct bubbling of air and oxygen into the culture medium. In some cases, it could become cytotoxic and involved in oxidative stress or a mechanism damaging the culture. High oxygen supply has been reported to increase CHO growth without inducing an increase of intracellular superoxide level, which seems to have a stimulating effect on oxygen consumption by cells (CitationKurano et al. 1990).
Despite the fact that we still must work towards improvements of our batch culture process, HEMOXCell® could constitute an innovative tool for bioproduction in batch, fed-batch and continuous culture modes. HEMOXCell® is a new technology produced as an additive for cell culture, its high sensitivity to oxygen pressure allowing the oxygen delivery to the cells according to their needs. This delivery occurs by a simple gradient of the partial pressure of oxygen within the culture medium, which represents a new and original concept.
This project was realised at a laboratory scale using HEMOXCell® as the oxygen carrier, demonstrating, as a first step, its capability to improve cell growth rate, stabilize and maintain high cell viability, and on the other hand, increase of the targeted recombinant protein production rate. In this context, a recent study was initiated using different rates of stirring and gas supply. Our preliminary results appear to confirm the beneficial contribution of HEMOXCell® on CHO growth rate, with the use of significantly lower doses. The optimization of culture conditions, such as reducing the rate of stirring and controlling the supply of carbon dioxide, seems to limit cell death and to improve growth. These parameters will be considered to optimize the culture of CHO cells and to improve the production of recombinant proteins.
Complementary experiments such as fed-batch and continuous modes have to be addressed. In addition, this study on the CHO-S cell line will be extended with the use of other cell lines, for example, hybridoma for the production of monoclonal antibodies.
This present work contributes to a better understanding of the potential of HEMOXCell® and highlights points for improvement, to optimize large-scale bioproduction in a GMP-compliant manner.
Acknowledgments
The authors thank the ANRT (Association Nationale Recherche Technologie) for its financial contribution (grant CIFRE N°2012/1161). We are greatful to Olivier Berteau (HEMARINA Inc, Cambridge-USA) for his help with the proofreading and his support.
Conflict-of-interest disclosure
F. Z. and M. Ro. are founders and hold stock in HEMARINA SA, which produces the substance being investigated. E. L. holds stocks in HEMARINA SA. F. L. is an employee of HEMARINA SA and doesn't hold stock. All other authors declare no conflict of interest. Materials for the studies were provided by HEMARINA.
References
- Almo SC, Love JD. 2014. Better and faster: improvements and optimization for mammalian recombinant protein production. Curr Opin Struct Biol. 26C:39–43. doi:10.1016/j.sbi.2014.03.006
- Arden N, Betenbaugh MJ. 2004. Life and death in mammalian cell culture: strategies for apoptosis inhibition. Trends Biotechnol. 22: 174–180. doi:10.1016/j.tibtech.2004.02.004
- Birch JR, Racher AJ. 2006. Antibody production. Adv Drug Deliv Rev. 58:671–685. doi:10.1016/j.addr.2005.12.006
- Cacciuttolo MA, Trinh L, Lumpkin JA, Rao G. 1993. Hyperoxia induces DNA damage in mammalian cells. Free Radic Biol Med. 14:267–276. doi:10.1016/0891–5849(93)90023-N
- Chabasse C, Bailly X, Rousselot M, Zal F. 2006. The multigenic family of the extracellular hemoglobin from the annelid polychaete Arenicola marina. Comp Biochem Physiol B Biochem Mol Biol. 144:319–325. doi:10.1016/j.cbpb.2006.03.007
- Collins JA, Schandi CA, Young KK, Vesely J, Willingham MC. 1997. Major DNA fragmentation is a late event in apoptosis. J Histochem Cytochem. 45:923–934.
- Costa AR, Withers J, Rodrigues ME, McLoughlin N, Henriques M, Oliveira R, et al. 2013. The impact of cell adaptation to serum-free conditions on the glycosylation profile of a monoclonal antibody produced by Chinese hamster ovary cells. N Biotechnol. 30:563–572. doi:10.1016/j.nbt.2012.12.002
- deZengotita VM, Abston LR, Schmelzer AE, Shaw S, Miller WM. 2002. Selected amino acids protect hybridoma and CHO cells from elevated carbon dioxide and osmolality. Biotechnol Bioeng. 78: 741–752. doi:10.1002/bit.10255
- Dhanasekharan KM, Sanyal J, Jain A, Haidari A. 2005. A generalized approach to model oxygen transfer in bioreactors using population balances and computational fluid dynamics. Chem Eng Sci. 60:213–218. doi:10.1016/j.ces.2004.07.118
- Dorai H, Ellis D, Keung YS, Campbell M, Zhuang M, Lin C, Betenbaugh MJ. 2010. Combining high-throughput screening of caspase activity with anti-apoptosis genes for development of robust CHO production cell lines. Biotechnol Prog. 26:1367–1381. doi:10.1002/btpr.426
- Drepper T, Huber R, Heck A, Circolone F, Hillmer A-K, Büchs J, Jaeger K-E. 2010. Flavin mononucleotide-based fluorescent reporter proteins outperform green fluorescent protein-like proteins as quantitative in vivo real-time reporters. Appl Environ Microbiol. 76:5990–5994. doi:10.1128/AEM.00701-10
- Figueroa B, Ailor E, Osborne D, Hardwick JM, Reff M, Betenbaugh MJ. 2007. Enhanced cell culture performance using inducible anti-apoptotic genes E1B-19K and Aven in the production of a monoclonal antibody with Chinese hamster ovary cells. Biotechnol Bioeng. 97:877–892. doi:10.1002/bit.21222
- Goswami J, Sinskey AJ, Steller H, Stephanopoulos GN, Wang DIC. 1999. Apoptosis in batch cultures of Chinese Hamster Ovary cells. Biotechnol Bioeng. 62:632–640. doi:10.1002/(SICI)1097-0290(19990320)62:6 <632::AID-BIT2> 3.0.CO;2-I
- Hu W-S, Aunins JG. 1997. Large-scale mammalian cell culture. Curr Opin Biotechnol. 8:148–153. doi:10.1016/S0958–1669(97)80093–6
- Jenkins N, Parekh RB, James DC. 1996. Getting the glycosylation right: implications for the biotechnology industry. Nat Biotechnol. 14:975–981. doi:10.1038/nbt0896–975
- Kaneko Y, Sato R, Aoyagi H. 2010. Evaluation of Chinese hamster ovary cell stability during repeated batch culture for large-scale antibody production. J Biosci Bioeng. 109:274–280. doi:10.1016/j.jbiosc.2009.09.044
- Kelley B. 2009. Industrialization of mAb production technology: the bioprocessing industry at a crossroads. MAbs. 1:443–452.
- Krampe B, Al-Rubeai M. 2010. Cell death in mammalian cell culture: molecular mechanisms and cell line engineering strategies. Cytotechnology. 62:175–188. doi:10.1007/s10616-010-9274-0
- Kurano N, Leist C, Messi F, Kurano S, Fiechter A. 1990. Growth behavior of Chinese hamster ovary cells in a compact loop bioreactor: 1. Effects of physical and chemical environments. J Biotechnol. 15:101–111. doi:10.1016/0168–1656(90)90054-F
- Lee JS, Ha TK, Park JH, Lee GM. 2013. Anti-cell death engineering of CHO cells: co-overexpression of Bcl-2 for apoptosis inhibition, Beclin-1 for autophagy induction. Biotechnol Bioeng. 110:2195–2207. doi:10.1002/bit.24879
- Majors BS, Betenbaugh MJ, Pederson NE, Chiang GG. 2008. Enhancement of transient gene expression and culture viability using Chinese hamster ovary cells overexpressing Bcl-x(L). Biotechnol Bioeng. 101:567–578. doi:10.1002/bit.21917
- Meents H, Enenkel B, Eppenberger HM, Werner RG, Fussenegger M. 2002. Impact of coexpression and coamplification of sICAM and antiapoptosis determinants bcl-2/bcl-x(L) on productivity, cell survival, and mitochondria number in CHO-DG44 grown in suspension and serum-free media. Biotechnol Bioeng. 80:706–716. doi:10.1002/bit.10449
- Muller B, Bourdais G, Reidy B, Bencivenni C, Massonneau A, Condamine P, et al 2006. Association of Specific Expansins with Growth in Maize Leaves Is Maintained under Environmental, Genetic, and Developmental Sources of Variation. Plant Physiol. 143:278–290. doi:10.1104/pp.106.087494
- Oller AR, Buser CW, Tyo MA, Thilly WG. 1989. Growth of mammalian cells at high oxygen concentrations. J Cell Sci. 94:43–49.
- Omasa T, Onitsuka M, Kim W-D. 2010. Cell engineering and cultivation of chinese hamster ovary (CHO) cells. Curr Pharm Biotechnol. 11:233–240.
- Pavlou AK, Reichert JM. 2004. Recombinant protein therapeutics—success rates, market trends and values to 2010. Nat Biotechnol. 22:1513–1519. doi:10.1038/nbt1204–1513
- Rita Costa A, Elisa Rodrigues M, Henriques M, Azeredo J, Oliveira R. 2010. Guidelines to cell engineering for monoclonal antibody production. Eur J Pharm Biopharm. 74:127–138. doi:10.1016/j.ejpb.2009.10.002
- Rousselot M, Delpy E, Drieu La Rochelle C, Lagente V, Pirow R, Rees J-F, et al. 2006. Arenicola marina extracellular hemoglobin: a new promising blood substitute. Biotechnol J. 1:333–345. doi:10.1002/biot.200500049
- Seth G, Hossler P, Yee JC, Hu W-S. 2006. Engineering cells for cell culture bioprocessing–physiological fundamentals. Adv Biochem Eng Biotechnol. 101:119–164.
- Sunstrom NA, Gay RD, Wong DC, Kitchen NA, DeBoer L, Gray PP. 2000. Insulin-like growth factor-I and transferrin mediate growth and survival of Chinese hamster ovary cells. Biotechnol Prog. 16:698–702. doi:10.1021/bp000102t
- Walsh G. 2006. Biopharmaceutical benchmarks 2006. Nat Biotechnol. 24:769–776. doi:10.1038/nbt0706–769
- Wuest DM, Harcum SW, Lee KH. 2012. Genomics in mammalian cell culture bioprocessing. Biotechnology Adv. 30:629–638. doi:10.1016/j.biotechadv.2011.10.010
- Wurm FM. 2004. Production of recombinant protein therapeutics in cultivated mammalian cells. Nat Biotechnol. 22:1393–1398. doi:10.1038/nbt1026
- Zal F, Green BN, Lallier FH, Toulmond A. 1997. Investigation by electrospray ionization mass spectrometry of the extracellular hemoglobin from the polychaete annelid Alvinella pompejana: an unusual hexagonal bilayer hemoglobin. Biochemistry. 36:11777–11786. doi:10.1021/bi9712899
- Zal F, Rousselot M. 2014. Extracellular hemoglobins from annelids, and their potential use in biotechnology. In S. L. Barre & J.-M. Kornprobst (Eds.). Outstanding Marine Molecules. Weinheim, German: Wiley-VCH Verlag GmbH & Co. KGaA, pp. 361–376. Retrieved from http://onlinelibrary.wiley.com/doi/10.1002/9783527681501.ch16/summary
- Zanghi JA, Renner WA, Bailey JE, Fussenegger M. 2000. The growth factor inhibitor suramin reduces apoptosis and cell aggregation in protein-free CHO cell batch cultures. Biotechnol Prog. 16:319–325. doi:10.1021/bp0000353