
Abstract
The aim of this study was optimization of risperidone (model drug) biodegradable nanoparticles utilizing emulsion–solvent evaporation technique. Box–Behnken design was adopted to optimize the preparation process. Optimized nanoparticles were characterized for surface morphology using scanning electron microscope. Pharmacokinetic parameters were compared with the marketed tablets. Results revealed that the optimized formula showed 297.37 nm, 85.12%, and 59.79% for Y1, Y2, and Y3, respectively. Optimized formula showed significant improved bioavailability compared with marketed tablets. Successful achievement of prolonged risperidone release with improved bioavailability is expected to maximize patients’ adherence to their antipsychotic drug therapy and to minimize risk of relapse during maintenance therapy.
Introduction
Several techniques have been developed to overcome drug’s poor aqueous solubility such as reduction of particle size, solubilization, solid dispersion, and complexation with hydrophilic carriers (Ahmed and El-Say Citation2014, Ahmed et al. Citation2014, Badr-Eldin et al. Citation2013). Size reduction of drug particles in the nanometer range has different pharmaceutical applications including enhancement of the solubility, dissolution, and bioavailability of poorly water-soluble drugs due to increase in the drug surface area (Ghadi et al. Citation2014). Reduction of the dose and rapid onset of drug action are other advantages. Poly (lactide-co-glycolide) (PLGA) and polycaprolactone (PCL) are among the polymeric materials widely used in medicine and pharmacology as drug nanocarriers. PLGA has gained a great interest in pharmacy due to biocompatibility, biodegradability, acceptable mechanical strength, and absence of an inflammatory response, irritation, or other adverse effect (Amass et al. Citation1998, Mohanty et al. Citation2000). PLGA degrades into the biocompatible lactic and glycolic acids. Both acids are eliminated from the body as carbon dioxide and water after they have entered the tricarboxylic acid cycle (Jalil and Nixon Citation1990). PCL is a biodegradable linear aliphatic polyester polymer produced by chemical synthesis from crude oil via the ring-opening polymerization of 3-caprolactone monomer. It possesses high toughness but relatively low strength (Hutmacher et al. Citation2001).
Risperidone (RIS), a benzisoxazole derivative, is clinically recommended for bipolar disorder and schizophrenia management (Muthu and Singh Citation2009). RIS has been approved by the U.S. Food and Drug administration for its fewer extrapyramidal side effects than conventional antipsychotics. However, extrapyramidal side effects are dependent on RIS dose (Sussman Citation2002). A low-dose RIS therapy is required to control the psychotic symptoms, and long-term treatment is intended to treat schizophrenia. Accordingly, it is recommended to use RIS in the lowest-effective dose to minimize the risk of associated side effects. The reduction in oral bioavailability of RIS (66%) is attributed to the low solubility of the drug in water and first-pass metabolism. The half-lives of RIS and its active metabolite, 9-hydroxy RIS, are 3 and 21 hours, respectively (Huang et al. Citation1993).
The aim of this work was to utilize experimental design to optimize biodegradable RIS nanoparticles (NPs) to improve the drug bioavailability and reduce extrapyramidal side effects. Emulsion–solvent evaporation technique utilizing mixture of PLGA and PCL, with poly-vinyl alcohol (PVA) as an emulsion stabilizer, was employed to prepare RIS NPs. Box–Behnken experimental design (BBD) deduced formulations were characterized for particle size, encapsulation efficiency, and amount of drug diffused within 24 hours. In vivo study of the optimized formula was compared with the marketed tablets.
Materials and methods
Materials
RIS was kindly supplied from Egyptian International Pharmaceutical Industries company (10th of Ramadan city, Egypt). PLGA acid terminated lactide:glycolide 50:50, molecular weight 24,000–38,000, PCL average molecular weight ∼14,000, PVA molecular weight 89,000–98,000, dichloromethane, and methanol for HPLC, ≥99.9%, were purchased from Sigma Aldrich Corp (St Louis, MO). Synthetic nylon membrane, 0.45 µm pore size, was procured from PALL Corporation, (Port Washington, NY).
Box–Behnken experimental design
Three-level three-factor BBD was implemented to obtain an optimized RIS NPs with minimum particle size, maximum encapsulation efficiency, and maximum cumulative amount of drug release in a controlled release pattern. Based on our preliminary investigation, the studied variables were: weight percentage of polymer to RIS (X1), percentage of PLGA in PCL (X2), and the emulsifier concentration (X3). The responses selected for evaluation were the particle size (Y1), encapsulation efficiency (Y2), and the cumulative amount of drug diffused within 24 hours (Y3). Generation and evaluation of the statistical experimental design was performed using Statgraphics Plus® For Windows (Manugistics, Inc., East Jefferson Street, Rockville, MD). summarizes the independent variables, their intervals, dependent variables, and their constraints selected to perform the BBD. The composition of the 15 formulations proposed is depicted in .
Table 1. Independent and dependent variables in Box–Behnken design
Table 2. Composition of the suggested NPs formulations according to BBD
Preparation of RIS NPs formulations
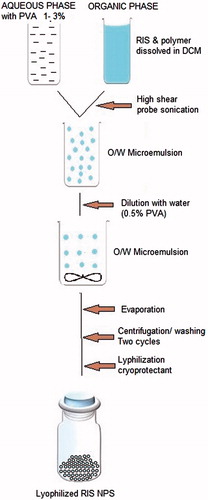
Formulations of RIS NPs were achieved using emulsion–solvent evaporation technique previously reported, but with slight modification (Kim et al. Citation2002). Briefly, the RIS (50 mg) and the specified weight of the polymer mixture, according to the design, were dissolved in 1.5 mL of DCM, and then the organic polymeric solution was added to 9 mL of distilled water containing different concentrations of PVA, according to the design, to form a primary emulsion. This emulsion was sonicated for 3 minutes and then was injected into distilled water (25 mL) containing 0.5% PVA under magnetic stirring at room temperature. DCM was eliminated at 25 °C under reduced pressure in a rotavapor (Buchi Rotavapor R-200 Buchi labortechink AG, Flawi, Switzerland). The obtained aqueous suspension was centrifuged for 45 minutes at 15,000 rpm to separate the NPs which were then subjected to freeze drying, using (alpha 1–2 LD plus, Christ lyophilizer, Christ, Osterode am Harz, Germany) using mannitol as a cryoprotectant. The formed NPs were stored at −20 °C for further investigation. shows a schematic representation of the preparation method.
Figure 1. Schematic presentation for the preparation of NPs by the emulsion–solvent evaporation method.
Characterization of the prepared NPs
Determination of particle size
Particle size of the prepared RIS NPs was determined by dispersion of a specific weight of the lyophilized formulae in 3 mL of distilled water and then measured using laser diffraction analyzer (Zetatrac, Microtrac, Montgomeryville, PA). Measurement of the particle size for each formulation was done in triplicate, and mean was calculated.
Determination of encapsulation efficiency
Specific weight of the lyophilized powder of RIS NPs was dispersed in 5 mL of DCM using probe sonicator, and then the volume was completed to 50 mL with methanol. The prepared solution was subjected to HPLC analysis using (Agilent 1200 series with UV diode-array detector, Santa Clara, CA). Separation was achieved on C (18) column using a mobile phase consisting of 0.05-m dipotassium hydrogen orthophosphate (containing 0.3% v/v triethylamine) adjusted to pH 3.7 with orthophosphoric acid (700 mL) and acetonitrile (300 mL). The flow rate was 0.6 mL/minute and the wavelength was 280 nm (Jones et al. Citation2009). Drug encapsulation efficiency (%) was calculated using Eq. (1).
(1)
In vitro diffusion study
The diffusion of RIS from the prepared RIS NPs was carried out using automated Franz diffusion (MicroettePlus™; Hanson Research, Chatsworth, CA) of 1.76 cm2 diffusion area and 7 mL of volume in the receptor chamber. A quantity of (1 mg) of RIS NPs was placed on the donor compartment and synthetic nylon membrane of 0.45 -µm pore size was used as a diffusion membrane (Ahmed et al. Citation2015). Phosphate buffer saline (pH 7.4) was used as a diffusion medium, the temperature was kept at 37 ± 0.5 °C and the stirring rate was 400 rpm. Aliquots withdrawn by the auto sampler at 0, 0.5, 1, 1.5, 2, 4, 6, 8, 12, and 24 hours and were analyzed by HPLC. The amount of RIS diffused from each formulation, carried out in triplicate, at each time point was calculated.
Box–Behnken experimental design statistical analysis
Results obtained for the dependent responses Y1, Y2 and Y3 were introduced into the response columns of the experimental design software and the model was run. Statistical analysis of the data was considered to be significant for any factor at P values <0.05.
Preparation and characterization of the optimized formulation
The optimized RIS NPs formulation proposed was prepared and characterized for the particle size, entrapment efficiency, and cumulative amount of RIS diffused within 24 hours as previously described. The observed and predicted values were compared, and residuals were estimated.
Kinetic treatment of the diffusion data
The diffusion data obtained for both, Box-Behnken formulations and the optimized one, were fitted to different kinetic models: zero-order, first-order, Higuchi, and Korsmeyer–Peppas models (Desai et al. Citation1966, Higuchi Citation1963, Korsmeyer et al. Citation1983, Ritger and Peppas Citation1987, Wagner Citation1969). The best fitness of the model was chosen to describe the mechanism of drug diffuse from the prepared RIS NPs.
SEM imaging of the optimized RIS NPs
Surface morphology of the optimized RIS NPs was visualized using scanning electron microscope (Jeol, JEM-100 CX, Japan). Before investigation, the sample was fixed onto metal stubs and then coated with gold under vacuum.
In vivo and pharmacokinetic parameters evaluation
The pharmacokinetics of RIS from the optimized NPs formula was compared with the marketed tablet after administration into male New Zealand white rabbit. Animals use was approved by the local Institutional Review Board for Preclinical & Clinical Research who ensured the care and use of animals conformed to the EU Directive 2010/63/EU on the protection of animals used for scientific purposes and Guiding Principle in Care and Use of Animals (DHEW publication NIH 80–23) & stick to the “Principles of Laboratory Animal Care” (NIH publication #85–23, revised in 1985). Rabbits were given full access to normal standard diet and tap water ad libitum, during the experiment. The animals were housed; two per cage in standard rabbit cages maintained at 22 ± 3 °C under a 12-hour light and 12-hour dark cycle and were acclimatized at least 1 week prior to the start of the experiment. The weight of the rabbits ranged from 2 to 2.5 kg. Rabbits were divided into three groups of six animals each, kept fasted for at least 24 hours prior to the experiments and administered a single oral dose of RIS (0.3 mg/kg) through a catheter. The first group received the reference (marketed) product as crushed tablet in distilled water. Second group received the test product (optimized RIS NPs formula). The third group was orally administered plain starch tablets (crushed) as negative control.
Blood samples of 1 mL were withdrawn from the marginal ear vein at predetermined time intervals: 0, 0.5, 1, 1.5, 2, 4, 6, 8, 12, and 24 hours. The collected blood samples were then centrifuged at 3500 rpm for 5 minutes, and the clear plasma (200 μL) was collected and stored at −20 °C till analysis using ultra performance liquid chromatography mass-mass (UPLC Ms/Ms Acquity TQ 3100, Waters, USA) equipped with; a Luna C18 (Phenomenex, Inc., Torrance, CA) and the Guard column was Phenomenex C18, mass detector (API 3200, MDS SCIEX, USA). An isocratic mobile phase consists of acetonitrile and 2 mM of ammonium acetate pH 4.3 (95:5 v/v) was delivered at a flow rate of 0.5 mL/min into the mass spectrometer’s electrospray ionization chamber. Quantitation was achieved by LC-MS/MS detection in positive ion mode for both RIS and dapoxetine (internal standard), using an API 3200 mass spectrometer equipped with a turbo ionspray TM interface at 400 °C. The ion spray voltage was set at 3500 V. The common parameters: nebulizer N2 gas temperature: 350 °C, drying N2 gas flow: 200 mL/min, sheath gas pressure: 30 Arb, and auxiliary gas pressure: 5 Arb. The peak area of transition from the m/z 411.45 precursor ion to m/z 191.25, with collision energy of 30 eV for RIS and the m/z 306.35 precursor ion to m/z 261.25, with collision energy of 15 eV for dapoxetine.
Extraction of the drug from the plasma was achieved by placing 250 µL of thawed plasma sample into a glass tube containing 25 µL of dapoxetine solution, selected as internal standard, and the mixture was mixed with 75 µL of 0.1 -N sodium hydroxide. Five milliliters of methyl-ter-butyl ether were added and then vortexed for 2 minutes. The tube was then centrifuged for 5 minutes at 4000 rpm and the upper organic phase was subjected to evaporation until dryness. The residue was dissolved in 100 μL of methanol, vortexed for 1 min and 10 μL was injected and the concentration of RIS was determined by modification from Cabovska et al. (Citation2007). Linearity range of the detection was between 50 and 1000 ng/mL. The determined LOD and LOQ were 1 ng/mL and 10 ng/mL, respectively.
Different pharmacokinetic parameters of RIS following oral administration of the two formulae were estimated from the obtained drug plasma concentration values using WinNonlin®, version 1.5 (Scientific Consulting, Inc., Cary, NC) using noncompartmental model. Maximum plasma concentration (Cmax), time to reach the maximum plasma concentration (tmax), the area under the plasma concentration–time curve from time zero to the last concentration time point (AUC0–t), the area under the plasma concentration–time curve from time zero to infinity (AUC0–∞), and mean residence time (MRT) after oral administration were determined. The relative bioavailability of the optimized RIS NPs was compared with that of the marketed tablets. The obtained data were expressed as mean ± SD and were statistically analyzed using GraphPad Prism 6 (GraphPad Software, San Diego, CA) to verify the differences between the tested groups. Two-way ANOVA followed by Sidak’s multi-comparison was used to assess the difference, and P values <0.05 was considered to be statistically significant. In addition, the 95% confidence level is considered for testing. Each test animal was compared with the reference individually at the respective time point.
Results and discussion
Preparation and characterization of RIS NPs
Maintenance of antipsychotic drug therapy maximizes patients’ adherence to their drug therapy and minimizes the risk of relapse compared with intermittent or interrupted drug therapy (Marder Citation2003). So, RIS NPs were developed with a view to deliver the drug in a controlled release manner. Three different formulation parameters that affecting the preparation of NPs were optimized utilizing Box–Behnken experimental design in which 15 formulations were designed, prepared, and characterized for particle size, drug content, and in vitro diffusion within 24 h. The results were used to correlate the independent variables that comprise the combination of ingredients of NPs with the dependent variables that represent the quality parameters of the RIS NPs. Emulsion–solvent evaporation method has been used successfully to prepare biodegradable NPs in an efficient and reproducible manner. The particle size, entrapment efficiency, and maximum amount of the drug diffused within 24 hours were identified and the obtained data are illustrated in . The diffusion of RIS from the prepared NPs showed sustained drug release pattern during 24 hours. Formulation F4 showed 12.26% of RIS diffused within 24 hours which is the least amount of drug diffused among all the studied formulations, while formulation F11 was the highest among all formulations that exhibited 82.47% of drug diffused in the same period.
To evaluate the effect of the studied factors and their levels on the responses, two-way analysis of variance (ANOVA) was performed. A factor was considered significant if the calculated P values <0.05. Synergistic and antagonistic effects of the factor were represented by positive and negative signs, respectively. illustrates the factor effects and associated P values for the studied responses resulted from ANOVA. According to the results obtained, X1 has a significant synergistic effect on Y1 with P values of 0.0236, while it has a no significant effect on Y2 and a significant antagonistic effect on Y3 with P values of 0.0001. Also, it was found that X2 has no significant effect on Y1 and Y2 with a significant antagonistic effect on Y3 with P values of 0.0001. On the other hand, X3 has a significant synergistic effect on both Y2 and Y3 with P values of 0.0474 and 0.0004, respectively with no significant effect on Y1. In addition, the interaction term of X1X2 showed a significant synergistic effect on Y3 with P values of 0.0051. On the other hand, the interaction terms of X1X3 and X2X3 revealed a significant antagonistic effect on Y3 with P values of 0.0151 and 0.0213, respectively. The interaction effect of X2X3 has significant synergistic effect on Y2 with P values of 0.0146. The quadratic term of X3 with P values of 0.0118 has significant synergistic effect on Y1 while the quadratic terms of X1 and X2 showed no significant effect on the studied responses. Results of the multiple linear regression analysis for each response variable derived by the best-fit method are shown in Eqs. (2–4) which reflect the quantitative influence of formulation variables and their interactions on the responses.
(2)
(3)
(4)
Table 3. Estimated effects of the studied factors and associated P values for the obtained responses (Y1–Y3)
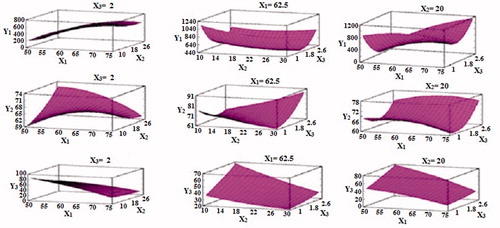
Pareto charts that demonstrate the effect of the independent variables and their interactions on each response were constructed as represented in . For each response, the chart includes a vertical reference line at a critical P value of 0.05. An effect that exceeds the vertical line is considered to be statistically significant. So, it is clear that X1 and X32 were significantly affecting Y1, while X3 and X2X3 were significantly affecting Y2, whereas X1, X2, X3, X1X2, X1X3, and X2X3 were significantly affecting Y3. Based on the model polynomial functions, response surface plots were constructed. The relationship between the dependent and independent variables can be further understood by these plots. Since the model has more than two factors, one factor was held constant while the other two variables are changing and therefore a total of nine response surface plots, three diagrams for each response, were obtained as depicted in .
Figure 2. Standardized Pareto charts for Y1, Y2, and Y3.
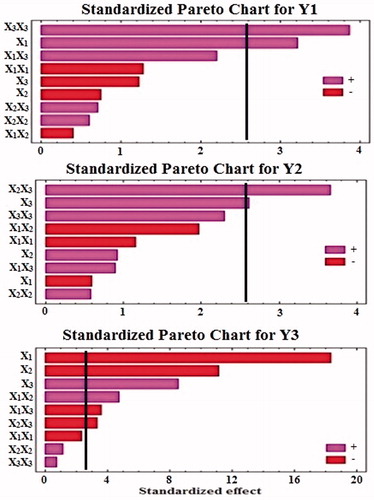
Figure 3. 3D-response surface plots showing the effect of X1, X2, and X3 on the responsesY1, Y2, and Y3.
A direct relationship was found between X1 and Y1. Increasing X1 from 50% to 75% results in increase the value of Y1 from 330 nm in F3 to 570 nm in F7, from 201 nm in F11 to 597 nm in F12, and from 657 in F6 to 803 nm in F4. It has been previously reported that polymer concentration has an effect on the particle size whereby higher concentrations will lead to overall larger particles (Kwon et al. Citation2001, Murakami et al. Citation1999). This is most likely attributed to the viscosity of the organic solution that increases upon increasing the polymer concentration and so results in poorer dispersability of the polymer solution into the aqueous phase. Highly viscous polymeric solution resists the force of shear during the emulsification process and produces coarse emulsion which leads to large-size particles during the diffusion process. The quadratic term of X3 has been found to have a direct effect on the size of the prepared particle. This could be attributed to the effect of increasing the concentration of PVA, above certain limit, could increase the viscosity of the aqueous medium that possibly hinder the fine dispersion of oil globules in the aqueous medium (Feng and Huang Citation2001). In the emulsion–solvent evaporation technique, the amount of surfactant plays an important role in the emulsification process (Cabovska et al. Citation2007, Feng and Huang Citation2001, Kwon et al. Citation2001, Marder Citation2003, Murakami et al. Citation1999, Quintanar-Guerrero et al. Citation1996, Rafati et al. Citation1997).
Results also have revealed that X3 has the main effect on Y2. Increasing X3 from 1% to 3% results in increase the value of Y2 from 60.91% in F4 to 78.29% in F2; from 61.82% in F5 to 83.3 in F9, and from 63.83% in F6 to 72.72% in F10. The interaction terms of X2X3 were found to significantly affecting the encapsulation efficiency. This could be attributed to the increase in PLGA content in PCL polymer (X2) that contributed in reducing the porosity of the prepared NPs. PLGA produces less porous polymeric matrix compared with PCL during NP formation. In addition, the results showed that the rest of variables, their interaction, and the quadratic terms have no significant effects on the (Y2). The direct relationship of X1 with Y2, although nonsignificant, can be attributed to the high polymer concentration effect on the encapsulation efficiency that can be attributed to two possible ways. First, in highly concentrated polymeric solution, the precipitation of the polymer is faster on the surface of the dispersed phase and hinders drug diffusion across the boundary (Marder Citation2003). Second, the high polymer concentration increases the viscosity of the solution that delays drug diffusion within the polymer globule (Bodmeier and McGinity Citation1988).
The results of Y3 showed that X1, X2, and X3 have the major effect on determining the diffusion of RIS NPs. There was an inverse relationship between X1 and X2 on Y3. This could be attributed to the sustained release characteristics (delaying action) and reduced porosity of the used polymers that hinder the diffusion of the drug from the polymer matrix as the percentage of the polymer mixture and/or percentage of PLGA increased. As X1 increased from 50% to 75%, Y3 decreased from 39.94% in F3 to 16.25% in F7, from 48.75% in F6 to 12.26% in F4, and from 82.47 in F11 to 26.2% in F12. Also, as X2 increased from 10 to 30%, the value of Y3 decreased from 26.2% in F12 to 16.25% in F7; from 44.25% in F1 to 27.89% in F5, and from 82.47 in F11 to 39.94% in F3. On the contrary, there was a direct relationship between X3 and Y3. As the percent of X3 increased from 1% to 3%, Y3 increased from 12.26% in F4 to 19.93% in F2; from 44.25% in F1 to 76.85% in F8, and from 48.75% in F6 to 81.3% in F10. PVA that was used as stabilizer reduces the surface tension of the prepared emulsion thus creating the smallest particles with improved drug diffusion characteristics with the increase in PVA concentration (Feng and Huang Citation2001, Quintanar-Guerrero et al. Citation1996).
Box–Behnken experimental design statistical analysis
To reach a combination of factor levels which maximize the desIANBility function, an optimized formulation was proposed. According to this formulation, the optimum values for X1, X2, and X3 are 50.0271, 26.9485, and 3.0, respectively. This formulation was prepared and characterized for Y1, Y2, and Y3 as previously described. The predicted values for these dependent variables were 303.865, 83.1333, and 61.2955, respectively while the observed values for the same variables were 297.37, 85.12, and 59.79, respectively.
Kinetic treatment of the in vitro diffusion data
The kinetic of the diffusion behavior of RIS from the prepared NPs was studied in which the goodness-of-fit method was used. According to the values of the correlation coefficient (r), all the studied formulations were in favor of the Higuchi model when compared with zero-order and first-order models (). The semi-empirical equation Mt/M∞ = Ktn was used to determine the drug release mechanism.(Peppas Citation1985) The data obtained for the exponent ‘n’ were between 0.5 and 1 indicating non-Fickian or anomalous release mechanism and so the release could be attributed to a combination of diffusion and polymer relaxation mechanism ().
Table 4. Correlation coefficient (r) of different kinetic models and drug release mechanism (n), of RIS NPs formulations prepared according to Box Behnken design
SEM imaging of the optimized RIS NPs
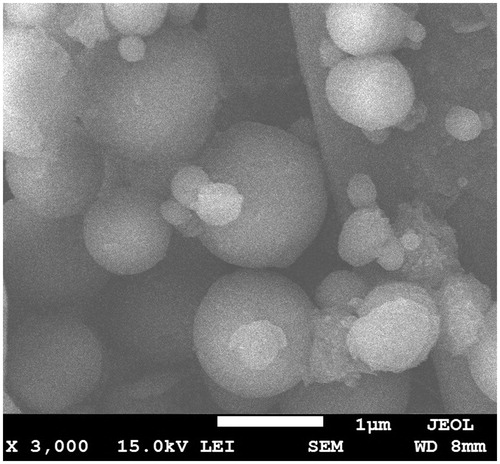
Surface morphology of the optimized RIS NPs depicted in showed smooth surface with almost spherical NPs with particle size range comparable to the size observed by the laser diffraction method.
Figure 4. SEM image of optimized RIS NPs formula.
In vivo and pharmacokinetic parameters evaluation in rabbits
To have an idea about the in vivo performance of the prepared RIS NPs, the optimized formulation was given to New Zealand white rabbits in a single oral dose of RIS (0.3 mg/kg) and compared with the marketed tablets. Rabbits were chosen as an animal model due to their convenient size, easy handling, and lower cost in comparison with larger animals. The mean plasma concentration–time profiles of RIS are represented in . The values of Cmax, tmax and AUC0–24, and MRT, for RIS from these formulations, are summarized in .
Figure 5. Mean plasma concentration-time profile of RIS after oral administration of single dose (0.3 mg/kg) of the marketed risperidon tablet and optimized RIS NPs, each point represents the mean of n = 6 ± SD.
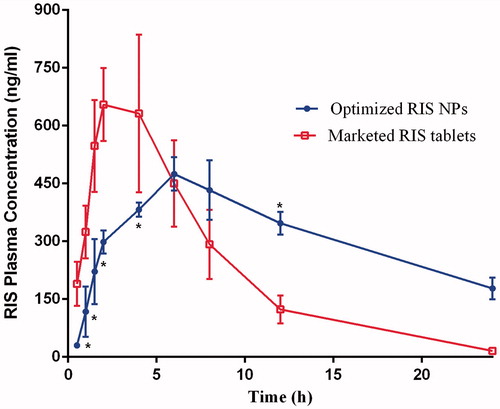
Table 5. Pharmacokinetic parameters of RIS following the administration of a single oral dose (0.3 mg/kg) of the marketed tablets, and the optimized formula of RIS NPs
The results indicated that the bioavailability of RIS from optimized formula was improved when compared with the marketed tablets. The Cmax was decreased significantly from 654.66 in the marketed tablet to 474.77 ng/mL in the RIS NPs, which could be attributed to the sustained release characteristics of the optimized RIS NPs. Moreover, the tmax of RIS delayed to 6.07 hours in the optimized NPs when compared with 2.67 hours in the marketed tablets. The optimized RIS NPs allowed for improved permeability parameters and modify the release of RIS that could allow for decrease in both the dosing frequency and the amount of drug administered. This will be reflected on reduced extrapyramidal side effects of RIS. Based on these results, optimization of RIS NPs formulations is a promising approach for enhancing the bioavailability of the drug.
Conclusion
Successful achievement of optimized prolonged release RIS formulation was accomplished from drug-loaded NPs utilizing Box–Behnken design that explored the influence of three different formulation parameters on RIS NPs particle size, encapsulation efficiency, and cumulative RIS diffused within 24 hours. The optimized drug formulation showed significant improvement in drug bioavailability compared with marketed tablets. The prolonged release of along with improvement in bioavailability will maximize patients’ adherence to their antipsychotic drug therapy and to minimize the risk of relapse during maintenance drug therapy
Acknowledgements
The authors would like to thank Dr K M El-Say (Faculty of Pharmacy, King Abdulaziz University) for useful discussions of the experimental design work.
Disclosure statement
The authors report no conflicts of interest in this work.
References
- Ahmed TA, El-Say KM. 2014. Development of alginate-reinforced chitosan nanoparticles utilizing W/O nanoemulsification/internal crosslinking technique for transdermal delivery of rabeprazole. Life Sci. 110:35–43.
- Ahmed OAA, Ahmed TA, Abdel-naim AB, Khedr A, Banjar ZM, Afouna MI. 2014. Enhancement of in vitro skin transport and in vivo hypoglycemic efficacy of glimepiride transdermal patches. Trop J Pharm Res. 13:1207–1213.
- Ahmed OAA, Hosny KM, Al-Sawahli MM, Fahmy UA. 2015. Optimization of caseinate-coated simvastatin-zein nanoparticles: improved bioavailability and modified release characteristics. Drug Des Devel Ther. 9:655–662.
- Amass W, Amass A, Tighe B. 1998. A review of biodegradable polymers: uses, current developments in the synthesis and characterization of biodegradable polyesters, blends of biodegradable polymers and recent advances in biodegradation studies. Polym Int. 47:89–144.
- Badr-Eldin SM, Ahmed TA, Ismail HR. 2013. Aripiprazole-cyclodextrin binary systems for dissolution enhancement: effect of preparation technique, cyclodextrin type and molar ratio. Iran J Basic Med Sci. 16:1223–1231.
- Bodmeier R, McGinity JW. 1988. Solvent selection in the preparation of poly(dl-lactide) microspheres prepared by the solvent evaporation method. Int J Pharm. 43:179–186.
- Cabovska B, Cox SL, Vinks AA. 2007. Determination of risperidone and enantiomers of 9-hydroxyrisperidone in plasma by LC-MS/MS. - in by -/. J Chromatogr B Analyt Technol Biomed Life Sci. 852:497–504.
- Desai SJ, Singh P, Simonelli AP, Higuchi WI. 1966. Investigation of factors influencing release of solid drug dispersed in inert matrices. 3. Quantitative studies involving the polyethylene plastic matrix. J Pharm Sci. 55:1230–1234.
- Feng S, Huang G. 2001. Effects of emulsifiers on the controlled release of paclitaxel (Taxol) from nanospheres of biodegradable polymers. Taxolfrom nanospheres biodegradable. J Control Release. 71:53–69.
- Ghadi A, Mahjoub S, Tabandeh F, Talebnia F. 2014. Synthesis and optimization of chitosan nanoparticles: potential applications in nanomedicine and biomedical engineering. Caspian J Intern Med. 5:156–161.
- Higuchi T. 1963. Mechanism of sustained-action medication. Theoretical analysis of rate of release of solid drugs dispersed in solid matrices. J Pharm Sci. 52:1145–1149.
- Huang ML, Peer AV, Woestenborghs R, De Coster R, Heykants J, Jansen AA, et al. 1993. Pharmacokinetics of the novel antipsychotic agent risperidone and the prolactin response in healthy subjects. Clin Pharmacol Ther. 54:257–268.
- Hutmacher DW, Schantz T, Zein I, Ng KW, Teoh SH, Tan KC. 2001. Mechanical properties and cell cultural response of polycaprolactone scaffolds designed and fabricated via fused deposition modeling. J Biomed Mater Res. 55:203–216.
- Jalil R, Nixon JR. 1990. Biodegradable poly(lactic acid) and poly(lactide-co-glycolide) microcapsules: problems associated with preparative techniques and release properties. J Microencapsul. 7:297–325.
- Jones T, Van Breda K, Charles B, Dean AJ, McDermott BM, Norris R. 2009. Determination of risperidone and 9-Hydroxyrisperidone using HPLC, in plasma of children and adolescents with emotional and behavioural disorders. Biomed Chromatogr. 23:929–934.
- Kim BK, Hwang SJ, Park JB, Park HJ. 2002. Preparation and characterization of drug-loaded polymethacrylate microspheres by an emulsion solvent evaporation method. J Microencapsul. 19:811–822.
- Korsmeyer RW, Gurny R, Doelker E, Buri P, Peppas NA. 1983. Mechanisms of potassium chloride release from compressed, hydrophilic, polymeric matrices: effect of entrapped air. J Pharm Sci. 72:1189–1191.
- Kwon HY, Lee JY, Choi SWJang YKim JH. 2001. Preparation of PLGA nanoparticles containing estrogen by emulsification–diffusion method. Coll Surfaces Physicochem Eng Asp. 182:123–130.
- Marder SR. 2003. Overview of partial compliance. J Clin Psychiatry. 1:3–9. 64 Suppl.
- Mohanty AK, Misra M, Hinrichsen G. 2000. Biofibres, biodegradable polymers and biocomposites: an overview. Macromol Mater Eng. 276:1–24.
- Murakami H, Kobayashi M, Takeuchi H, Kawashima Y. 1999. Preparation of poly(dl-lactide-co-glycolide) nanoparticles by modified spontaneous emulsification solvent diffusion method. Int J Pharm. 187:143–152.
- Muthu MS, Singh S. 2009. Poly (D, L-lactide) nanosuspensions of risperidone for parenteral delivery: formulation and in-vitro evaluation. Curr Drug Deliv. 6:62–68.
- Peppas NA. 1985. Analysis of Fickian and non-Fickian drug release from polymers. Pharm Acta Helv. 60:110–111.
- Quintanar-Guerrero D, Fessi H, Allémann E, Doelker A. 1996. Influence of stabilizing agents and preparative variables on the formation of poly(d,l-lactic acid) nanoparticles by an emulsification-diffusion technique. Int J Pharm. 143:133–141.
- Rafati H, Coombes AG, Adler J, Holland J, Davis SS. 1997. Protein-loaded poly(dl-lactide-co-glycolide) microparticles for oral administration: formulation, structural and release characteristics. J Control Release. 43:89–102.
- Ritger PL, Peppas NA. 1987. A Simple Equation for Description of Solute Release. II. Fickian and Anomalous Release from Swellable Devices. J Control Release. 5:1987.
- Sussman N. 2002. Choosing an atypical antipsychotic. Int Clin Psychopharmacol. 17 Suppl 3:S29–S33.
- Wagner JG. 1969. Interpretation of percent dissolved-time plots derived from in vitro testing of conventional tablets and capsules. J Pharm Sci. 58:1253–1257.